Sidebar
eas-guide:monte-carlo
Table of Contents
Monte Carlo
Monte Carlo is the best tool for testing the strategy robustness. When you create a strategy, you see its backtest statistics. However, the strategy might be over-optimized (curve fitted). The goal of the Monte Carlo tool is to verify that the strategy is not over-optimized. This tool allows you to apply random changes to the market data, the execution of the strategy and the numeric parameters of the strategy indicators.
If you make minor changes to the strategy and its environment, and the strategy continues to have good profits, this means that the strategy has a good chance of making money on the real market.
On the other hand – if you make some minor changes and the strategy profits crumble, it means that this strategy is over-optimized and thus, it is a bad choice to trade.
When you run the Monte Carlo tool, you actually do not run just a single test but 20 (by default) tests. Each test is random. It can use one or more simulations.
Simulations
Here you can choose the simulations that will be used in the Monte Carlo tests. You select optional parameters for each simulation from the Options tab.
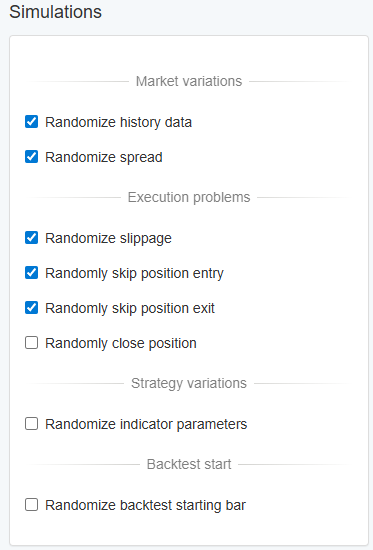
Market variations
- Randomize history data - The tool will take a certain number of random bars and change their range. It can change the bar's Low and High values in both directions. This will result in having higher or shorter bars.
- Randomize spread - If this option is enabled, EA Studio can set the spread to a different value. It might vary within the limits set in Options.
Execution problems - These are related to problems when executing the signals sent from the Expert Advisor to the broker.
- Randomize slippage - Slippage is present on markets where the prices change quickly. There may be a situation where the price changes by one or two ticks before the order gets to the broker and gets executed. If you enable this option, Monte Carlo will sometimes add a slippage in a direction contrary to the direction of the position. In the Options, you can set how often to use slippage and how much the slippage should be.
- Randomly skip position entry - Will skip opening some of the positions. This sometimes happens in the real world. It might occur due to problems on the broker's side, Internet connection issues or slowness in the machine executing the Expert Advisor.
- Randomly skip position exit - Will sometimes skip closing the position. This one, of course, can be very destructive to the strategy. Not opening a position is not so bad since we won't lose any money. But not closing a position might result in a loss.
- Randomly close position - This happens only occasionally. Your broker might close your position for some reason. Of course, brokers who close your positions at their discretion are not the ones you should be trading with.
Strategy variations
- Randomize indicator parameters - EA Studio comes with this option off by default. This is because usually strategies do not change. If enabled, EA Studio will select some indicators in the strategy and adjust their numeric values by a certain percentage (only for the test). If you have an over-optimised strategy, even minor changes in its parameters will make the profits drop significantly, or the strategy may even lose money.
Backtest start
We call “order chain” the sequence of executed orders. As we have winning and losing positions, the total performance of the backtest depends on the starting point.
For example, if we start the test on a local performance high, then the following losing period may cause a significant drawdown.
The opposite case is also possible - if we start the test on a local low, the subsequent gains may show overestimated results.
- Randomize backtest starting bar - searches for a following opposite direction signal and starts the test from there. It causes the backtest to begin with an opposite trade. This simulation aims to identify cases where initiating with an opposite trade compromises strategy performance. If the count of the shadowed opposite orders is lower than the selected count of tests, Monte Carlo uses a random starting bar.
Simulations chart
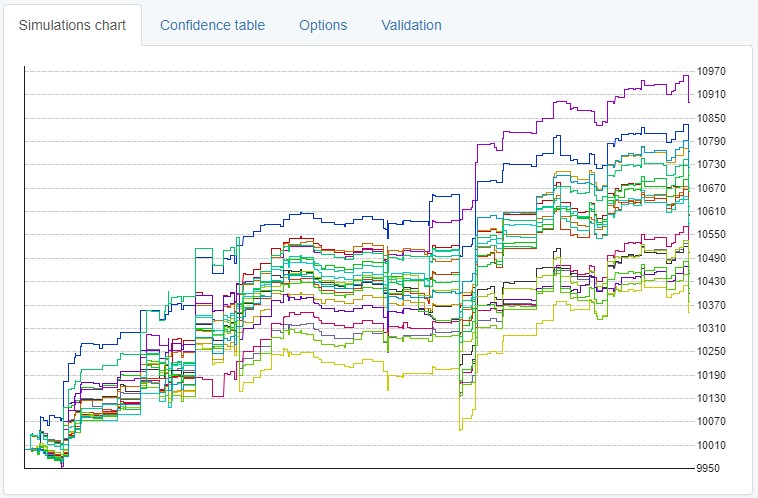
By the default running the Monte Carlo tool will run 20 tests with randomized data. The randomization of the data will be done according to the Simulations checklist and the values in the Options tab.
Each of the tests will be drawn on the Simulations chart with a colored line. You can see how the lines are grouped and what the end result is of each backtest. This can easily show how robust the strategy was and how destructive the randomized environment and data turned out to be for it.
Confidence table
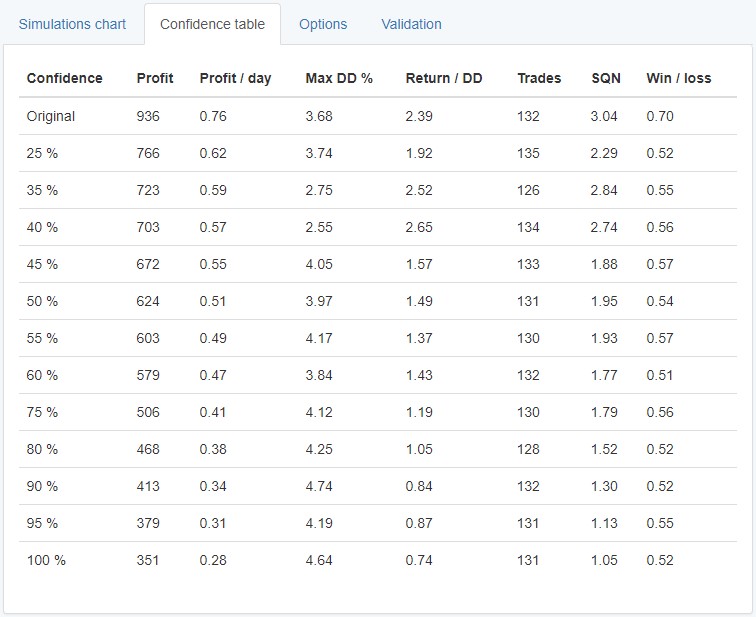
This table shows different statistics from the testing.
The first row shows the initial strategy (the one you are using the Monte Carlo tool on).
The first column shows the percentage of tests that showed results better than the current row. “Confidence” column shows the probability for the profit to be higher than the “Net Balance” value.
For example in the screenshot above, you see the lowest row shows 100% confidence. This “assures” us that if we have traded this strategy, we could expect it to make at least 351 over the given period. This of course if based on 20 random tests and has a great risk of being incorrect as soon as we run the tests anew or trade the strategy on a live account.
The tool is only named “Confidence Table” to be easily recognized by traders who used it in other software. However neither here, nor in other software is the Confidence Table about confidence. It's only a tool that groups the results from the random tests in the past and shows us how many of them succeeded and how much the succeeded. This means that if you rerun the Monte Carlo tests, you almost certainly won't get the same results.
Monte Carlo uses historical data therefore it cannot guarantee or predict the strategy's future success. At best it can only point out if a strategy is over-optimized for the market data we have.
Settings
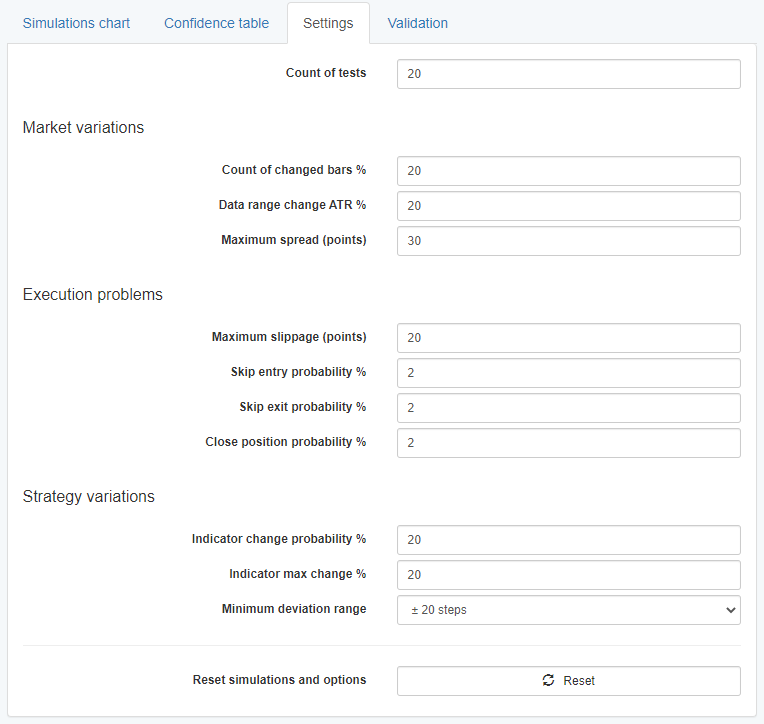
- Count of tests - choose how many tests you want to run.
All the options below will apply to the tests only if they are enabled from the Simulations checklist
Market variations
- Count of changed bars % - what percentage of the bars should be changed.
- Data range change ATR % - how much the bars should change in percent based on Average True Range.
- Maximum spread (points) - what should the maximum spread be when using Randomize spread
Execution problems
- Maximum slippage (points) - how much can the maximum Random slippage be in points
- Skip entry probability % - For each new entry there will be a probability (default 2%) to skip opening the position.
- Skip exit probability % - For each exit there will be a probability (default 2%) to skip exiting the position.
- Close position probability % - What is the chance of a position being closed in each bar.
Strategy variations
- Indicator change probability % - chance of changing an indicator parameter value. By default only 20% of the parameters will be changed and 80% of the parameters will remain unchanged.
- Indicator max change % - shows how much a changed parameter's value can deviate from the original value.
- Minimum deviation range - by default 20 steps. This setting is meant for indicators that have parameters with very low values where changing the value by 20% won't make much difference. In these types of cases, the Minimum deviation range will be used and the indicator will be changed by 20 steps (by default) or however much you set.
- Reset button - resets all the fields within Simulations and Options to their default values.
Validation
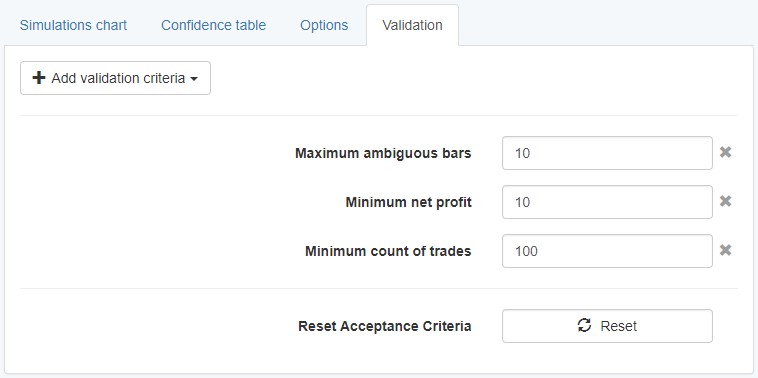
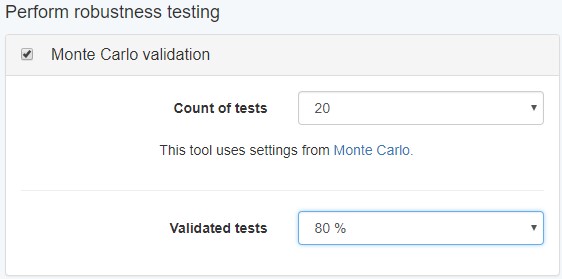
When running the Reactor or the Validator, Monte Carlo testing is present in the Robustness testing section.
The Validated tests setting uses the Validation settings in the Monte Carlo tool here.
These are very similar and work in the same way as the general Acceptance Criteria for the collection works.
In the above example, a strategy will be considered to have passed the Monte Carlo validation only if at least 80% of the tests pass.