Sidebar
eas-guide:generator
Table of Contents
Generator
The Generator is a unique tool that:
- composes Expert Advisors automatically;
- calculates the Experts' backtest against historical data;
- presents the results in stats and charts;
- collects the best Experts in a Collection;
- shows the most profitable Expert for the calculating session;
- works in the background when you let it run and open another browser window.
Quick Start
- Load data from the Editor – the Generator uses the data set selected in the Editor. In the Editor you set data server, symbol and period. The Generator shows the loaded data info in the Market Info tab.
- Set Entry lots – set the trading amount for opening a position in the left hand side panel.
- Start – press the Start button and the Generator will perform thousands of calculations per minute in order to find the best strategy. You can leave the Generator working while you work on another strategy in the Editor tab. It will collect the best strategies in the Collection.
- Edit – you can edit the best strategy in the Editor.
- See all experts – the Generator collects the best profitable strategies in the Collection.
User Interface
The Generator interface consists of several parts:
- Toolbar - located at the top, it controls the Generator;
- Parameters – the configuration panels are located at the left hand side;
- Information – the right hand side of the screen displays all input and output parameters and charts.
Toolbar

The Generator's toolbar contains a button for start and stop, the percentage shows how much of the current task is complete. In the toolbar you can also see the number of the calculated strategies and a button for editing the best of the generated Experts.
Start / Stop button – Starts/Stops the generation process. When the Generator is running, it composes and calculates Experts. It stops automatically when the preset working time has been reached.
Progress - the progress value represents the percent of the time that passed from the start of the generator compared to the preset working time.
Calculated - the number of the calculated strategies for the current run.
Edit - the Edit button loads the current strategy in the Editor. There you can view and change the indicators.
Strategy Properties
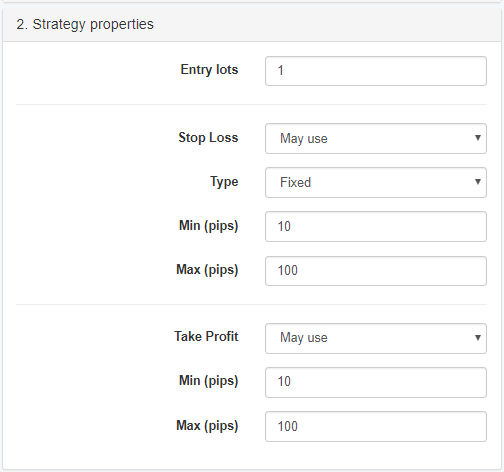
Entry Lots – this number sets the trading amount in lots for opening a new position. Please consider the value well. It must correspond to your initial account and the lot size defined by your broker.
Stop Loss usage – the Generator takes this parameter into account when it sets the strategy Stop Loss. There are three options:
- Do not use – the Generator will not use Stop Loss.
- May use – the Generator may or may not use Stop Loss.
- Always use – the Generator will use Stop Loss. It will define the Stop Loss value automatically. Generated Experts might have different Stop Loss value.
The Stop Loss can be either “Trailing”, “Fixed” or “Fixed or Trailing”.
Take Profit usage – it determines whether the Generator uses Take Profit. There also three options available, as above.
Generator Settings
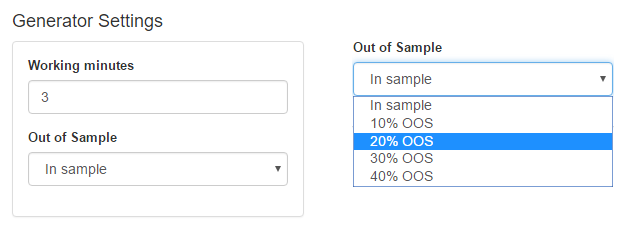
Working minutes – the working time of the Generator. You can start the Generator, let it work and it will stop after its preset time.
Out of Sample – OOS is a very important concept and it is almost always used by experienced traders. Using it makes the strategy much more reliable.
When you use the 'In sample' option, the Generator searches for the best strategy by comparing the net balances of the calculated strategies.
When you use 30% OOS, the Generator first calculates the position of the data bars, which corresponds to the 30% of the data series. Then it takes this bar balance for comparing.
The OOS is basically a simulation of real trading. So, if you have designed the strategy using the first 70% of the data and after that you trade the strategy for the remaining 30% of the data. This is also called 'future test in the past' or 'testing with unknown data'. The goal of OOS is to achieve a smooth upward line in the OOS Zone. If this is not the case, the strategy is not suitable to be traded. On the other hand, even if the balance line is smoothly rising, this in no way guarantee the strategy will be profitable, but it will certainly have a much greater chance to make profits than an strategy with a fluctuating balance.
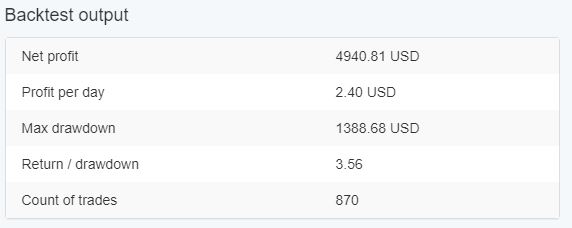
Output information
Backtest result – this table contains the statistical information from the backtest of the shown Expert.
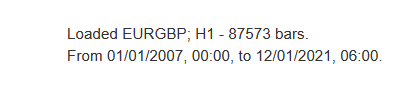
Market info - this table shows information about the loaded data file. You can change the data series from the Editor tab.
Balance chart – this shows the Expert performance over the entire time of the backtest. The chart plots two main lines:
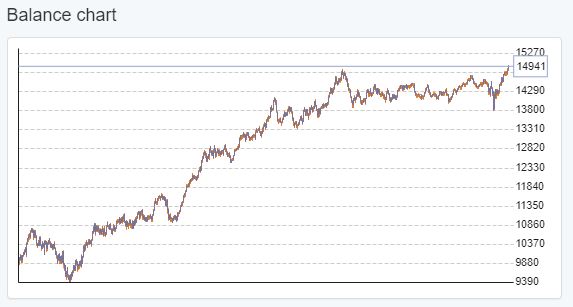
- Balance line (in blue) - represents the result of the closed positions.
- Equity line (in yellow)- represents the effect of the floating profit/loss.
Indicator Chart – outlines the price bars and the indicators used in the Expert.