Sidebar
Table of Contents
Report
The Report page shows more detailed information of the backtest of the currently loaded strategy in the Editor.
The page consists of four tabs: Stats info, Indicator char, Balance chart, Journal.
Stats info

There are three information panels in the Stats info tab.
Account info
- Initial account - the amount of your initial account. You change this value in the Settings page.
- Payout - it determines the return of a profitable deal.
Market info
This table contains all information for the data set loaded in the application and used for backtesting the current expert. You can change the currently loaded data file from the Editor page.
Backtest result
This panel shows the values of all statistical parameters calculated by the backtesting engine of BO Tester.
- Net balance - the end amount in the trading account. The Net Balance is measured in the account's currency.
- Max drawdown - the reduction of the account after a series of losing trades. This is normally calculated by getting the difference between the previous account peak minus the lowest following bottom. The drawdown is shown as a percentage of the trading account.
- Executed orders - this is the number of executed deals.
- Profit per day - an average of the money gained by the strategy per day.
- Win / loss - calculated by dividing the count of the winning trades by the count of all trades in percent.
- Sharpe ratio - measures the risk-adjusted return. The higher the Sharpe ratio is, the better the Expert is.
- Average HPR - shows the average return received from holding an asset or portfolio of assets over a period of time, expressed as a percentage.
- Profit factor - the dollar amount an Expert made for every dollar it lost.
- System Quality number - the SQN number was studied by Dr Van Tharp. He found that the higher the SQN is, the better the trading system is.
- Max consecutive losses - the maximal number of consecutively loosing deals during the time of the backtest.
Indicator chart

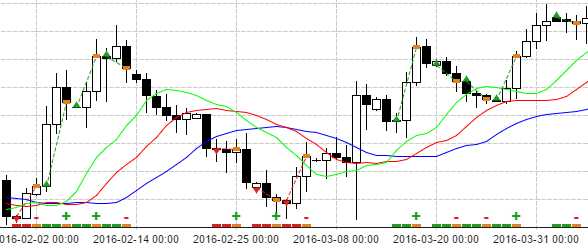
The Indicator chart shows the price bars, the indicators, the signals and the positions. The colored bars at the bottom of the price chart shows the open Up and Down deals. The plus, the minus and the equal sign show if the deal closes at Win, Loss or Draw.
Balance Chart

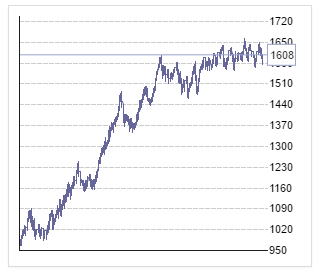
The chart shows the balance line and the equity lines produced by the backtest.
Journal

The Journal shows all trades made by the program during the backtest.
- Id - the Id number of the deal.
- Type - the trade direction. It can be either Up or Down.
- Open price - the price at which we open a deal. It is called Strike in the Options terminology.
- Close price - the price at the moment of an Option's expiration. It is also known as a Settlement price.
- Open time - the time of opening the deal.
- Close time - the exact time of expiration of an Option. It is known as Expiry.
- Investment - the money we invest and risk when open a deal. Another term for that is Stake.
- Profit - the money we win or lose when an Option expires. The profit depends on the Payout.
- Balance - the accumulated balance for the time for the backtest.
~~DISQUS~~