forex software

Create and Test Forex Strategies

forex software

Skip to forum content

Forex Software

Create and Test Forex Strategies

You are not logged in. Please login or register.


(Page 22 of 44)

Forex Software → Market Analysis → Forex Technical Analysis & Forecast by RoboForex

Pages Previous 1 20 21 22 23 24 44 Next

You must login or register to post a reply

RSS topic feed

Posts: 526 to 550 of 1,098

Re: Forex Technical Analysis & Forecast by RoboForex

Fibonacci Retracements Analysis 14.10.2021 (Brent, Dow Jones)
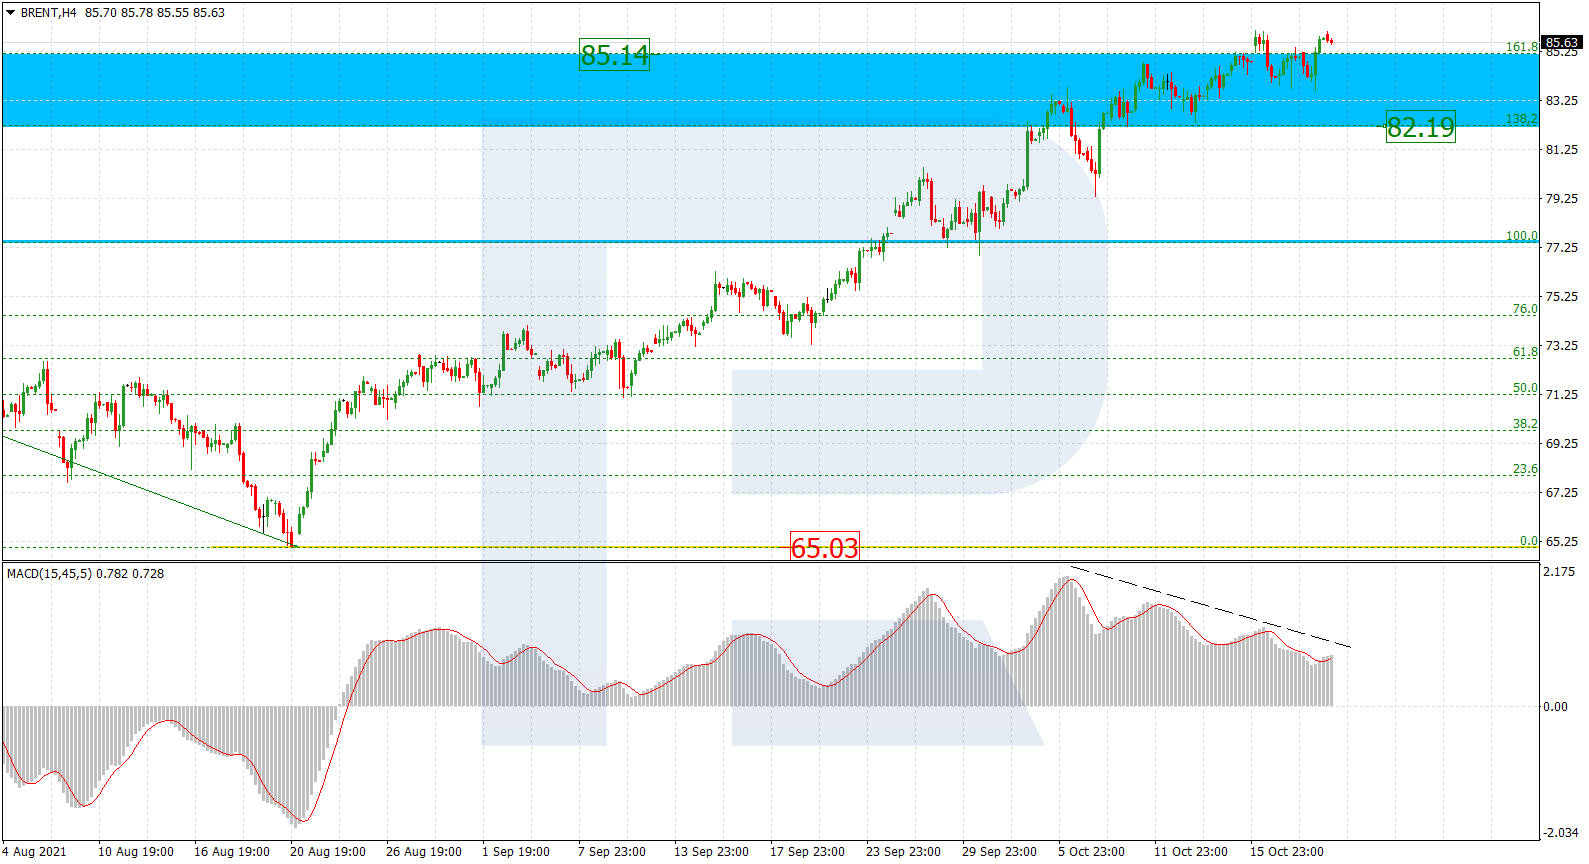
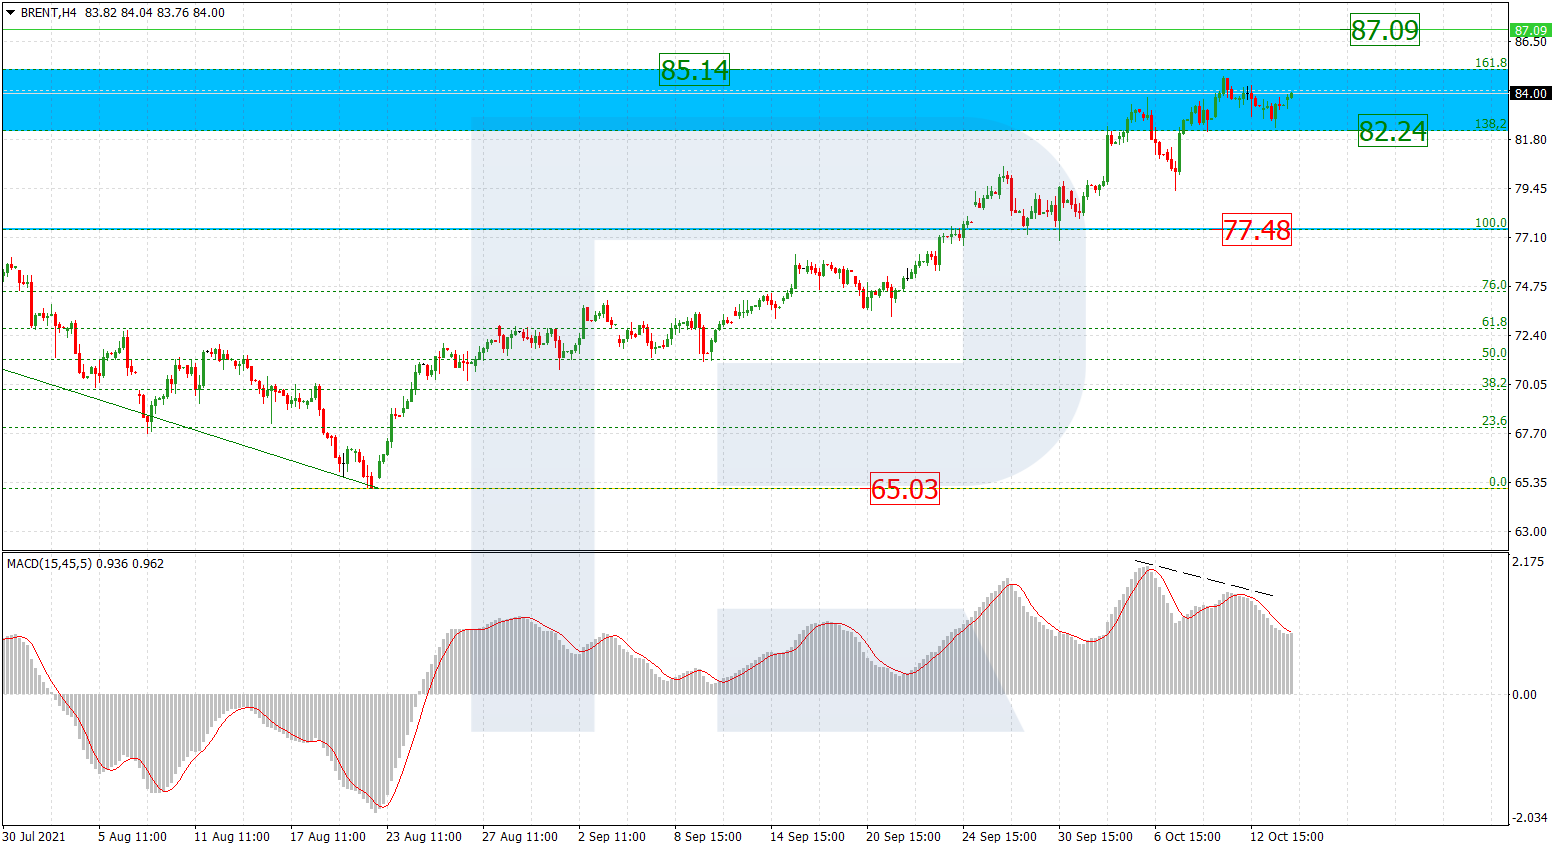
Brent

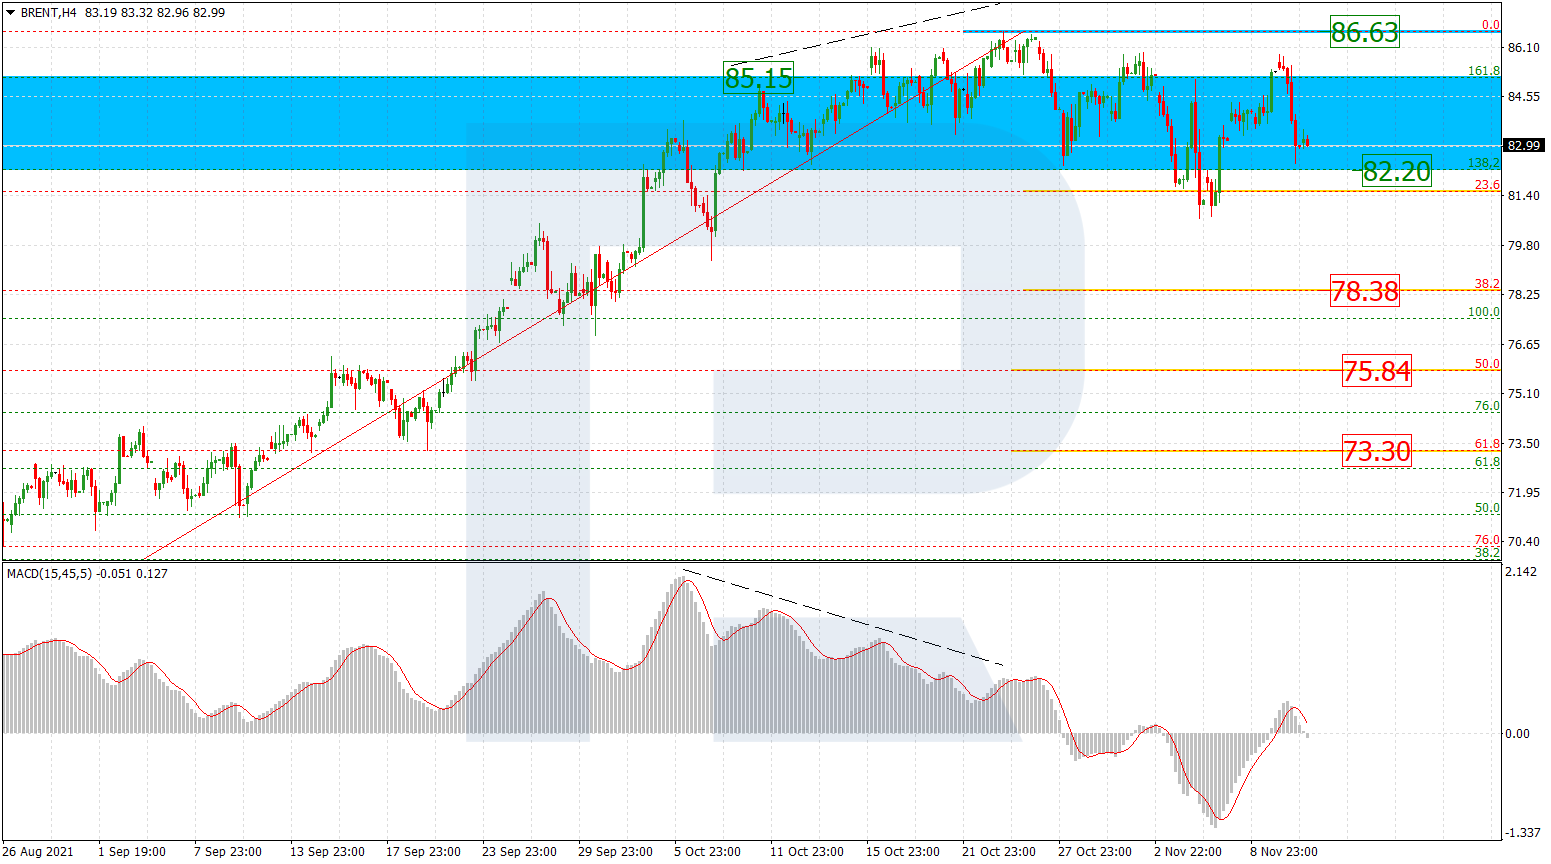
As we can see in the H4 chart, after breaking the high at 77.48, Brent has entered the post-correctional extension area between 138.2% and 161.8% fibo at 82.19 and 85.14 respectively. The next upside target is the fractal high at 87.09. At the same time, there is a divergence on MACD, which may indicate a possible pullback to the downside with the closest target at 77.48. The key support here remains the local low at 65.03.

https://roboforex.com/uploads/roboforecast/roboforex.com/99/2021/Fibo/october/14/BRENTH4.png

Read more - Fibonacci Retracements Analysis Brent, Dow Jones

Re: Forex Technical Analysis & Forecast by RoboForex

Japanese Candlesticks Analysis 15.10.2021 (USDCAD, AUDUSD, USDCHF)

USDCAD, “US Dollar vs Canadian Dollar”

As we can see in the H4 chart, after forming several reversal patterns, including Hammer, close to the support level, USDCAD may reverse in the form of a new correctional impulse. In this case, the correctional target may be the resistance area at 1.2445. However, an alternative scenario implies that the asset may continue falling to reach 1.2300 without reversing and correcting.

https://roboforex.com/uploads/roboforecast/roboforex.com/99/2021/Candles/october/15/USDCADH4.png

Read more - Japanese Candlesticks Analysis USDCAD, AUDUSD, USDCHF

Re: Forex Technical Analysis & Forecast by RoboForex

Ichimoku Cloud Analysis 18.10.2021 (EURUSD, BRENT, USDJPY)

EURUSD, “Euro vs US Dollar”

EURUSD is trading at 1.1571; the instrument is moving inside Ichimoku Cloud, thus indicating a sideways tendency. The markets could indicate that the price may test the cloud’s downside border at 1.1555 and then resume moving upwards to reach 1.1675. Another signal in favour of a further uptrend will be a rebound from the descending channel’s upside border. However, the bullish scenario may no longer be valid if the price breaks the cloud’s downside border and fixes below 1.1520. In this case, the pair may continue falling towards 1.1430. To confirm further growth, the asset must break the cloud’s upside border and fix above 1.1625.

https://roboforex.com/uploads/roboforecast/roboforex.com/99/2021/Ichimoku/october/18/eurusd.png

Read more - Ichimoku Cloud Analysis EURUSD, BRENT, USDJPY

Re: Forex Technical Analysis & Forecast by RoboForex

Murrey Math Lines 19.10.2021 (AUDUSD, NZDUSD)

AUDUSD, “Australian Dollar vs US Dollar”

In the H4 chart, after breaking the 200-day Moving Average, AUDUSD is trading above it, thus indicating an ascending tendency. In this case, the price is expected to continue moving upwards to reach the resistance at 7/8. However, this scenario may no longer be valid if the price breaks 5/8 to the downside. After that, the instrument may reverse and fall towards the support at 4/8.

https://roboforex.com/uploads/roboforecast/roboforex.com/99/2021/Murrey/october/19/1.png

Read more - Murrey Math Lines AUDUSD, NZDUSD

Re: Forex Technical Analysis & Forecast by RoboForex

Forex Technical Analysis & Forecast 20.10.2021

EURUSD, “Euro vs US Dollar”

After finishing another ascending wave at 1.1668 along with the descending impulse towards 1.1627, EURUSD is forming a new consolidation range around 1.1650. If later the price breaks this range to the downside, the market may resume trading downwards with the target at 1.1600.

https://roboforex.com/uploads/roboforecast/roboforex.com/99/2021/TA/october/20/EURUSDH1.png

Read more - Forex Technical Analysis & Forecast 20.10.2021

531 (edited by RF roboforex 2021-10-21 13:09:52)

Re: Forex Technical Analysis & Forecast by RoboForex

Fibonacci Retracements Analysis 21.10.2021 (Brent, Dow Jones)

Brent

As we can see in the H4 chart, after breaking the post-correctional extension area between 138.2% and 161.8% fibo at 82.19 and 85.14 respectively, Brent continues growing steadily to reach the fractal high at 87.09. At the same time, there is divergence on MACD, which may indicate a possible pullback to the downside. The key support here remains the local low at 65.03.

https://roboforex.com/uploads/roboforecast/roboforex.com/99/2021/Fibo/october/21/BRENTH4.png

Read more - Fibonacci Retracements Analysis Brent, Dow Jones

Re: Forex Technical Analysis & Forecast by RoboForex

Japanese Candlesticks Analysis 22.10.2021 (XAUUSD, NZDUSD, GBPUSD)

XAUUSD, “Gold vs US Dollar”

As we can see in the H4 chart, the asset continues trading upwards. After forming several reversal patterns, such as Engulfing, not far from the support level, XAUUSD is reversing and may form a new rising impulse. In this case, the upside target may be the resistance area at 1810.00. At the same time, an opposite scenario implies that the price may correct towards 1775.00 first and then resume trading upwards.

https://roboforex.com/uploads/roboforecast/roboforex.com/99/2021/Candles/october/22/XAUUSDH4.png

Read more - Japanese Candlesticks Analysis XAUUSD, NZDUSD, GBPUSD

Re: Forex Technical Analysis & Forecast by RoboForex

Ichimoku Cloud Analysis 25.10.2021 (GBPUSD, BRENT, AUDUSD)

GBPUSD, “Great Britain Pound vs US Dollar”

GBPUSD is trading at 1.3767; the instrument is moving above Ichimoku Cloud, thus indicating an ascending tendency. The markets could indicate that the price may test the cloud’s upside border at 1.3725 and then resume moving upwards to reach 1.3975. Another signal in favour of a further uptrend will be a rebound from the rising channel’s downside border. However, the bullish scenario may no longer be valid if the price breaks the cloud’s downside border and fixes below 1.3625. In this case, the pair may continue falling towards 1.3535.

https://roboforex.com/uploads/roboforecast/roboforex.com/99/2021/Ichimoku/october/25/gbpusd.png

Read more - Ichimoku Cloud Analysis GBPUSD, BRENT, AUDUSD

Re: Forex Technical Analysis & Forecast by RoboForex

Murrey Math Lines 26.10.2021 (AUDUSD, NZDUSD)

AUDUSD, “Australian Dollar vs US Dollar”

In the H4 chart, AUDUSD is trading above the 200-day Moving Average, thus indicating an ascending tendency. In this case, the price is expected to continue moving upwards to reach the resistance at 8/8. However, this scenario may no longer be valid if the price breaks 6/8 to the downside. After that, the instrument may reverse and fall towards the support at 5/8.

https://roboforex.com/uploads/roboforecast/roboforex.com/99/2021/Murrey/october/26/1.png

Read more - Murrey Math Lines AUDUSD, NZDUSD

Re: Forex Technical Analysis & Forecast by RoboForex

Forex Technical Analysis & Forecast 27.10.2021

EURUSD, “Euro vs US Dollar”

After rebounding from 1.1622 to the downside and then reaching 1.1584, EURUSD is expected to correct towards 1.1619 and may later resume falling to return to 1.1585. After that, the instrument may break this level and continue trading downwards with the short-term target at 1.1528.

https://roboforex.com/uploads/roboforecast/roboforex.com/99/2021/TA/october/27/EURUSDH1.png

Read more - Forex Technical Analysis & Forecast 27.10.2021

Re: Forex Technical Analysis & Forecast by RoboForex

Murrey Math Lines 28.10.2021 (USDCHF, GOLD)

USDCHF, “US Dollar vs Swiss Franc”

As we can see in the H4 chart, after rebounding from 0/8, USDCHF is trading not far from the resistance at 1/8. In this case, the price is expected to break the latter level and then continue growing to reach the resistance at 3/8. However, this scenario may be cancelled if the price breaks the support at 0/8 to the downside. After that, the instrument may continue falling towards -2/8.

https://roboforex.com/uploads/roboforecast/roboforex.com/99/2021/Murrey/october/28/1.png

Read more - Murrey Math Lines USDCHF, GOLD

Re: Forex Technical Analysis & Forecast by RoboForex

Japanese Candlesticks Analysis 29.10.2021 (EURUSD, USDJPY, EURGBP)

EURUSD, “Euro vs US Dollar”

As we can see in the H4 chart, the asset has formed several reversal patterns, including Hanging Man, close to the resistance level. At the moment, EURUSD may reverse and start a new descending wave. In this case, the downside target may be at 1.1625. Later, the market may rebound from the support area and resume the ascending tendency. However, an alternative scenario implies that the price may grow to reach 1.1715 without reversing and correcting.

https://roboforex.com/uploads/roboforecast/roboforex.com/99/2021/Candles/october/29/EURUSDH4.png

Read more - Japanese Candlesticks Analysis EURUSD, USDJPY, EURGBP

Re: Forex Technical Analysis & Forecast by RoboForex

Ichimoku Cloud Analysis 01.11.2021 (EURUSD, GBPUSD, USDCAD)[

EURUSD, “Euro vs US Dollar”

EURUSD is trading at 1.1560; the instrument is moving below Ichimoku Cloud, thus indicating a descending tendency. The markets could indicate that the price may test Tenkan-Sen and Kijun-Sen at 1.1585 and then resume moving downwards to reach 1.1465. Another signal in favour of a further downtrend will be a rebound from the rising channel’s downside border. However, the bearish scenario may no longer be valid if the price breaks the cloud’s upside border and fixes above 1.1665. In this case, the pair may continue growing towards 1.1755.

https://roboforex.com/uploads/roboforecast/roboforex.com/99/2021/Ichimoku/november/01/eurusd.png

Read more - Ichimoku Cloud Analysis EURUSD, GBPUSD, USDCAD

Re: Forex Technical Analysis & Forecast by RoboForex

Murrey Math Lines 02.11.2021 (AUDUSD, NZDUSD)

AUDUSD, “Australian Dollar vs US Dollar”

In the H4 chart, after breaking 7/8, AUDUSD is trading below it. In this case, the price is expected to correct downwards and the support at 5/8. However, this scenario may no longer be valid if the price breaks 7/8 to the upside. After that, the instrument may reverse and grow towards the resistance at 8/8.

https://roboforex.com/uploads/roboforecast/roboforex.com/99/2021/Murrey/november/02/1.png

Read more - Murrey Math Lines AUDUSD, NZDUSD

Re: Forex Technical Analysis & Forecast by RoboForex

Forex Technical Analysis & Forecast 03.11.2021

EURUSD, “Euro vs US Dollar”

After completing the correction at 1.1612 and rebounding from this level to the downside, EURUSD has finished the descending impulse along with another correction; right now, it is falling to break the low of this impulse. Possibly, the pair may fall to break 1.1546 and then continue trading downwards with the short-term target at 1.1484.

https://roboforex.com/uploads/roboforecast/roboforex.com/99/2021/TA/november/03/EURUSDH1.png

Read more - Forex Technical Analysis & Forecast 03.11.2021

Re: Forex Technical Analysis & Forecast by RoboForex

Ichimoku Cloud Analysis 04.11.2021 (NZDUSD, GBPJPY, AUDUSD)

NZDUSD, “New Zealand Dollar vs US Dollar”

NZDUSD is trading at 0.7141; the instrument is moving inside Ichimoku Cloud, thus indicating a sideways tendency. The markets could indicate that the price may test the cloud’s upside border at 0.7165 and then resume moving downwards to reach 0.7020. Another signal in favour of a further downtrend will be a rebound from the descending channel’s upside border. However, the bearish scenario may no longer be valid if the price breaks the cloud’s upside border and fixes above 0.7205. In this case, the pair may continue growing towards 0.7305.

https://roboforex.com/uploads/roboforecast/roboforex.com/99/2021/Ichimoku/november/04/nzdusd.png

Read more - Ichimoku Cloud Analysis NZDUSD, GBPJPY, AUDUSD

Re: Forex Technical Analysis & Forecast by RoboForex

Japanese Candlesticks Analysis 05.11.2021 (USDCAD, AUDUSD, USDCHF)

USDCAD, “US Dollar vs Canadian Dollar”

As we can see in the H4 chart, after forming several reversal patterns, including Harami, close to the resistance level, USDCAD may reverse in the form of a new pullback. In this case, the correctional target may be the support area at 1.2370. However, an alternative scenario implies that the asset may continue growing to reach 1.2520 without testing the support area.

https://roboforex.com/uploads/roboforecast/roboforex.com/99/2021/Candles/november/05/USDCADH4.png

Read more - Japanese Candlesticks Analysis USDCAD, AUDUSD, USDCHF

Re: Forex Technical Analysis & Forecast by RoboForex

Ichimoku Cloud Analysis 08.11.2021 (AUDUSD, GBPUSD, NZDUSD)

AUDUSD, “Australian Dollar vs US Dollar”

The currency pair is trading at 0.7410 under the Ichimoku Cloud, suggesting a downtrend. A test of the signal lines of the indicator at 0.7420 is expected, followed by falling to 0.7275. An additional signal confirming the decline might become a bounce off the upper border of the descending channel. The scenario can be canceled by a breakaway of the upper border of the Cloud and securing above 0.7515, which will mean further growth to 0.7605.

https://roboforex.com/uploads/roboforecast/roboforex.com/99/2021/Ichimoku/november/08/audusd.png

Read more - Ichimoku Cloud Analysis AUDUSD, GBPUSD, NZDUSD

Re: Forex Technical Analysis & Forecast by RoboForex

Murrey Math Lines 09.11.2021 (AUDUSD, NZDUSD)

AUDUSD, “Australian Dollar vs US Dollar”

On H4, the quotations have bounced off 5/8 and are trading below it. In such circumstances, we expect a test of 6/8, a breakaway, and growth to the resistance level of 7/8. This scenario can be canceled by a breakaway of 5/8 downwards. In this case, the quotations might fall to the support level of 4/8.

https://roboforex.com/uploads/roboforecast/roboforex.com/99/2021/Murrey/november/09/1.png

Read more - Murrey Math Lines AUDUSD, NZDUSD

Re: Forex Technical Analysis & Forecast by RoboForex

Forex Technical Analysis & Forecast 10.11.2021

EURUSD, “Euro vs US Dollar”

The pair is trading in a consolidation range above 1.1560. At a moment, the market extended the range upwards to 1.1606. Today, the market is trading in a structure of decline to 1.1560. With an escape upwards, a pathway to 1.1626 will open. With an escape downwards – a pathway for a decline to 1.1480.

https://roboforex.com/uploads/roboforecast/roboforex.com/99/2021/TA/november/10/EURUSDH1.png

Read more - Forex Technical Analysis & Forecast 10.11.2021

546 (edited by RF roboforex 2021-11-11 11:08:09)

Re: Forex Technical Analysis & Forecast by RoboForex

Fibonacci Retracement Analysis 11.11.2021 (Brent, Dow Jones)

Brent

On H4, after the quotations rose to the post-correctional extension area of 138.2-161.8% (82.20-85.15) Fibo, a divergence formed. This divergence signals about a pullback, and the first wave of the correctional decline already reached 23.6%. Subsequent growth tried to bring the quotations to 86.63, but the market was not powerful enough to accomplish it. The new impulse of decline can head for 38.2% (78.38), 50.0% (75.84), and 61.8% (73.30).

https://roboforex.com/uploads/roboforecast/roboforex.com/99/2021/Fibo/november/11/BRENTH4.png

Read more - Fibonacci Retracements Analysis Brent, Dow Jones

Re: Forex Technical Analysis & Forecast by RoboForex

Japanese Candlestick Analysis 12.11.2021 (GOLD, NZDUSD, GBPUSD)

XAUUSD, “Gold vs US Dollar”

Gold is forming a correctional wave. At the resistance level, gold has formed several reversal patterns, including a Hanging Man. Going by the signal now, the price might start correcting. The aim of the pullback is the support level of 1845.00. However, the quotations can still grow to 1885.00 and go on growing without a test of the support level.

https://roboforex.com/uploads/roboforecast/roboforex.com/99/2021/Candles/november/12/XAUUSDH4.png

Read more - Japanese Candlesticks Analysis GOLD, NZDUSD, GBPUSD

Re: Forex Technical Analysis & Forecast by RoboForex

Ichimoku Cloud Analysis 15.11.2021 (EURUSD, USDCAD, USDCHF)

EURUSD, “Euro vs US Dollar”

EURUSD is trading at 1.1454; the instrument is moving below Ichimoku Cloud, thus indicating a descending tendency. The markets could indicate that the price may test Tenkan-Sen and Kijun-Sen at 1.1495 and then resume moving downwards to reach 1.1335. Another signal in favour of a further downtrend will be a rebound from the descending channel’s upside border. However, the bearish scenario may no longer be valid if the price breaks the cloud’s upside border and fixes above 1.1585. In this case, the pair may continue growing towards 1.1675.

https://roboforex.com/uploads/roboforecast/roboforex.com/99/2021/Ichimoku/november/15/eurusd.png

Read more - Ichimoku Cloud Analysis EURUSD, USDCAD, USDCHF

Re: Forex Technical Analysis & Forecast by RoboForex

Murrey Math Lines 16.11.2021 (AUDUSD, NZDUSD)

AUDUSD, “Australian Dollar vs US Dollar”

As we can see in the H4 chart, AUDUSD is trading below the 200-day Moving Average, thus indicating a descending tendency. In this case, the price is expected to test 4/8, break it, and then continue falling to reach the support at 3/8. However, this scenario may no longer be valid if the price breaks 5/8 to the upside. After that, the instrument may reverse and grow towards the resistance at 6/8.

https://roboforex.com/uploads/roboforecast/roboforex.com/99/2021/Murrey/november/16/1.png

Read more - Murrey Math Lines AUDUSD, NZDUSD

Re: Forex Technical Analysis & Forecast by RoboForex

Forex Technical Analysis & Forecast 17.11.2021

EURUSD, “Euro vs US Dollar”

After completing the descending wave at 1.1263, EURUSD is correcting to test 1.1300 from below. Later, the market may resume falling to break 1.1250 and then continue trading within the downtrend with the target at 1.1174.

https://roboforex.com/uploads/roboforecast/roboforex.com/99/2021/TA/november/17/EURUSDH1.png

Read more - Forex Technical Analysis & Forecast 17.11.2021

Posts: 526 to 550 of 1,098

Pages Previous 1 20 21 22 23 24 44 Next

You must login or register to post a reply

Forex Software → Market Analysis → Forex Technical Analysis & Forecast by RoboForex

Similar topics in this forum