forex software

Create and Test Forex Strategies

forex software

Skip to forum content

Forex Software

Create and Test Forex Strategies

You are not logged in. Please login or register.


(Page 21 of 44)

Forex Software → Market Analysis → Forex Technical Analysis & Forecast by RoboForex

Pages Previous 1 19 20 21 22 23 44 Next

You must login or register to post a reply

RSS topic feed

Posts: 501 to 525 of 1,098

Re: Forex Technical Analysis & Forecast by RoboForex

Fibonacci Retracements Analysis 09.09.2021 (Brent, Dow Jones)
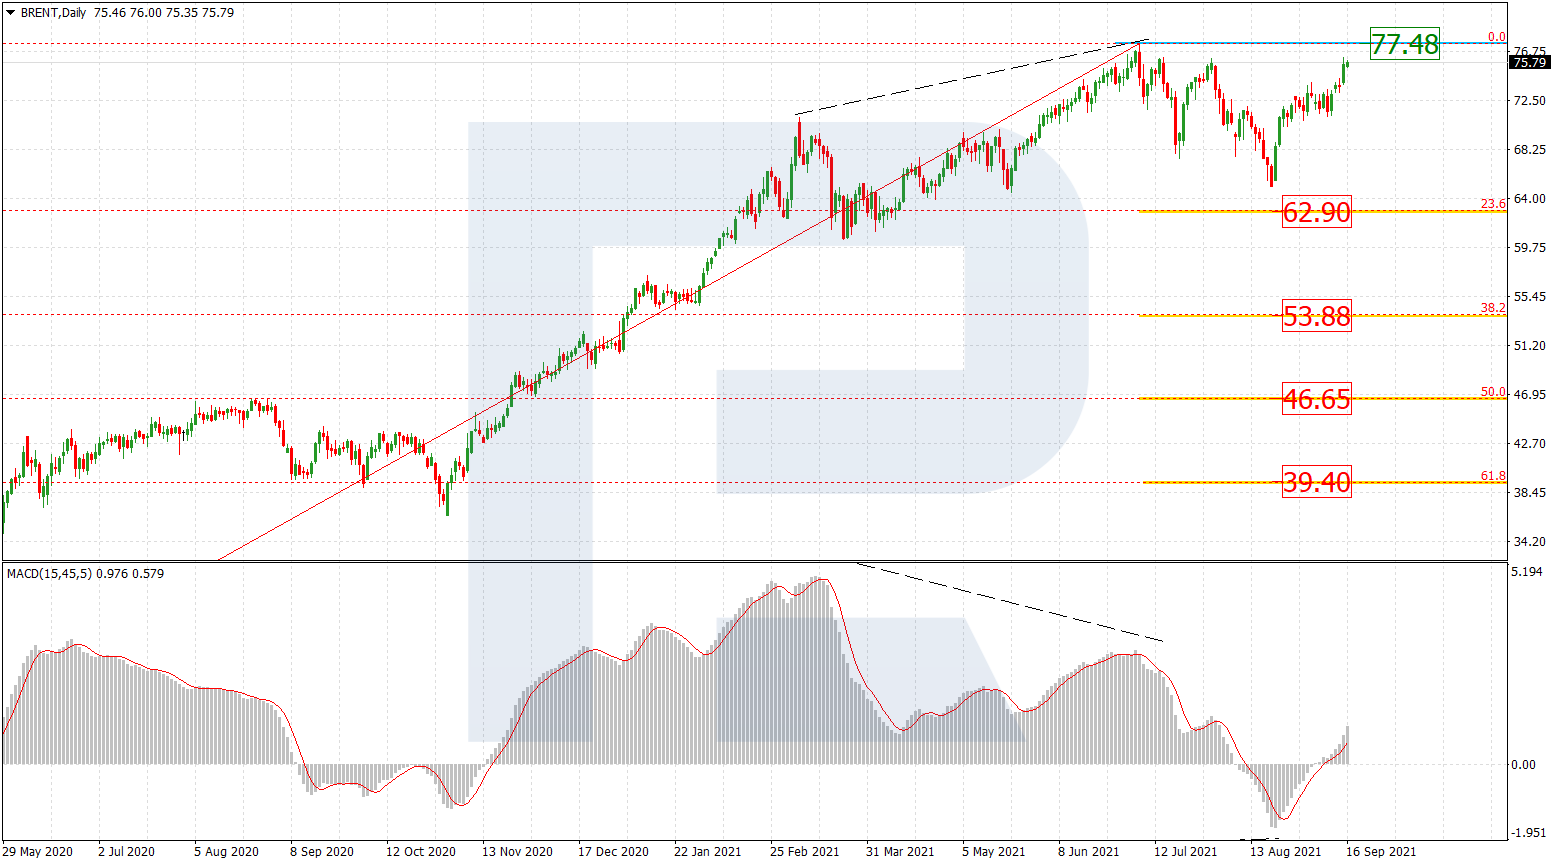
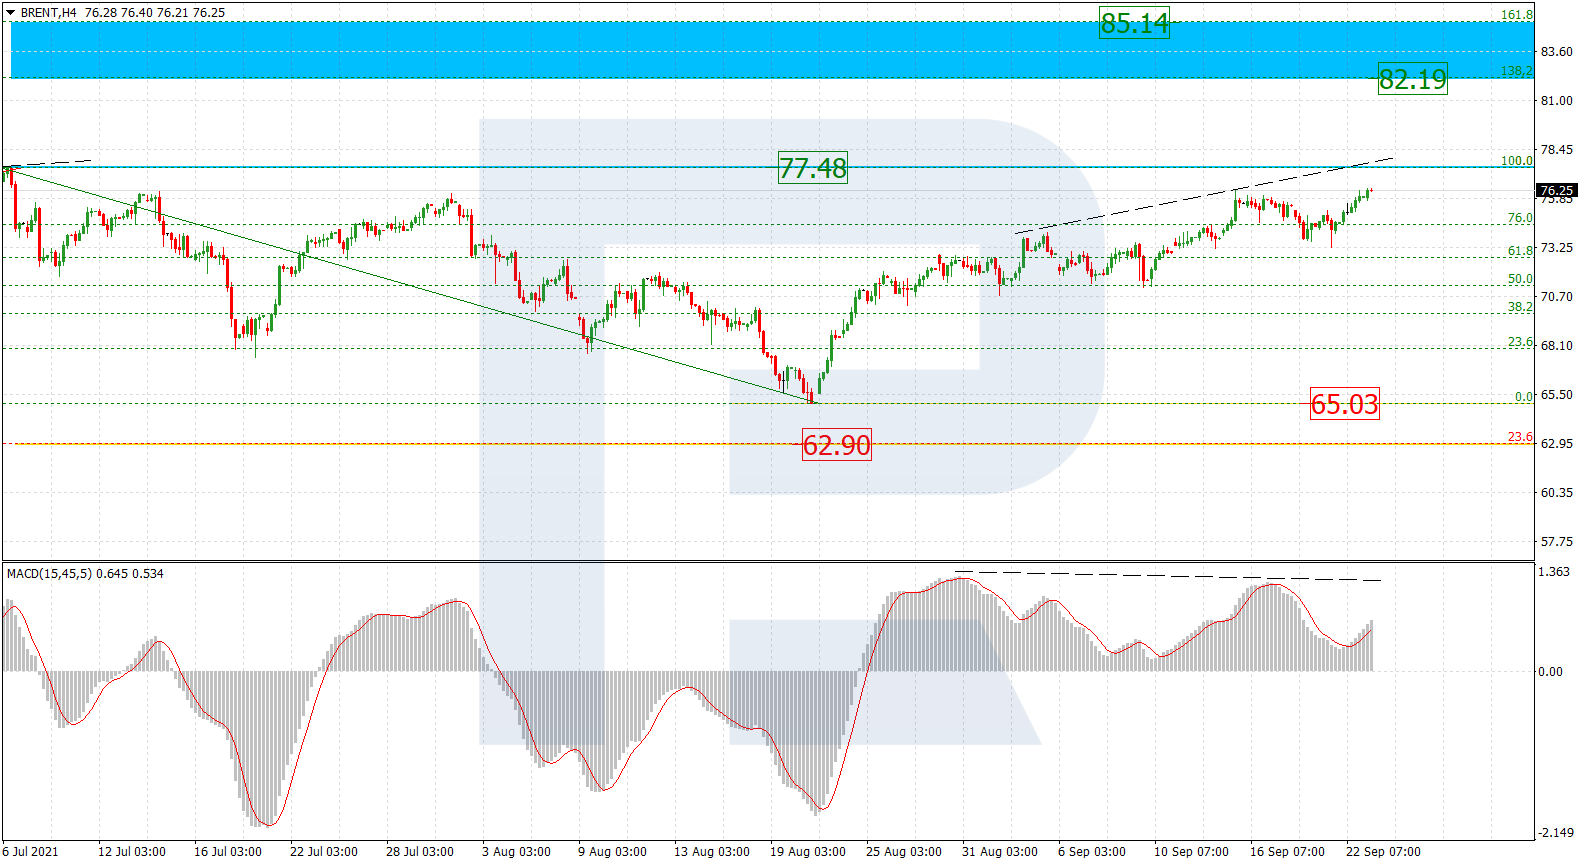
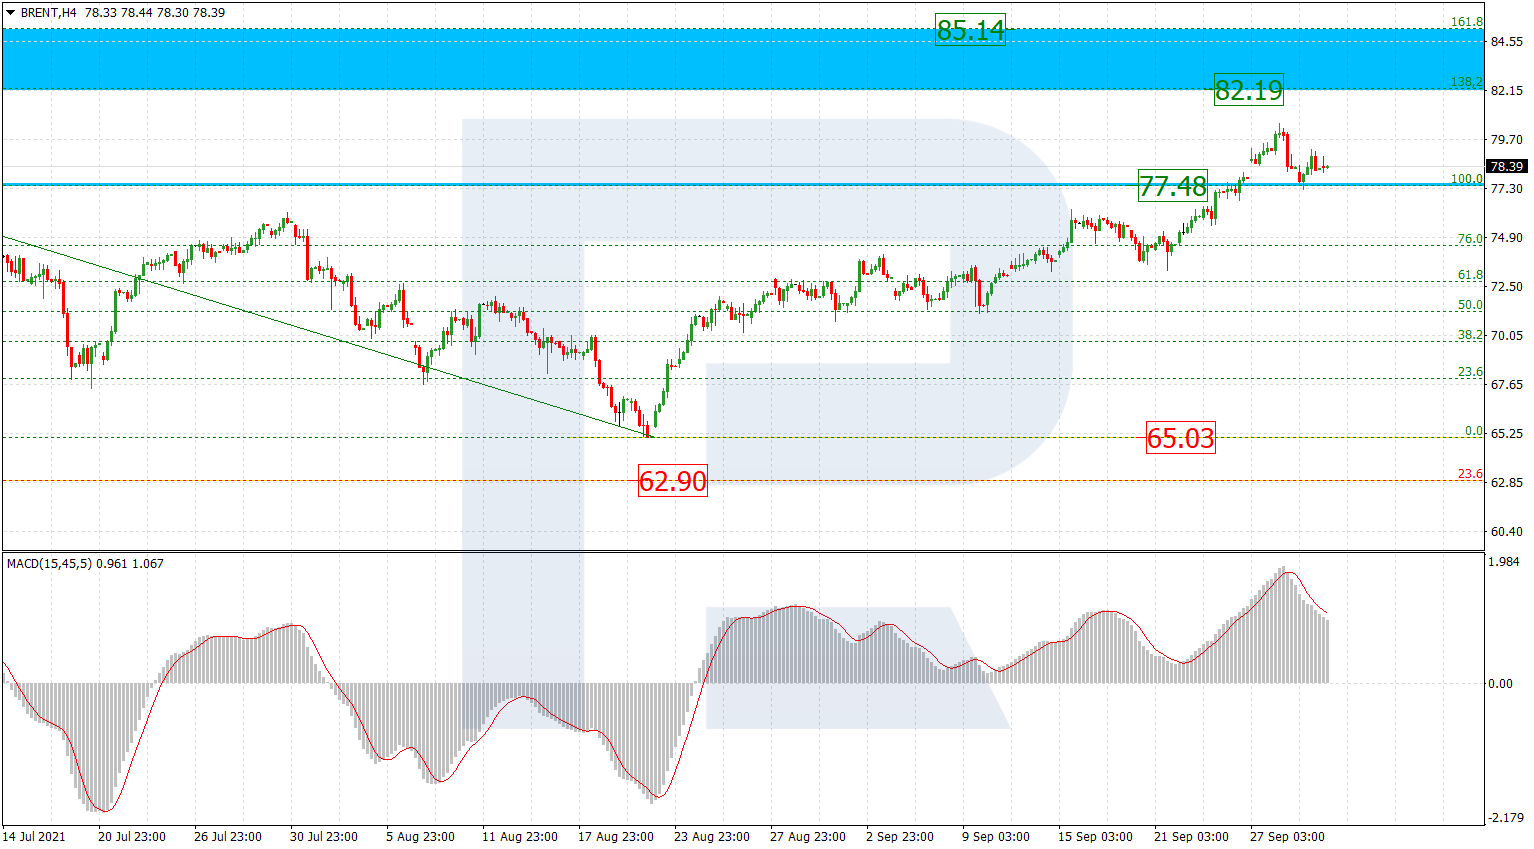
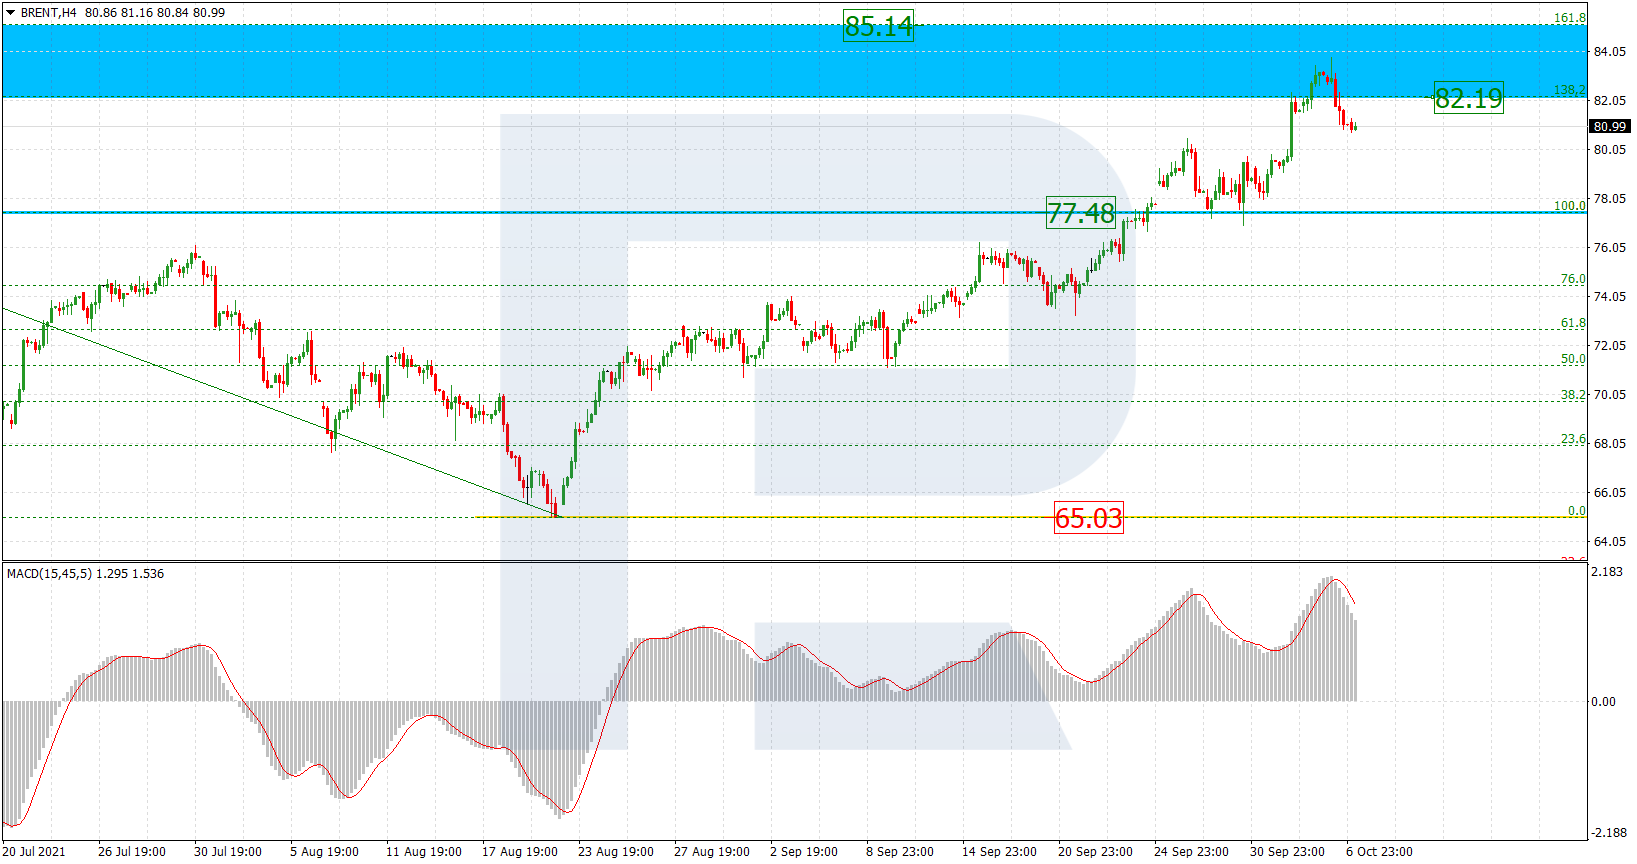
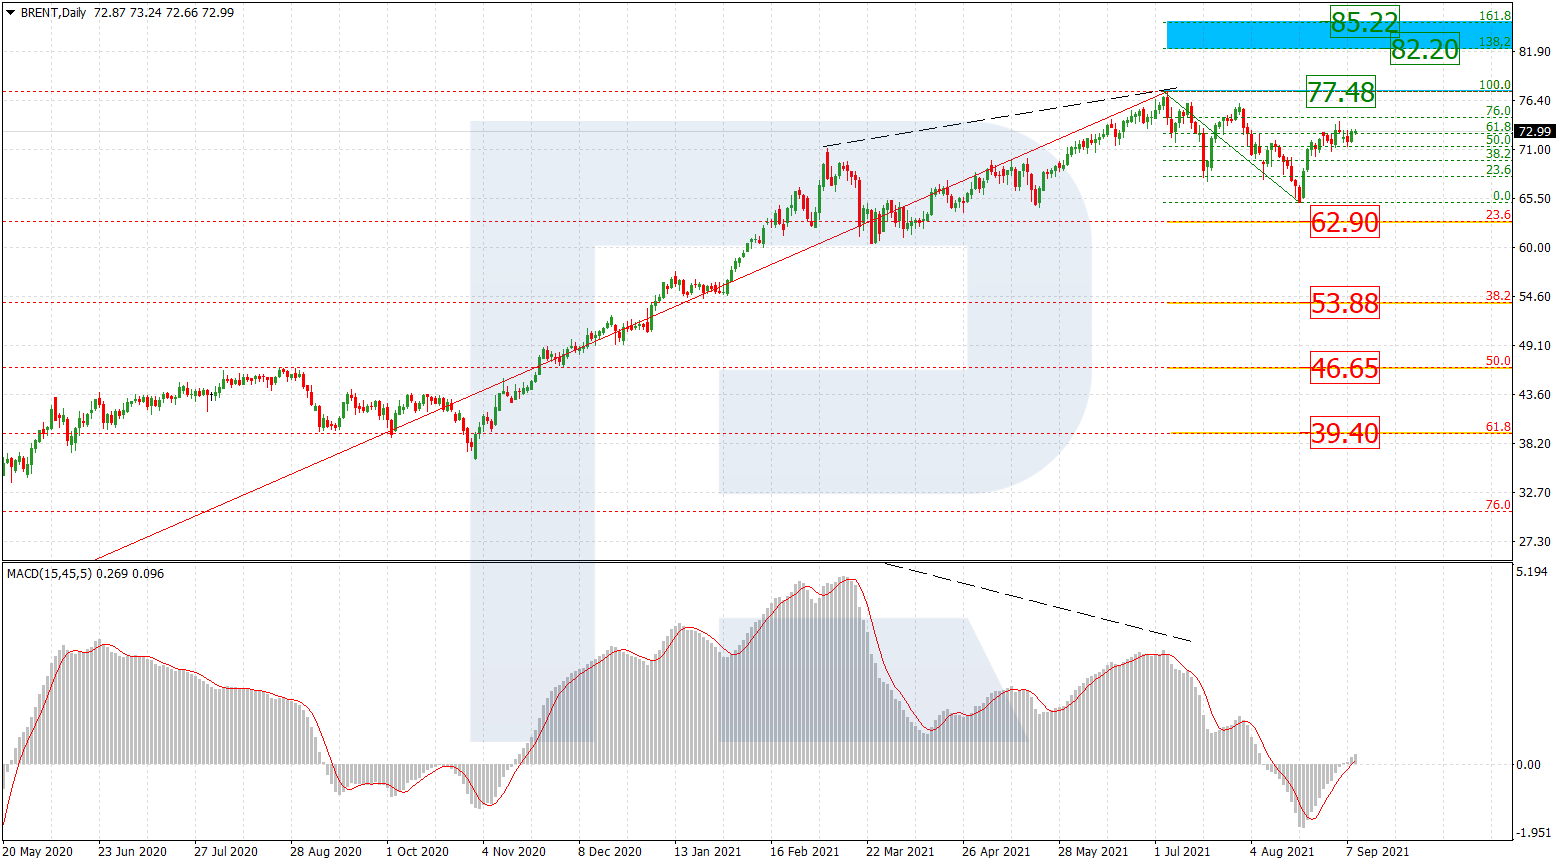
Brent

The daily chart is still showing the rising wave towards the high at 77.48. The wave is quite stable but something prevents the asset from growing more actively. If Brent finally breaks the high, it may continue growing towards the post-correctional extension area between 138.2% and 161.8% fibo at 82.20 and 85.22 respectively. However, as long as the price is moving below the high, it may yet start another decline to reach 23.6%, 38.2%, 50.0%, and 61.8% fibo at 62.90, 53.88, 46.65, and 39.40 respectively.

https://roboforex.com/uploads/roboforecast/roboforex.com/99/2021/Fibo/september/09/BRENTDaily.png

Read more - Fibonacci Retracements Analysis Brent, Dow Jones

Re: Forex Technical Analysis & Forecast by RoboForex

Japanese Candlesticks Analysis 10.09.2021 (EURUSD, USDJPY, EURGBP)

EURUSD, “Euro vs US Dollar”

As we can see in the H4 chart, the asset has formed several reversal patterns, including Hammer, not far from the support level. At the moment, EURUSD may reverse and start a new growth. In this case, the upside target may be at 1.1915. Later, the market may break the resistance area and continue trading upwards. However, an alternative scenario implies that the price may correct to reach 1.1785 first and then resume growing.

https://roboforex.com/uploads/roboforecast/roboforex.com/99/2021/Candles/september/10/EURUSDH4.png

Read more - Japanese Candlesticks Analysis EURUSD, USDJPY, EURGBP

Re: Forex Technical Analysis & Forecast by RoboForex

Ichimoku Cloud Analysis 13.09.2021 (EURUSD, NZDUSD, CADJPY)

EURUSD, “Euro vs US Dollar”

EURUSD is trading at 1.1787; the instrument is moving below Ichimoku Cloud, thus indicating a descending tendency. The markets could indicate that the price may test the cloud’s downside border at 1.1815 and then resume moving downwards to reach 1.1670. Another signal in favor of a further downtrend will be a rebound from the resistance level. However, the bearish scenario may be cancelled if the price breaks the cloud’s upside border and fixes above 1.1875. In this case, the pair may continue growing towards 1.1965. To confirm further decline, the asset must break the rising channel’s downside border and fix below 1.1750.

https://roboforex.com/uploads/roboforecast/roboforex.com/99/2021/Ichimoku/september/13/eurusd.png

Read more - Ichimoku Cloud Analysis EURUSD, NZDUSD, CADJPY

Re: Forex Technical Analysis & Forecast by RoboForex

Murrey Math Lines 14.09.2021 (AUDUSD, NZDUSD)

AUDUSD, “Australian Dollar vs US Dollar”

In the H4 chart, after breaking 5/8, AUDUSD is back to consolidating. In this case, the price is expected to test 4/8, break it, and then continue moving downwards to reach the support at 3/8. However, this scenario may no longer be valid if the price breaks 5/8 to the upside. After that, the instrument may reverse and grow towards the resistance at 6/8.

https://roboforex.com/uploads/roboforecast/roboforex.com/99/2021/Murrey/september/14/1.png

Read more - Murrey Math Lines AUDUSD, NZDUSD

Re: Forex Technical Analysis & Forecast by RoboForex

Forex Technical Analysis & Forecast 15.09.2021

EURUSD, “Euro vs US Dollar”

After completing the ascending waveу at 1.1844 and rebounding from this level, EURUSD is falling towards 1.1780 and may later start a new growth to reach 1.1812. In fact, the pair is expected to consolidate around the latter level.

https://roboforex.com/uploads/roboforecast/roboforex.com/99/2021/TA/september/15/EURUSDH1.png

Read more - Forex Technical Analysis & Forecast 15.09.2021

Re: Forex Technical Analysis & Forecast by RoboForex

Fibonacci Retracements Analysis 16.09.2021 (Brent, Dow Jones)

Brent

In the daily chart, after falling and testing the first correctional target after divergence at 23.6% fibo (62.90), the asset is moving upwards and heading to break the high at 77.48. However, al long as the price is moving below this level, the market may yet start a new decline to reach 23.6%, 38.2%, 50.0%, and 61.8% fibo at 62.90, 53.88, 46.65, and 39.40 respectively.

https://roboforex.com/uploads/roboforecast/roboforex.com/99/2021/Fibo/september/16/BRENTDaily.png

Read more - Fibonacci Retracements Analysis Brent, Dow Jones

Re: Forex Technical Analysis & Forecast by RoboForex

Japanese Candlesticks Analysis 17.09.2021 (USDCAD, AUDUSD, USDCHF)

USDCAD, “US Dollar vs Canadian Dollar”

As we can see in the H4 chart, the asset continues trading sideways. After forming several reversal patterns, including Harami, close to the resistance level, USDCAD is reversing in the form of a new descending impulse. In this case, the downside target may be the support area at 1.2570. However, an alternative scenario implies that the asset may grow to reach 1.2765 without reversing and correcting.

https://roboforex.com/uploads/roboforecast/roboforex.com/99/2021/Candles/september/17/USDCADH4.png

Read more - Japanese Candlesticks Analysis USDCAD, AUDUSD, USDCHF

Re: Forex Technical Analysis & Forecast by RoboForex

Ichimoku Cloud Analysis 20.09.2021 (NZDUSD, USDCHF, AUDUSD)

NZDUSD, “New Zealand Dollar vs US Dollar”

NZDUSD is trading at 0.7017; the instrument is moving below Ichimoku Cloud, thus indicating a descending tendency. The markets could indicate that the price may test Tenkan-Sen and Kijun-Sen at 0.7040 and then resume moving downwards to reach 0.6905. Another signal in favor of a further downtrend will be a rebound from the descending channel’s downside border. However, the bearish scenario may no longer be valid if the price breaks the cloud’s upside border and fixes above 0.7145. In this case, the pair may continue growing towards 0.7235.

https://roboforex.com/uploads/roboforecast/roboforex.com/99/2021/Ichimoku/september/20/nzdusd.png

Read more - Ichimoku Cloud Analysis NZDUSD, USDCHF, AUDUSD

Re: Forex Technical Analysis & Forecast by RoboForex

Murrey Math Lines 21.09.2021 (AUDUSD, NZDUSD)

AUDUSD, “Australian Dollar vs US Dollar”

In the H4 chart, AUDUSD is trading below the 200-day Moving Average, thus indicating a descending tendency. In this case, the price is expected to break 3/8 and then continue moving downwards to reach the support at 2/8. However, this scenario may no longer be valid if the price breaks 4/8 to the upside. After that, the instrument may reverse and grow towards the resistance at 5/8.

https://roboforex.com/uploads/roboforecast/roboforex.com/99/2021/Murrey/september/21/1.png

Read more - Murrey Math Lines AUDUSD, NZDUSD

Re: Forex Technical Analysis & Forecast by RoboForex

Forex Technical Analysis & Forecast 22.09.2021

EURUSD, “Euro vs US Dollar”

After finishing the ascending wave at 1.1747 along with the correction towards 1.1717, EURUSD is consolidating above the latter level. If later the price breaks this range to the downside at 1.1710, the market may start a new decline towards 1.1680; if to the upside at 1.1740 – continue the correction with the target at 1.1777.

https://roboforex.com/uploads/roboforecast/roboforex.com/99/2021/TA/september/22/EURUSDH1.png

Read more - Forex Technical Analysis & Forecast 22.09.2021

Re: Forex Technical Analysis & Forecast by RoboForex

Fibonacci Retracements Analysis 23.09.2021 (Brent, Dow Jones)

Brent

As we can see in the H4 chart, the current rising wave has broken 76.0% fibo and is approaching the high at 77.48, a breakout of which may lead to a further uptrend towards the post-correctional extension area between 138.2% and 161.8% fibo at 82.21 and 85.14 respectively. the key support here is the local low at 65.03. At the same time, there might be divergence on MACD to indicate a possible pullback after the price test the high.

https://roboforex.com/uploads/roboforecast/roboforex.com/99/2021/Fibo/september/23/BRENTH4.png

Read more - Fibonacci Retracements Analysis Brent, Dow Jones

Re: Forex Technical Analysis & Forecast by RoboForex

Murrey Math Lines 24.09.2021 (Brent, S&P 500)

BRENT

In the H4 chart, Brent is trading inside the “overbought area”. In this case, the price is expected to test +2/8, rebound from it, and resume falling towards the support at 8/8. However, this scenario may no longer be valid if the asset breaks +2/8 to the upside. After that, the lines in the chart will be redrawn, thus helping us to define new upside targets.

https://roboforex.com/uploads/roboforecast/roboforex.com/99/2021/Murrey/september/24/1.png

Read more - Murrey Math Lines Brent, S&P 500

Re: Forex Technical Analysis & Forecast by RoboForex

Ichimoku Cloud Analysis 27.09.2021 (EURUSD, AUDUSD, NZDUSD)

EURUSD, “Euro vs US Dollar”

EURUSD is trading at 1.1718; the instrument is moving below Ichimoku Cloud, thus indicating a descending tendency. The markets could indicate that the price may test the cloud’s downside border at 1.1730 and then resume moving downwards to reach 1.1595. Another signal in favor of a further downtrend will be a rebound from the descending channel’s upside border. However, the bearish scenario may no longer be valid if the price breaks the cloud’s upside border and fixes above 1.1805. In this case, the pair may continue growing towards 1.1905. To confirm further decline, the asset must break the downside border of the Triangle pattern and fix below 1.1680.

https://roboforex.com/uploads/roboforecast/roboforex.com/99/2021/Ichimoku/september/27/eurusd.png

Read more - Ichimoku Cloud Analysis EURUSD, AUDUSD, NZDUSD

Re: Forex Technical Analysis & Forecast by RoboForex

Murrey Math Lines 28.09.2021 (AUDUSD, NZDUSD)

AUDUSD, “Australian Dollar vs US Dollar”

In the H4 chart, AUDUSD is consolidating between 3/8 and 5/8. In this case, the price is expected to break test 4/8, break it, and then continue moving upwards to reach the resistance at 5/8. However, this scenario may no longer be valid if the price breaks 3/8 to the downside. After that, the instrument may reverse and fall towards the support at 2/8.

https://roboforex.com/uploads/roboforecast/roboforex.com/99/2021/Murrey/september/28/1.png

Read more - Murrey Math Lines AUDUSD, NZDUSD

Re: Forex Technical Analysis & Forecast by RoboForex

Forex Technical Analysis & Forecast 29.09.2021

EURUSD, “Euro vs US Dollar”

After completing another descending structure at 1.1674, EURUSD is forming a new consolidation range around 1.1680. Possibly, today the pair may break the range to the downside and start a new decline with the short-term target at 1.1660. Later, the market may break this level and continue falling towards 1.1600.

https://roboforex.com/uploads/roboforecast/roboforex.com/99/2021/TA/september/29/EURUSDH1.png

Read more - Forex Technical Analysis & Forecast 29.09.2021

Re: Forex Technical Analysis & Forecast by RoboForex

Fibonacci Retracements Analysis 30.09.2021 (Brent, Dow Jones)

Brent

As we can see in the H4 chart, Brent is correcting towards 77.48, which was broken earlier. Later, the price may complete the pullback and resume growing to reach the post-correctional extension area between 138.2% and 161.8% fibo at 82.19 and 85.14 respectively. The key support here is the local low at 65.03.

https://roboforex.com/uploads/roboforecast/roboforex.com/99/2021/Fibo/september/30/BRENTH4.png

Read more - Fibonacci Retracements Analysis Brent, Dow Jones

Re: Forex Technical Analysis & Forecast by RoboForex

Japanese Candlesticks Analysis 01.10.2021 (XAUUSD, NZDUSD, GBPUSD)

XAUUSD, “Gold vs US Dollar”

As we can see in the H4 chart, the correctional wave continues. After forming several reversal patterns, such as Harami, not far from the resistance level, XAUUSD may reverse and resume falling. In this case, the downside target may be the support area at 1725.50. At the same time, an opposite scenario implies that the price may grow towards 1770.00 first and then resume trading downwards.

https://roboforex.com/uploads/roboforecast/roboforex.com/99/2021/Candles/october/01/XAUUSDH4.png

Read more - Japanese Candlesticks Analysis XAUUSD, NZDUSD, GBPUSD

Re: Forex Technical Analysis & Forecast by RoboForex

Ichimoku Cloud Analysis 04.10.2021 (GBPUSD, AUDUSD, USDCAD)

GBPUSD, “Great Britain Pound vs US Dollar”

GBPUSD is trading at 1.3547; the instrument is moving below Ichimoku Cloud, thus indicating a descending tendency. The markets could indicate that the price may test Tenkan-Sen and Kijun-Sen at 1.3575 and then resume moving downwards to reach 1.3275. Another signal in favor of a further downtrend will be a rebound from the descending channel’s upside border. However, the bearish scenario may no longer be valid if the price breaks the cloud’s upside border and fixes above 1.3725. In this case, the pair may continue growing towards 1.3815.

https://roboforex.com/uploads/roboforecast/roboforex.com/99/2021/Ichimoku/october/04/gbpusd.png

Read more - Ichimoku Cloud Analysis GBPUSD, AUDUSD, USDCAD

Re: Forex Technical Analysis & Forecast by RoboForex

Murrey Math Lines 05.10.2021 (AUDUSD, NZDUSD)

AUDUSD, “Australian Dollar vs US Dollar”

As we can see in the H4 chart, after rebounding from the 200-day Moving Average, AUDUSD is trading below it, thus indicating a descending tendency. In this case, the price is expected to break test 3/8 and then continue moving downwards to reach the support at 2/8. However, this scenario may no longer be valid if the price breaks 4/8 to the upside. After that, the instrument may reverse and grow towards the resistance at 5/8.

https://roboforex.com/uploads/roboforecast/roboforex.com/99/2021/Murrey/october/05/1.png

Read more - Murrey Math Lines AUDUSD, NZDUSD

Re: Forex Technical Analysis & Forecast by RoboForex

Forex Technical Analysis & Forecast 06.10.2021

EURUSD, “Euro vs US Dollar”

After completing the ascending impulse at 1.1612 along with the descending structure towards 1.1596, and then forming a narrow consolidation range around the latter level, EURUSD has broken it to the downside and may later continue falling to reach 1.1578. In fact, the asset is consolidating around 1.1596. If later the price breaks this range to the upside, the market may start another growth to reach 1.1660; if to the downside – form a new descending structure with the target at 1.1555.

https://roboforex.com/uploads/roboforecast/roboforex.com/99/2021/TA/october/06/EURUSDH1.png

Read more - Forex Technical Analysis & Forecast 06.10.2021

Re: Forex Technical Analysis & Forecast by RoboForex

Fibonacci Retracements Analysis 07.10.2021 (Brent, Dow Jones)

Brent

As we can see in the H4 chart, after breaking the high at 77.48 and entering the post-correctional extension area between 138.2% and 161.8% fibo at 82.19 and 85.14 respectively, Brent is correcting downwards but this pullback won’t be long judging by the MACD indicator. The closest downside target is at 77.48. The key support here is the local low at 65.03.

https://roboforex.com/uploads/roboforecast/roboforex.com/99/2021/Fibo/october/07/BRENTH4.png

Read more - Fibonacci Retracements Analysis Brent, Dow Jones

Re: Forex Technical Analysis & Forecast by RoboForex

Japanese Candlesticks Analysis 08.10.2021 (EURUSD, USDJPY, EURGBP)

EURUSD, “Euro vs US Dollar”

As we can see in the H4 chart, the asset has formed several reversal patterns, including Hammer and Doji, not far from the support level. At the moment, EURUSD may reverse and start a new pullback. In this case, the correctional target may be at 1.1595. Later, the market may rebound from the resistance area and resume trading downwards. However, an alternative scenario implies that the price may fall to reach 1.1505 without any corrections.

https://roboforex.com/uploads/roboforecast/roboforex.com/99/2021/Candles/october/08/EURUSDH4.png

Read more - Japanese Candlesticks Analysis EURUSD, USDJPY, EURGBP

Re: Forex Technical Analysis & Forecast by RoboForex

Ichimoku Cloud Analysis 11.10.2021 (AUDUSD, NZDUSD, USDCHF)

AUDUSD, “Australian Dollar vs US Dollar”

AUDUSD is trading at 0.7331; the instrument is moving above Ichimoku Cloud, thus indicating an ascending tendency. The markets could indicate that the price may test Tenkan-Sen and Kijun-Sen at 0.7295 and then resume moving upwards to reach 0.7465. Another signal in favor of a further uptrend will be a rebound from the “neckline” of the Head & Shoulders reversal pattern. However, the bullish scenario may no longer be valid if the price breaks the cloud’s downside border and fixes below 0.7205. In this case, the pair may continue falling towards 0.7110.

https://roboforex.com/uploads/roboforecast/roboforex.com/99/2021/Ichimoku/october/11/audusd.png

Read more - Ichimoku Cloud Analysis AUDUSD, NZDUSD, USDCHF

Re: Forex Technical Analysis & Forecast by RoboForex

Murrey Math Lines 12.10.2021 (AUDUSD, NZDUSD)

AUDUSD, “Australian Dollar vs US Dollar”

In the H4 chart, after breaking the 200-day Moving Average, AUDUSD is trading above it, thus indicating an ascending tendency. In this case, the price is expected to test 5/8, break it, and then continue moving upwards to reach the resistance at 6/8. However, this scenario may no longer be valid if the price breaks 4/8 to the downside. After that, the instrument may reverse and fall towards the support at 3/8.

https://roboforex.com/uploads/roboforecast/roboforex.com/99/2021/Murrey/october/12/1.png

Read more - Murrey Math Lines AUDUSD, NZDUSD

Re: Forex Technical Analysis & Forecast by RoboForex

Forex Technical Analysis & Forecast 13.10.2021

EURUSD, “Euro vs US Dollar”

After completing the descending structure at 1.1524 along with the correction to test 1.1550 from below, EURUSD is expected to forming a new consolidation range around the latter level. Later, the market may break this range to the downside and resume falling towards 1/.1515 or even reach the target at 1.1500.

https://roboforex.com/uploads/roboforecast/roboforex.com/99/2021/TA/october/13/EURUSDH1.png

Read more - Forex Technical Analysis & Forecast 13.10.2021

Posts: 501 to 525 of 1,098

Pages Previous 1 19 20 21 22 23 44 Next

You must login or register to post a reply

Forex Software → Market Analysis → Forex Technical Analysis & Forecast by RoboForex

Similar topics in this forum