forex software

Create and Test Forex Strategies

forex software

Skip to forum content

Forex Software

Create and Test Forex Strategies

You are not logged in. Please login or register.


(Page 20 of 44)

Forex Software → Market Analysis → Forex Technical Analysis & Forecast by RoboForex

Pages Previous 1 18 19 20 21 22 44 Next

You must login or register to post a reply

RSS topic feed

Posts: 476 to 500 of 1,098

Re: Forex Technical Analysis & Forecast by RoboForex

Fibonacci Retracement Analysis 05.08.2021 (Brent, Dow Jones)
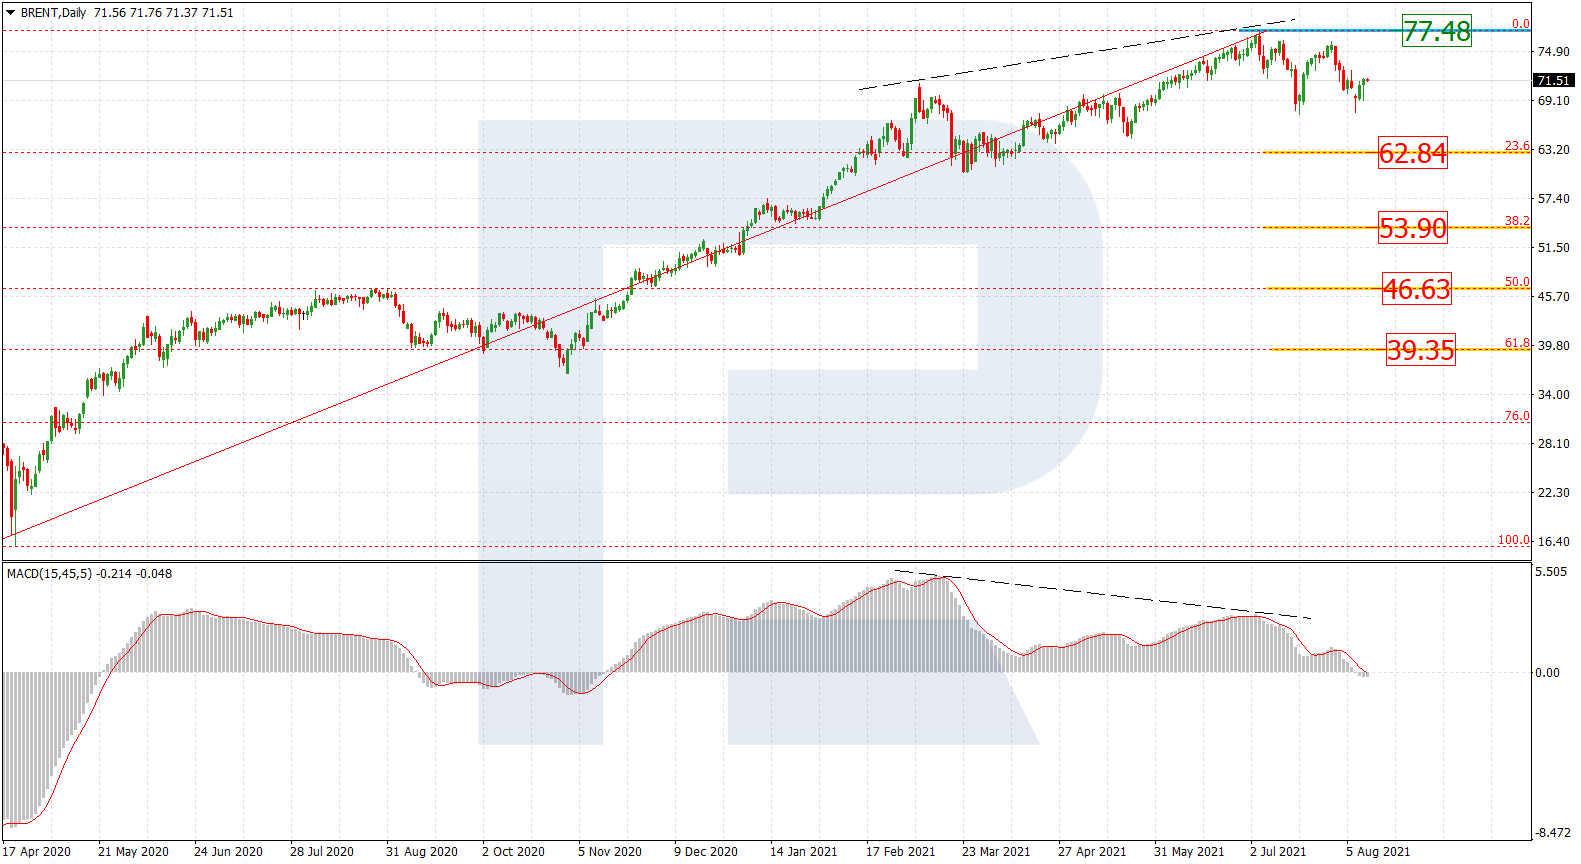
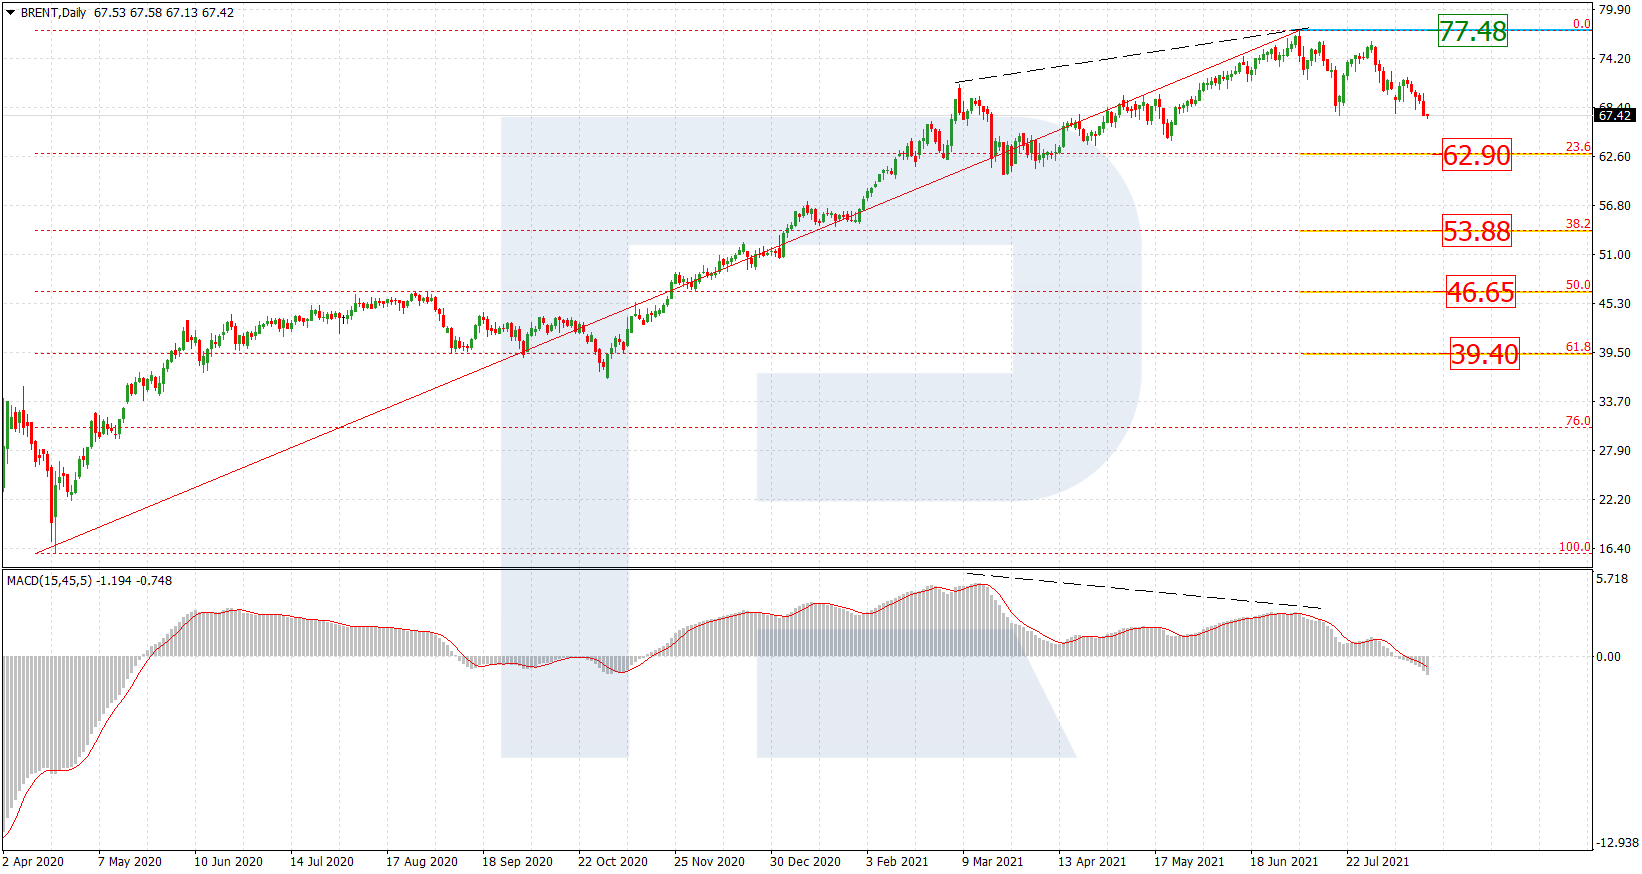
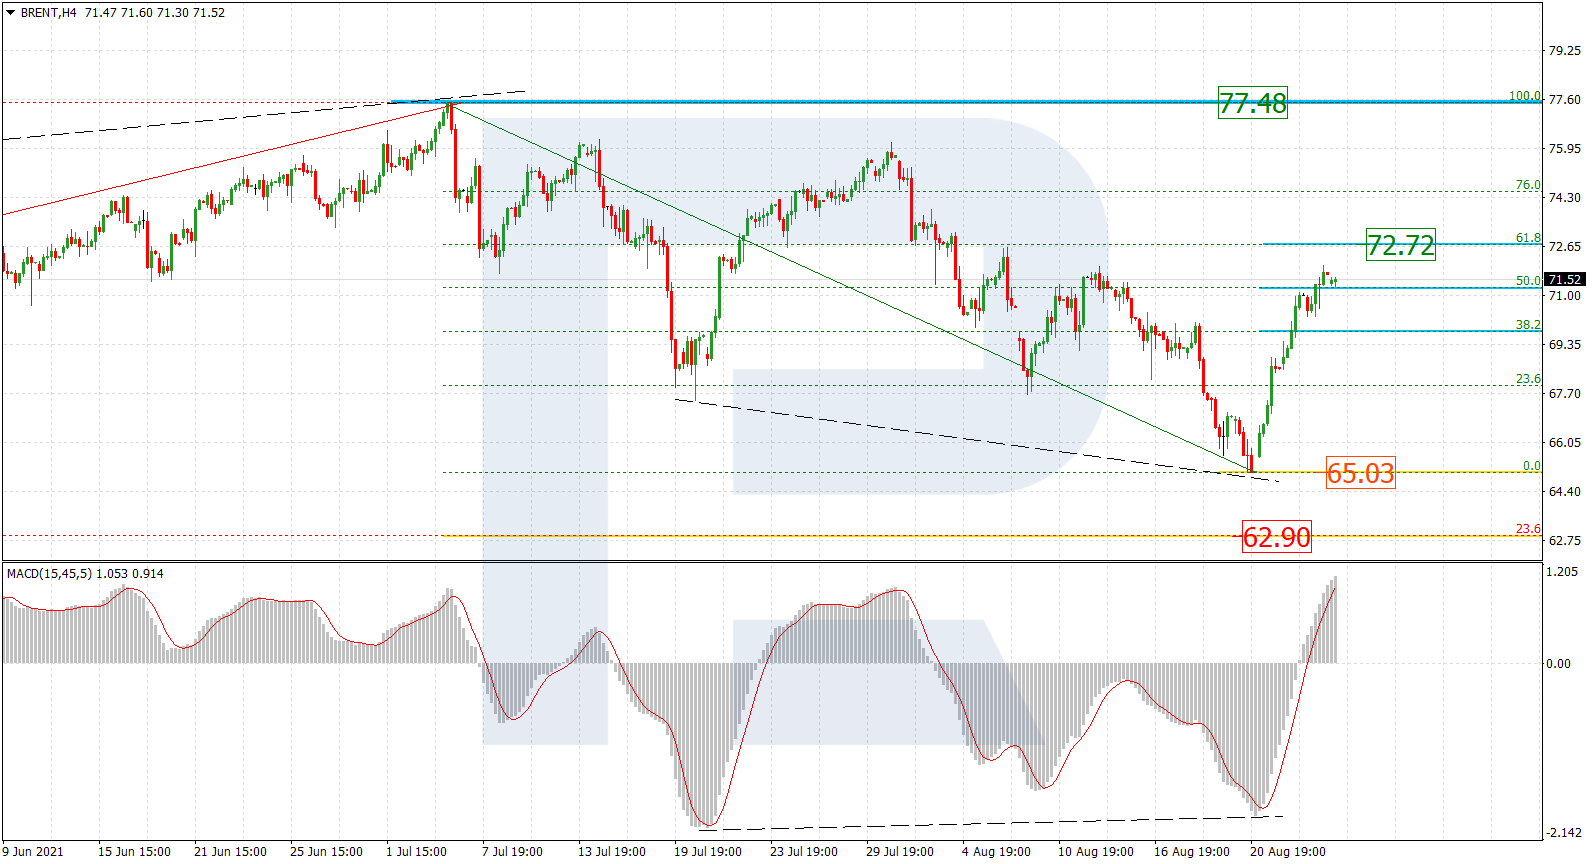
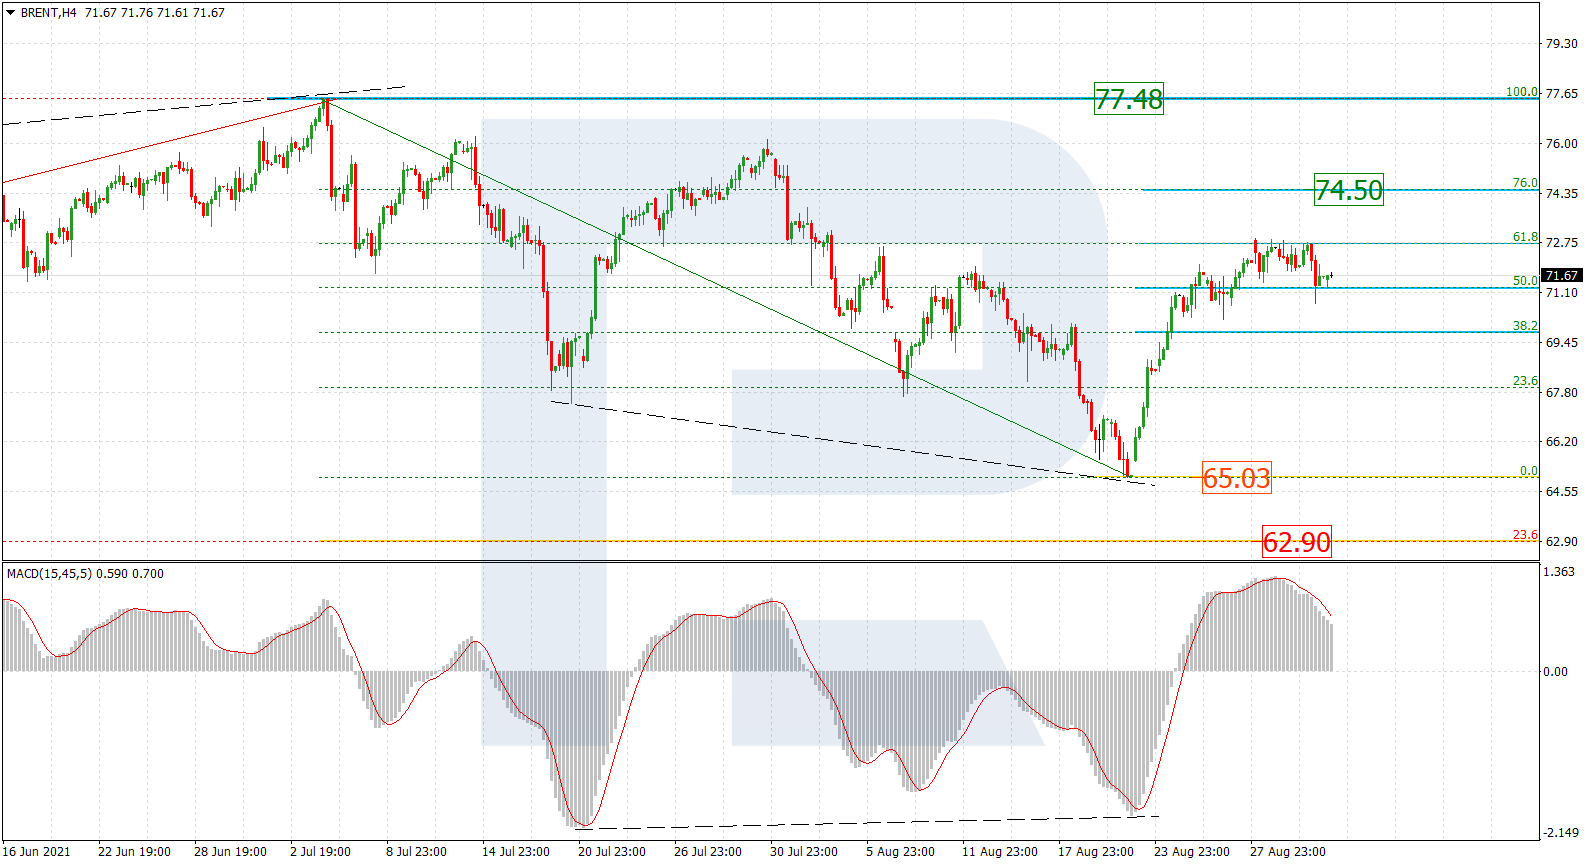
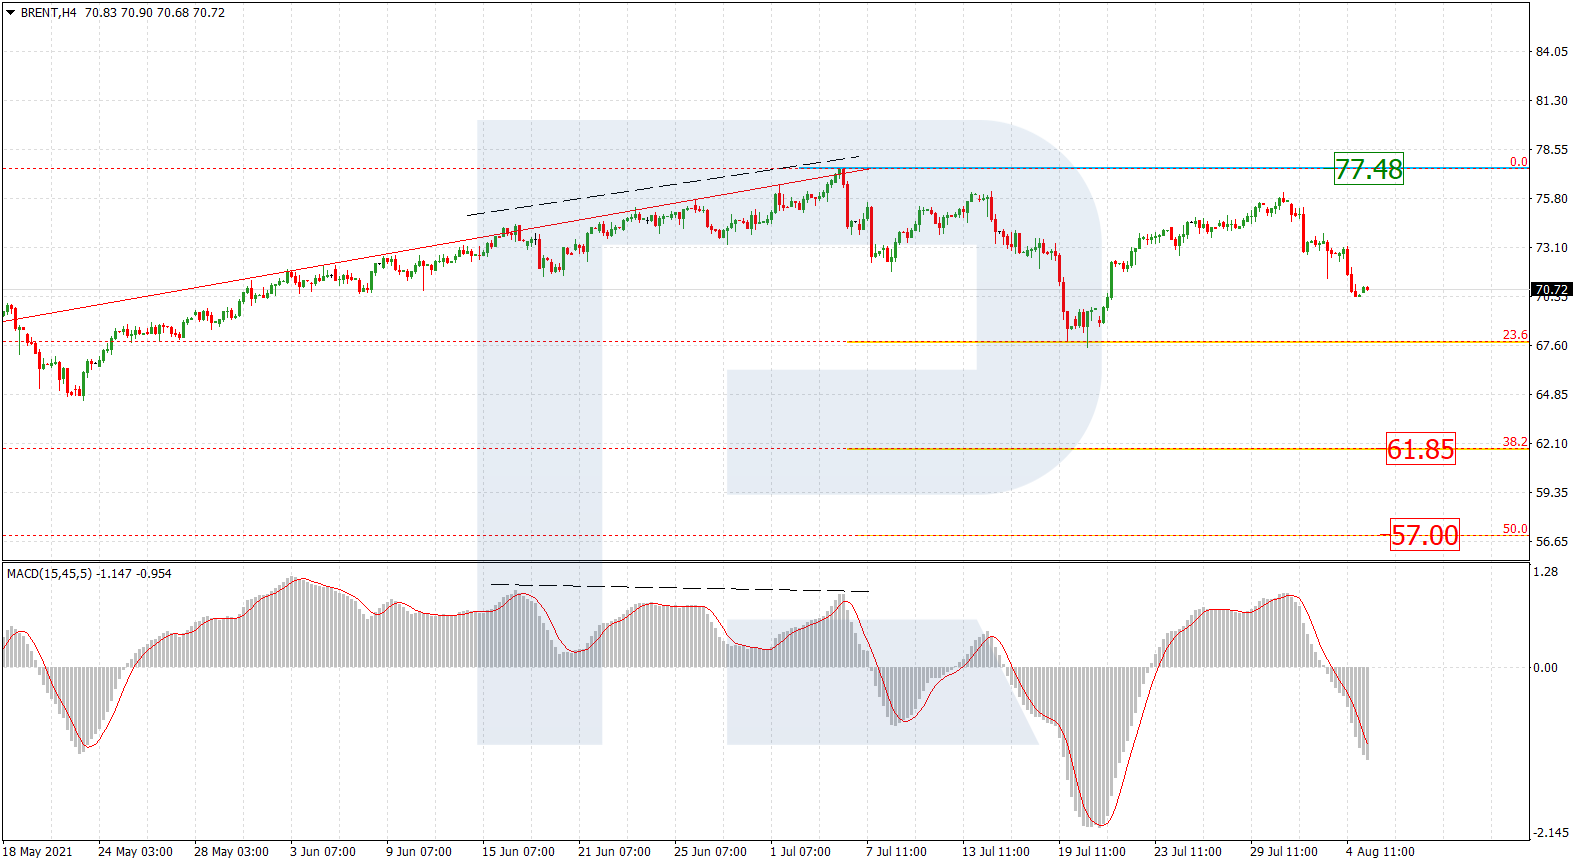
Brent

On H4, after growth and a bounce off the fractal resistance level, the market is developing another wave of decline. While the first declining wave tested 23.6% Fibo, the next one will aim at 38.2% (61.85) and 50.0% (57.00). The resistance level remains at 77.47. If it is broken away, the quotations may rise to the fractal peak of 87.09.

https://roboforex.com/uploads/roboforecast/roboforex.com/99/2021/Fibo/august/05/BRENTH4.png

Read more - Fibonacci Retracements Analysis Brent, Dow Jones

Re: Forex Technical Analysis & Forecast by RoboForex

Japanese Candlestick Analysis for 06.08.2021 (USDCAD, AUDUSD, USDCHF)

USDCAD, "US Dollar vs Canadian Dollar"

USDCAD keeps correcting. At the resistance level, it has formed several reversal patterns, including a Harami. Going by the reversal signal, the pair might go on pulling back with the aim of the support level at 1.2428. However, the quotations might still grow to 1.2550 without testing the support level.

https://roboforex.com/uploads/roboforecast/roboforex.com/99/2021/Candles/august/06/USDCADH4.png

Read more - Japanese Candlesticks Analysis (USDCAD, AUDUSD, USDCHF

Re: Forex Technical Analysis & Forecast by RoboForex

Forex Technical Analysis & Forecast 09.08.2021

EURUSD, “Euro vs US Dollar”

The currency pair has performed a wave of decline to 1.1744. Today the market is trading in a structure of growth towards 1.1763. This will be followed by a decline to 1.1750, and then a consolidation range is likely to develop at these levels. With an escape upwards, the price might then correct to 1.1788. After an escape downwards, the trend might continue to 1.1600.

https://roboforex.com/uploads/roboforecast/roboforex.com/99/2021/TA/august/09/EURUSDH1.png

Read more - Forex Technical Analysis & Forecast 09.08.2021

Re: Forex Technical Analysis & Forecast by RoboForex

Murrey Math Lines for 10.08.2021 (AUDUSD, NZDUSD)

AUDUSD, "Australian Dollar vs US Dollar"

On H4, the quotations have reached the oversold area. We expect them to bounce off 0/8, which might end up in a correctional growth to the resistance level of 2/8. The scenario can be cancelled by a breakaway of 0/8 downwards, which will lead to further falling to the support level of -1/8.

https://roboforex.com/uploads/roboforecast/roboforex.com/99/2021/Murrey/august/10/1.png

Read more - Murrey Math Lines AUDUSD, NZDUSD

Re: Forex Technical Analysis & Forecast by RoboForex

Forex Technical Analysis & Forecast for 11.08.2021

EURUSD, “Euro vs US Dollar”

The currency pair has bounced off 1.1767 and keeps trading in a structure of a declining wave. Today a link of growth to 1.1740 (a test from below) is not excluded. Then the downtrend should continue. The next goal is 1.1680. After this one is reached, we expect a consolidation range to develop. With an escape upwards, the pair might correct to 1.1767. With an escape downwards, a pathway to 1.1600 should open.

https://roboforex.com/uploads/roboforecast/roboforex.com/99/2021/TA/august/11/EURUSDH1.png

Read more - Forex Technical Analysis & Forecast for 11.08.2021

Re: Forex Technical Analysis & Forecast by RoboForex

Fibonacci Retracement Analysis for 12.08 2021 (Brent, Dow Jones)

Brent

On D1, the market has tried to develop a downtrend twice after a divergence, yet every such movement turns into a flat. If the market does overcome the support level at the last fractal lows, the bearish dynamics will head for 23.6% (62.84), 38.2% (53.90), 50.0% (57.00), and 61.8% (39.35) Fibo. The resistance level is still the high of 77.47.

https://roboforex.com/uploads/roboforecast/roboforex.com/99/2021/Fibo/august/12/BRENTDaily.png

Read more - Fibonacci Retracements Analysis (Brent, Dow Jones

Re: Forex Technical Analysis & Forecast by RoboForex

Japanese Candlestick Analysis for 13.08.2021 (GOLD, NZDUSD, GBPUSD)

XAUUSD, "Gold vs US Dollar"

After falling, the pair is now recovering. At the support level, the pair has formed several reversal patterns, including a Doji and an Engulfing. Going by the patterns, the pair might resume growing, aiming at the resistance level of 1790.00. However, the quotations might pull back to 1720.00 before growing on.

https://roboforex.com/uploads/roboforecast/roboforex.com/99/2021/Candles/august/13/XAUUSDH4.png

Read more - Japanese Candlesticks Analysis GOLD, NZDUSD, GBPUSD

Re: Forex Technical Analysis & Forecast by RoboForex

Ichimoku Cloud Analysis 16.08.2021(EURUSD, GBPUSD, XAUUSD)

EURUSD, “Euro vs US Dollar”

EURUSD is trading at 1.1787; the instrument is moving below Ichimoku Cloud, thus indicating a descending tendency. The markets could indicate that the price may test the cloud’s upside border at 1.1805 and then resume moving downwards to reach 1.1695. Another signal in favor of a further downtrend will be a rebound from the resistance level. However, the bearish scenario may be cancelled if the price breaks the cloud’s upside border and fixes above 1.1820. In this case, the pair may continue growing towards 1.1905. To confirm further decline, the asset must break the bullish channel’s downside border and fix below 1.1750.

https://roboforex.com/uploads/roboforecast/roboforex.com/99/2021/Ichimoku/august/16/eurusd.png

Read more - Ichimoku Cloud Analysis EURUSD, GBPUSD, XAUUSD

Re: Forex Technical Analysis & Forecast by RoboForex

Japanese Candlesticks Analysis 17.08.2021 (EURUSD, USDJPY, EURGBP)

EURUSD, “Euro vs US Dollar”

As we can see in the H4 chart, the asset has formed several reversal patterns, including Harami, not far from the resistance level. At the moment, EURUSD may reverse and continue the correction. In this case, the downside target may be at 1.1740. Later, the market may rebound from the support area and resume trading upwards. However, an alternative scenario implies that the price may grow to reach 1.1830 without testing the support area.

https://roboforex.com/uploads/roboforecast/roboforex.com/99/2021/Candles/august/17/EURUSDH4.png

Read more - Japanese Candlesticks Analysis EURUSD, USDJPY, EURGBP

485 (edited by RF roboforex 2021-08-18 12:27:04)

Re: Forex Technical Analysis & Forecast by RoboForex

Forex Technical Analysis & Forecast 18.08.2021

EURUSD, “Euro vs US Dollar”

After finishing the descending wave at 1.1710, EURUSD is consolidating around this level. Possibly, today the pair may reach 1.1690 and then form one more ascending structure towards 1.1800. Later, the market may fall to break 1.1650 and then continue trading downwards with the target at 1.1600.

https://roboforex.com/uploads/roboforecast/roboforex.com/99/2021/TA/august/18/EURUSDH1.png

Read more - Forex Technical Analysis & Forecast 18.08.2021

Re: Forex Technical Analysis & Forecast by RoboForex

Fibonacci Retracements Analysis 19.08.2021 (Brent, Dow Jones)

Brent

In the daily chart, there was divergence on MACD and several attempts to decline, after which the asset managed to update its local lows that acted as the support. Such dynamics may be a signal in favour of a further downtrend towards 23.6%, 38.2%, 50.0%, and 61.8% fibo at 62.90, 53.88, 46.65, and 39.40 respectively. The resistance is still close to the high at 77.48.

https://roboforex.com/uploads/roboforecast/roboforex.com/99/2021/Fibo/august/19/BRENTDaily.png

Read more - Fibonacci Retracements Analysis Brent, Dow Jones

Re: Forex Technical Analysis & Forecast by RoboForex

Japanese Candlesticks Analysis 20.08.2021 (EURUSD, USDJPY, EURGBP)

EURUSD, “Euro vs US Dollar”

As we can see in the H4 chart, the asset has formed several reversal patterns, including Hammer, not far from the support level. At the moment, EURUSD may reverse and start a new pullback. In this case, the correctional target may be at 1.1730. Later, the market may rebound from the resistance area and resume trading downwards. However, an alternative scenario implies that the price may break the support level and fall to reach 1.1616 without correcting towards the resistance area.

https://roboforex.com/uploads/roboforecast/roboforex.com/99/2021/Candles/august/20/EURUSDH4.png

Read more - Japanese Candlesticks Analysis EURUSD, USDJPY, EURGBP

Re: Forex Technical Analysis & Forecast by RoboForex

Ichimoku Cloud Analysis 23.08.2021 (AUDUSD, BRENT, USDJPY)

AUDUSD, “Australian Dollar vs US Dollar”

AUDUSD is trading at 0.7158; the instrument is moving below Ichimoku Cloud, thus indicating a descending tendency. The markets could indicate that the price may test Tenkan-Sen and Kijun-Sen at 0.7215 and then resume moving downwards to reach 0.6995. Another signal in favor of a further downtrend will be a rebound from the descending channel’s upside border. However, the bearish scenario may no longer be valid if the price breaks the cloud’s upside border and fixes above 0.7355. In this case, the pair may continue growing towards 0.7445.

https://roboforex.com/uploads/roboforecast/roboforex.com/99/2021/Ichimoku/august/23/audusd.png

Read more - Ichimoku Cloud Analysis AUDUSD, BRENT, USDJPY

Re: Forex Technical Analysis & Forecast by RoboForex

Japanese Candlesticks Analysis 24.08.2021 (USDCAD, AUDUSD, USDCHF)

USDCAD, “US Dollar vs Canadian Dollar”

As we can see in the H4 chart, the asset continues falling. After forming a Shooting Star pattern close to the resistance level, USDCAD is reversing and may resume falling towards the support area at 1.2580. However, an alternative scenario implies that the asset may continue growing to reach 1.2740 without testing the support area.

https://roboforex.com/uploads/roboforecast/roboforex.com/99/2021/Candles/august/24/USDCADH4.png

Read more - Japanese Candlesticks Analysis USDCAD, AUDUSD, USDCHF

Re: Forex Technical Analysis & Forecast by RoboForex

Forex Technical Analysis & Forecast 25.08.2021

EURUSD, “Euro vs US Dollar”

After finishing the ascending structure at 1.1762, EURUSD is falling towards 1.1726, thus forming a new consolidation range between these two levels. If later the price breaks this range to the downside, the market may resume falling with the target at 1.1600; if to the upside – form one more ascending structure to reach 1.1777 and then start a new decline.

https://roboforex.com/uploads/roboforecast/roboforex.com/99/2021/TA/august/25/EURUSDH1.png

Read more - Forex Technical Analysis & Forecast 25.08.2021

Re: Forex Technical Analysis & Forecast by RoboForex

Fibonacci Retracements Analysis 26.08.2021 (Brent, Dow Jones)

Brent


In the H4 chart, Brent is steadily moving upwards after convergence on MACD and has already reached 50.0% fibo. Later, the asset may continue growing towards 61.8% fibo at 72.72. This ascending movement should be considered as a correction, that’s why it may later be followed by a new decline to break the low at 65.03 and reach the mid-term 23.6% fibo at 62.90. The resistance is still close to the high at 77.48.

https://roboforex.com/uploads/roboforecast/roboforex.com/99/2021/Fibo/august/26/BRENTH4.png

Read more - Fibonacci Retracements Analysis Brent, Dow Jones

Re: Forex Technical Analysis & Forecast by RoboForex

Japanese Candlesticks Analysis 27.08.2021 (USDCAD, AUDUSD, USDCHF)

USDCAD, “US Dollar vs Canadian Dollar”

As we can see in the H4 chart, the asset is correcting. After forming a Harami pattern close to the resistance level, USDCAD may reverse and form a new pullback towards the channel’s downside border. In this case, the correctional target may be the support area at 1.2610. However, an alternative scenario implies that the asset may continue growing to reach 1.2790 without testing the support area.

https://roboforex.com/uploads/roboforecast/roboforex.com/99/2021/Candles/august/27/USDCADH4.png

Read more - Japanese Candlesticks Analysis USDCAD, AUDUSD, USDCHF

Re: Forex Technical Analysis & Forecast by RoboForex

Ichimoku Cloud Analysis 30.08.2021 (GBPUSD, NZDUSD, EURGBP)

GBPUSD, “Great Britain Pound vs US Dollar”

GBPUSD is trading at 1.3769; the instrument is moving above Ichimoku Cloud, thus indicating an ascending tendency. The markets could indicate that the price may test the cloud’s upside border at 1.3735 and then resume moving upwards to reach 1.3920. Another signal in favor of a further uptrend will be a rebound from the rising channel’s downside border. However, the bullish scenario may no longer be valid if the price breaks the cloud’s downside border and fixes below 1.3655. In this case, the pair may continue falling towards 1.3565.

https://roboforex.com/uploads/roboforecast/roboforex.com/99/2021/Ichimoku/august/30/gbpusd.png

Read more - Ichimoku Cloud Analysis GBPUSD, NZDUSD, EURGBP

Re: Forex Technical Analysis & Forecast by RoboForex

Murrey Math Lines 31.08.2021 (AUDUSD, NZDUSD)

AUDUSD, “Australian Dollar vs US Dollar”

In the H4 chart, AUDUSD is consolidating between 3/8 and 5/8. In this case, the price is expected to test 4/8, break it, and then continue moving upwards to reach the resistance at 5/8. However, this scenario may be cancelled if the price breaks 3/8 to the downside. After that, the instrument may reverse and fall towards the support at 2/8.

https://roboforex.com/uploads/roboforecast/roboforex.com/99/2021/Murrey/august/31/1.png

Read more - Murrey Math Lines AUDUSD, NZDUSD

Re: Forex Technical Analysis & Forecast by RoboForex

Forex Technical Analysis & Forecast 01.09.2021

EURUSD, “Euro vs US Dollar”

After rebounding from 1.1844 and then finishing the descending impulse at 1.1796, EURUSD is forming a new consolidation range above the latter level. If later the price breaks this range to the upside, the market may correct upwards to reach 1.1818; if to the downside – start a new decline with the short-term target at 1.1770.

https://roboforex.com/uploads/roboforecast/roboforex.com/99/2021/TA/september/01/EURUSDH1.png

Read more - Forex Technical Analysis & Forecast 01.09.2021

Re: Forex Technical Analysis & Forecast by RoboForex

Fibonacci Retracements Analysis 02.09.2021 (Brent, Dow Jones)

Brent

In the H4 chart, the correctional uptrend in Brent has reached 61.8% fib and may later continue towards 76.0% fibo at 74.50. After that, the instrument may start a new decline to break the low at 65.03 and reach the mid-term 23.6% fibo at 62.90. The resistance is still close to the high at 77.48.

https://roboforex.com/uploads/roboforecast/roboforex.com/99/2021/Fibo/september/02/BRENTH4.png

Read more - Fibonacci Retracements Analysis Brent, Dow Jones

Re: Forex Technical Analysis & Forecast by RoboForex

Japanese Candlesticks Analysis 03.09.2021 (XAUUSD, NZDUSD, GBPUSD)

XAUUSD, “Gold vs US Dollar”

As we can see in the H4 chart, the sideways tendency continues. After forming several reversal patterns, such as Hammer and Doji, not far from the support level, XAUUSD may reverse and start a new growth to reach the resistance area at 1850.00. At the same time, an opposite scenario implies that the price may continue falling towards 1790.00 before resuming its ascending tendency.

https://roboforex.com/uploads/roboforecast/roboforex.com/99/2021/Candles/september/03/XAUUSDH4.png

Read more - Japanese Candlesticks Analysis XAUUSD, NZDUSD, GBPUSD

Re: Forex Technical Analysis & Forecast by RoboForex

Ichimoku Cloud Analysis 06.09.2021 (USDCAD, AUDUSD, USDJPY)

USDCAD, “US Dollar vs Canadian Dollar”

USDCAD is trading at 1.2540; the instrument is moving below Ichimoku Cloud, thus indicating a descending tendency. The markets could indicate that the price may test the cloud’s downside border at 1.2595 and then resume moving downwards to reach 1.2315. Another signal in favor of a further downtrend will be a rebound from the descending channel’s upside border. However, the bearish scenario may no longer be valid if the price breaks the cloud’s upside border and fixes above 1.2805. In this case, the pair may continue growing towards 1.2895.

https://roboforex.com/uploads/roboforecast/roboforex.com/99/2021/Ichimoku/september/06/usdcad.png

Read more - Ichimoku Cloud Analysis USDCAD, AUDUSD, USDJPY

Re: Forex Technical Analysis & Forecast by RoboForex

Murrey Math Lines 07.09.2021 (AUDUSD, NZDUSD)

AUDUSD, “Australian Dollar vs US Dollar”

In the H4 chart, AUDUSD is trading above the 200-day Moving Average, thus indicating an ascending tendency. In this case, the price is expected to continue moving upwards to reach the closest resistance at 7/8. However, this scenario may be cancelled if the price breaks 6/8 to the downside. After that, the instrument may reverse and correct towards the support at 5/8.

https://roboforex.com/uploads/roboforecast/roboforex.com/99/2021/Murrey/september/07/1.png

Read more - Murrey Math Lines AUDUSD, NZDUSD

Re: Forex Technical Analysis & Forecast by RoboForex

Forex Technical Analysis & Forecast 08.09.2021

EURUSD, “Euro vs US Dollar”

After completing the descending structure at 1.1859 and forming a downside continuation pattern there, EURUSD has broken this level. Possibly, today the pair may fall towards 1.1834 and then resume growing to test 1.1859 from below. Later, the market may form a new descending structure with the short-term target at 1.1822 and then start another growth to return to 1.1859. After that, the instrument may resume trading downwards to reach 1.1800.

https://roboforex.com/uploads/roboforecast/roboforex.com/99/2021/TA/september/08/EURUSDH1.png

Read more - Forex Technical Analysis & Forecast 08.09.2021

Posts: 476 to 500 of 1,098

Pages Previous 1 18 19 20 21 22 44 Next

You must login or register to post a reply

Forex Software → Market Analysis → Forex Technical Analysis & Forecast by RoboForex

Similar topics in this forum