forex software

Create and Test Forex Strategies

forex software

Skip to forum content

Forex Software

Create and Test Forex Strategies

You are not logged in. Please login or register.


(Page 24 of 44)

Forex Software → Market Analysis → Forex Technical Analysis & Forecast by RoboForex

Pages Previous 1 22 23 24 25 26 44 Next

You must login or register to post a reply

RSS topic feed

Posts: 576 to 600 of 1,098

Re: Forex Technical Analysis & Forecast by RoboForex

Fibonacci Retracements Analysis 23.12.2021 (Brent, Dow Jones)

Brent

As we can see in the H4 chart, Brent is correcting upwards after attempting to reach the low 65.89. There is a possibility that the current ascending movement may attack the high at 86.63. However, if this wave fails to break the high and rebounds from it instead, the asset may start a new decline towards long-term 38.2%, 50.0%, and 61.8% fibo at 59.53, 51.20, and 42.86 respectively.

https://roboforex.com/uploads/roboforecast/roboforex.com/99/2021/Fibo/december/23/BRENTH4.png

Read more - Fibonacci Retracements Analysis Brent, Dow Jones

Re: Forex Technical Analysis & Forecast by RoboForex

Japanese Candlesticks Analysis 24.12.2021 (XAUUSD, NZDUSD, GBPUSD)

XAUUSD, “Gold vs US Dollar”

As we can see in the H4 chart, the asset is still trading upwards. After forming a Hammer reversal pattern not far from the support level during the pullback, XAUUSD may reverse and continue forming its rising impulse. In this case, the upside target may be the resistance area at 1835.50. At the same time, an opposite scenario implies that the price may correct towards 1795.00 first and then resume trading upwards.

https://roboforex.com/uploads/roboforecast/roboforex.com/99/2021/Candles/december/24/XAUUSDH4.png

Read more - Japanese Candlesticks Analysis XAUUSD, NZDUSD, GBPUSD

Re: Forex Technical Analysis & Forecast by RoboForex

Ichimoku Cloud Analysis 27.12.2021 (NZDUSD, BRENT, USDCHF)

NZDUSD, “New Zealand Dollar vs US Dollar”

NZDUSD is trading at 0.6808; the instrument is moving above Ichimoku Cloud, thus indicating an ascending tendency. The markets could indicate that the price may test the cloud’s upside border at 0.6765 and then resume moving upwards to reach 0.6915. Another signal in favour of a further uptrend will be a rebound from the descending channel’s upside border. However, the bullish scenario may no longer be valid if the price breaks the cloud’s downside border and fixes below 0.6720. In this case, the pair may continue falling towards 0.6635. To confirm further growth, the asset must break the resistance level and fix above 0.6845; so far, bulls haven’t been able to break this area.

https://roboforex.com/uploads/roboforecast/roboforex.com/99/2021/Ichimoku/december/27/nzdusd.png

Read more - Ichimoku Cloud Analysis NZDUSD, BRENT, USDCHF

Re: Forex Technical Analysis & Forecast by RoboForex

Japanese Candlesticks Analysis 28.12.2021 (EURUSD, USDJPY, EURGBP)

EURUSD, “Euro vs US Dollar”

As we can see in the H4 chart, the asset has formed a Harami reversal pattern close to the resistance level. At the moment, EURUSD may reverse and form a new descending impulse. In this case, the downside correctional target may be at 1.1300. However, an alternative scenario implies that the price may grow to reach 1.1370 and continue its ascending tendency without testing the support area.

https://roboforex.com/uploads/roboforecast/roboforex.com/99/2021/Candles/december/28/EURUSDH4.png

Read more - Japanese Candlesticks Analysis EURUSD, USDJPY, EURGBP

Re: Forex Technical Analysis & Forecast by RoboForex

Forex Technical Analysis & Forecast 29.12.2021

EURUSD, “Euro vs US Dollar”

EURUSD has finished the descending wave at 1.1292 along with the ascending structure towards 1.1317. Possibly, the pair may fall to reach 1.1280 and then form one more ascending structure with the target at 1.1338.

https://roboforex.com/uploads/roboforecast/roboforex.com/99/2021/TA/december/29/EURUSDH1.png

Read more - Forex Technical Analysis & Forecast 29.12.2021

Re: Forex Technical Analysis & Forecast by RoboForex

Fibonacci Retracements Analysis 30.12.2021 (Brent, Dow Jones)

Brent

As we can see in the H4 chart, Brent is still moving upwards and may attempt to reach the high 86.63. If this wave fails to break the high and rebounds from it instead, the asset may start a new decline break the low at 65.89 and then continue falling towards long-term 38.2%, 50.0%, and 61.8% fibo at 59.53, 51.20, and 42.86 respectively.

https://roboforex.com/uploads/roboforecast/roboforex.com/99/2021/Fibo/december/30/BRENTH4.png

Read more - Fibonacci Retracements Analysis Brent, Dow Jones

Re: Forex Technical Analysis & Forecast by RoboForex

Murrey Math Lines 04.01.2022 (EURUSD, GBPUSD)

EURUSD, “Euro vs US Dollar”

In the H4 chart, EURUSD is trading below the 200-day Moving Average, thus indicating a descending tendency. In this case, the price is expected to test 2/8, break it, and then continue falling to reach the support at 0/8. Still, this scenario may no longer be valid if the price breaks 3/8 to the upside. After that, the instrument may reverse and grow towards the resistance at 5/8.

https://roboforex.com/uploads/roboforecast/roboforex.com/99/2022/Murrey/january/04/1.png

Read more - Murrey Math Lines EURUSD, GBPUSD

Re: Forex Technical Analysis & Forecast by RoboForex

Forex Technical Analysis & Forecast 05.01.2022

EURUSD, “Euro vs US Dollar”

After reaching the short-term downside target at 1.1272, EURUSD has finished the ascending structure towards 1.1321. Possibly, today the pair may fall to reach 1.1254 and then form one more ascending structure with the target at 1.1322.

https://roboforex.com/uploads/roboforecast/roboforex.com/99/2022/TA/january/05/EURUSDH1.png

Read more - Forex Technical Analysis & Forecast 05.01.2022

Re: Forex Technical Analysis & Forecast by RoboForex

Fibonacci Retracements Analysis 06.01.2022 (Brent, Dow Jones)

Brent

As we can see in the H4 chart, Brent has stopped moving upwards after divergence on MACD. In this case, the asset may start a new decline break the low at 65.89 and then continue falling towards long-term 38.2% fibo at 59.53. The key resistance is the high at 86.63.

https://roboforex.com/uploads/roboforecast/roboforex.com/99/2022/Fibo/january/06/BRENTH4.png

Read more - Fibonacci Retracements Analysis Brent, Dow Jones

Re: Forex Technical Analysis & Forecast by RoboForex

Ichimoku Cloud Analysis 10.01.2022 (XAUUSD, GBPUSD, USDJPY)

XAUUSD, “Gold vs US Dollar”

XAUUSD is trading at 1793.00; the instrument is moving below Ichimoku Cloud, thus indicating a descending tendency. The markets could indicate that the price may test the cloud’s downside border at 1810.00 and then resume moving downwards to reach 1755.00. Another signal in favour of a further downtrend will be a rebound from the rising channel’s downside border. However, the bearish scenario may no longer be valid if the price breaks the cloud’s upside border and fixes above 1825.00. In this case, the pair may continue growing towards 1850.00.

https://roboforex.com/uploads/roboforecast/roboforex.com/99/2022/Ichimoku/january/10/xauusd.png

Read more - Ichimoku Cloud Analysis XAUUSD, GBPUSD, USDJPY

Re: Forex Technical Analysis & Forecast by RoboForex

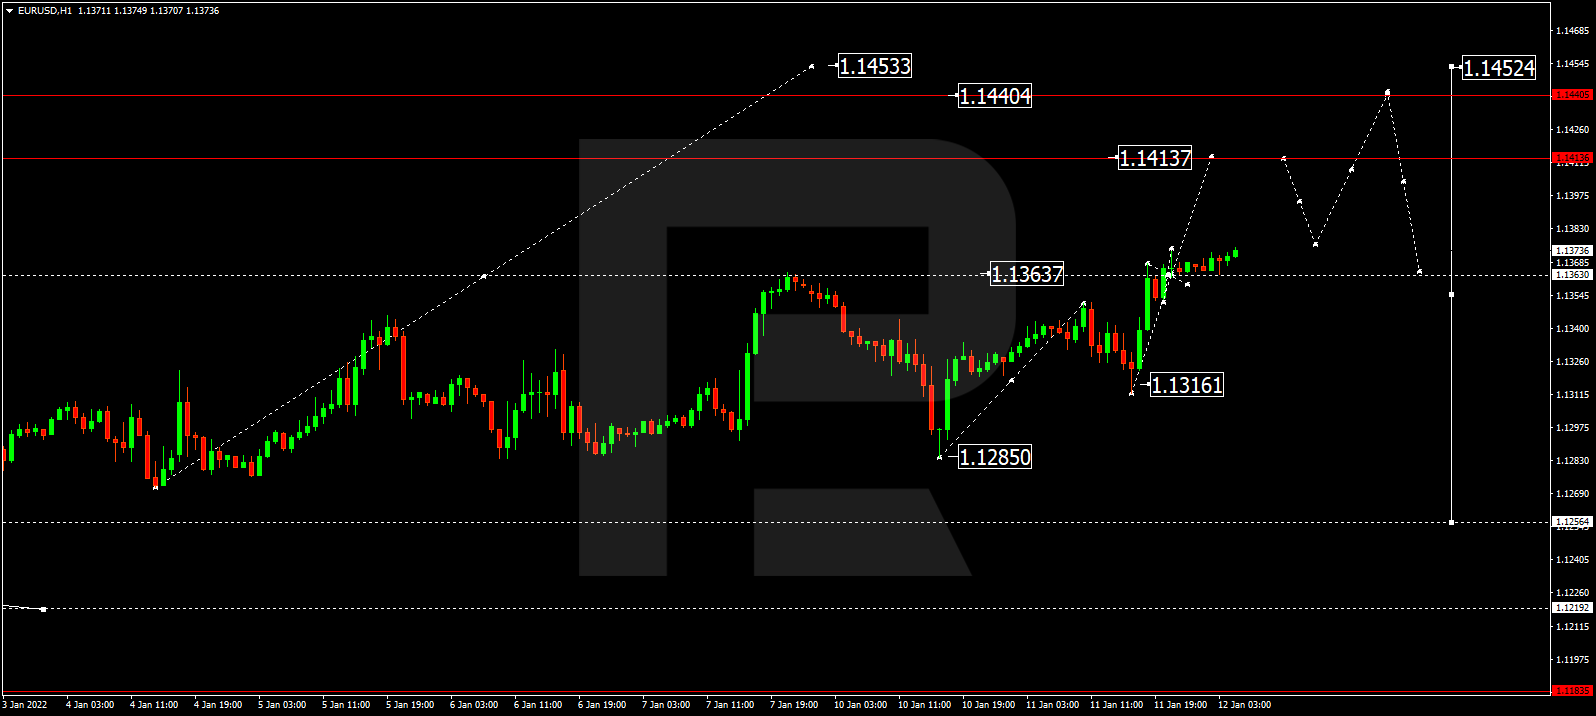
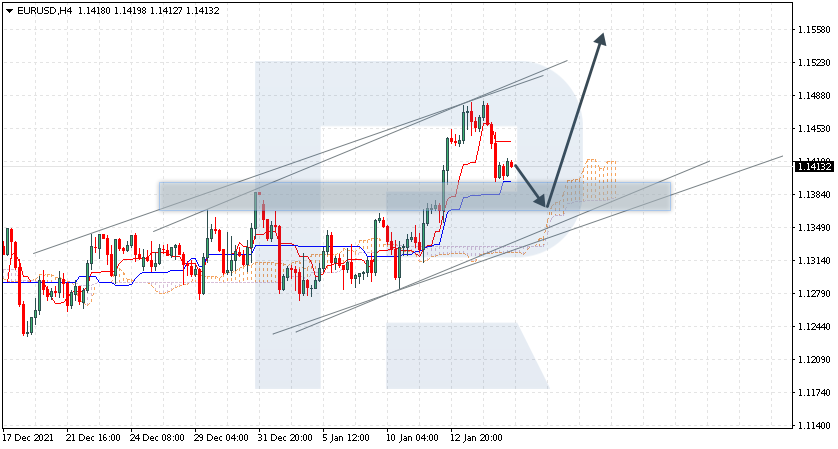
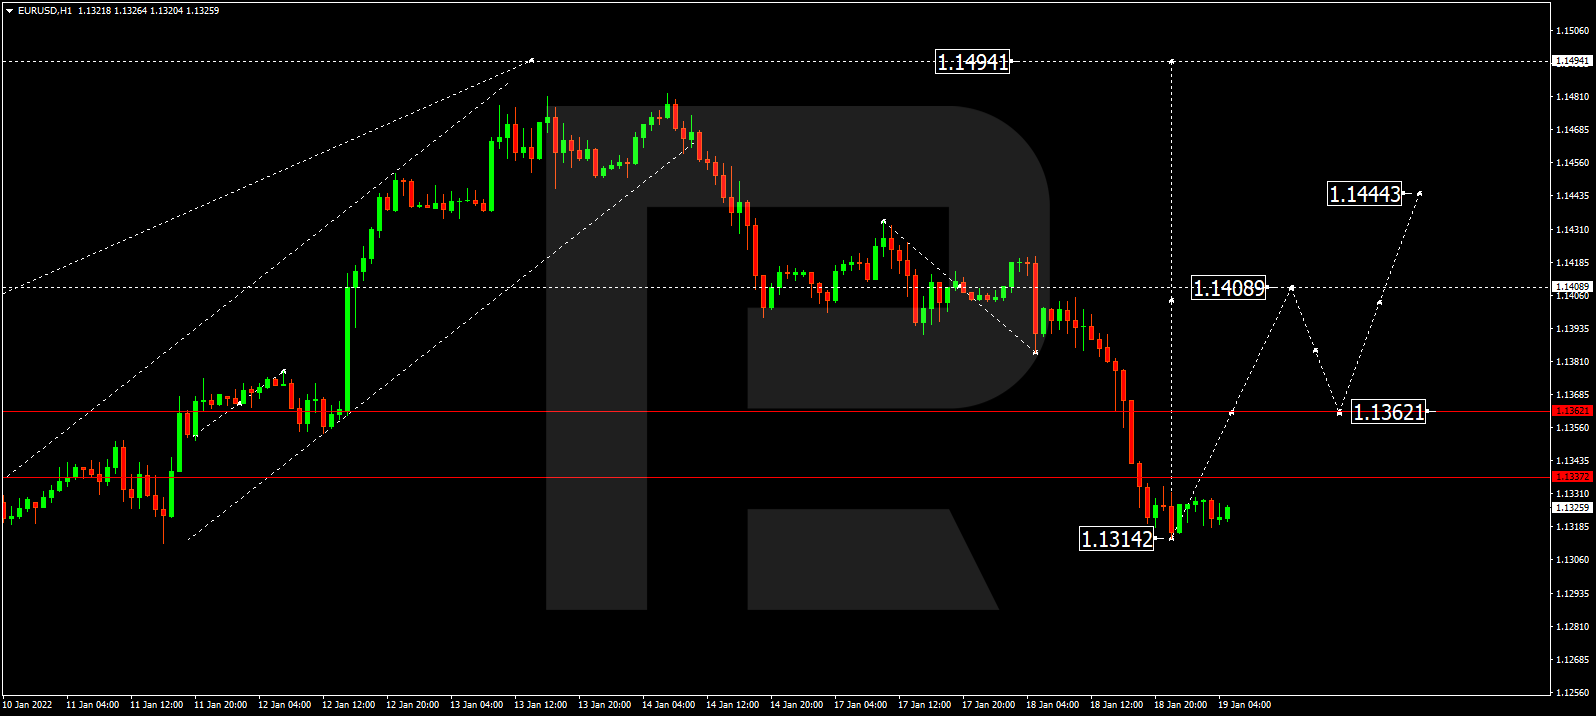
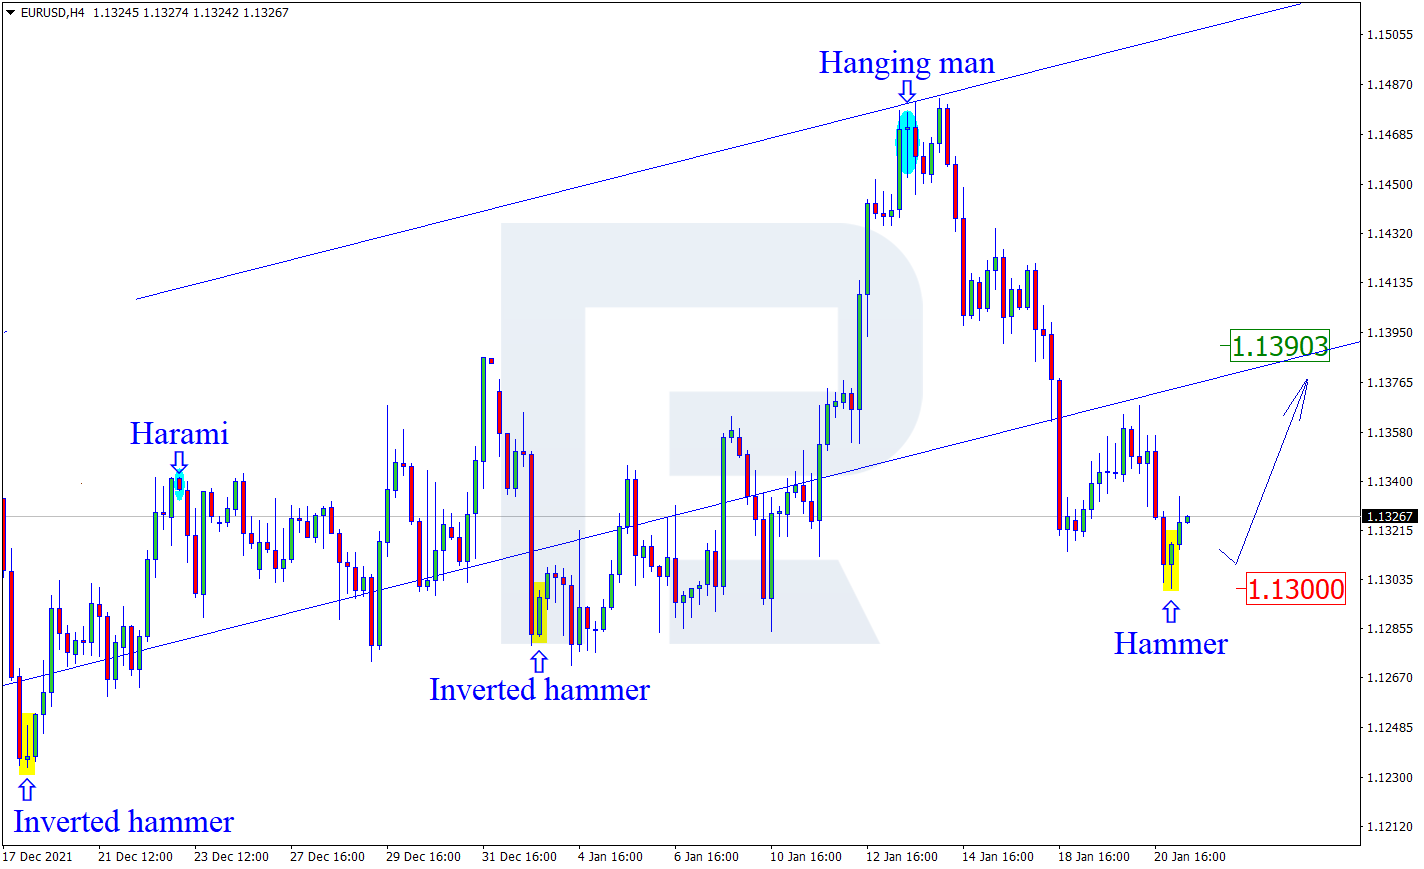
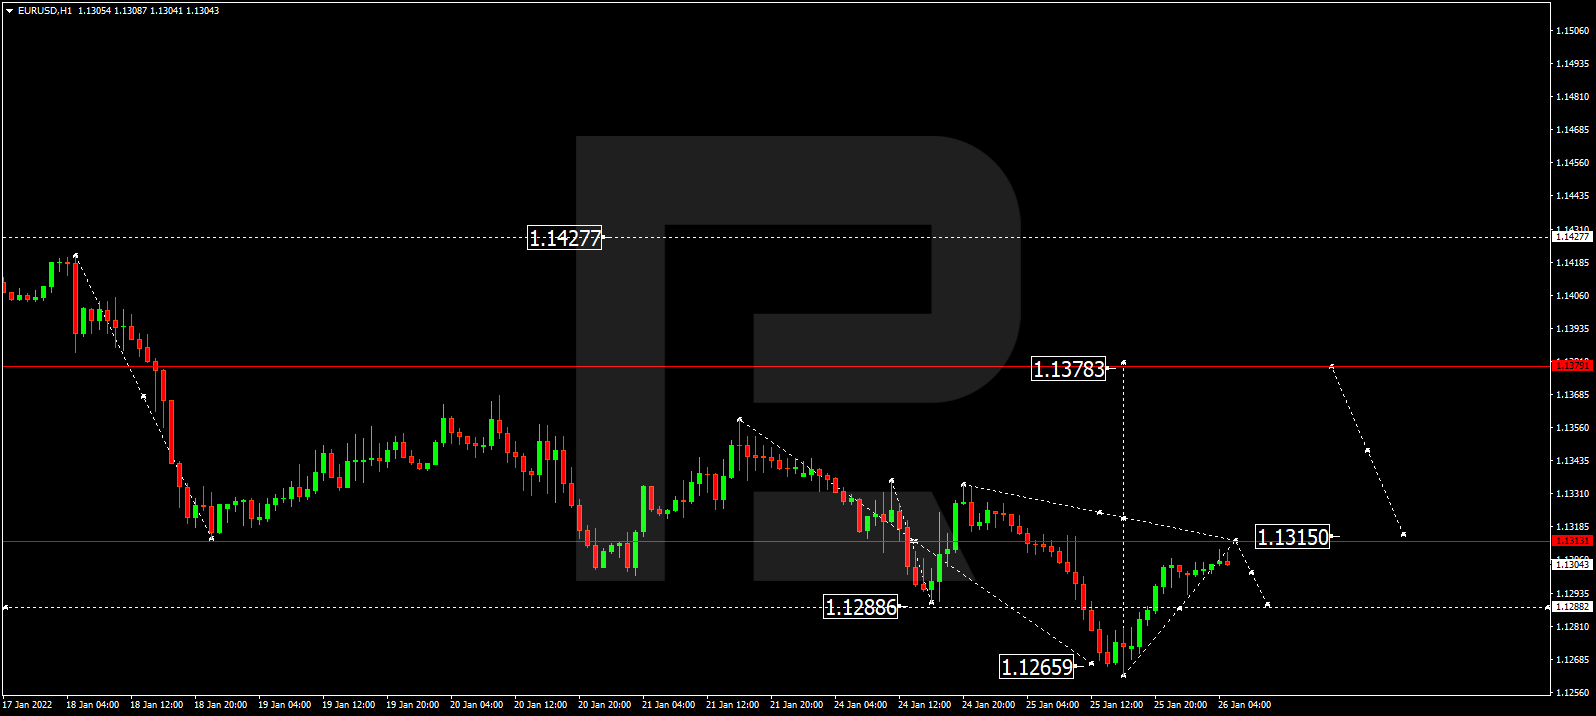
EURUSD is retreating. Overview for 10.01.2022

EURUSD found a reason for correcting; investors are processing FOMC Meeting Minutes along with the statistics. 

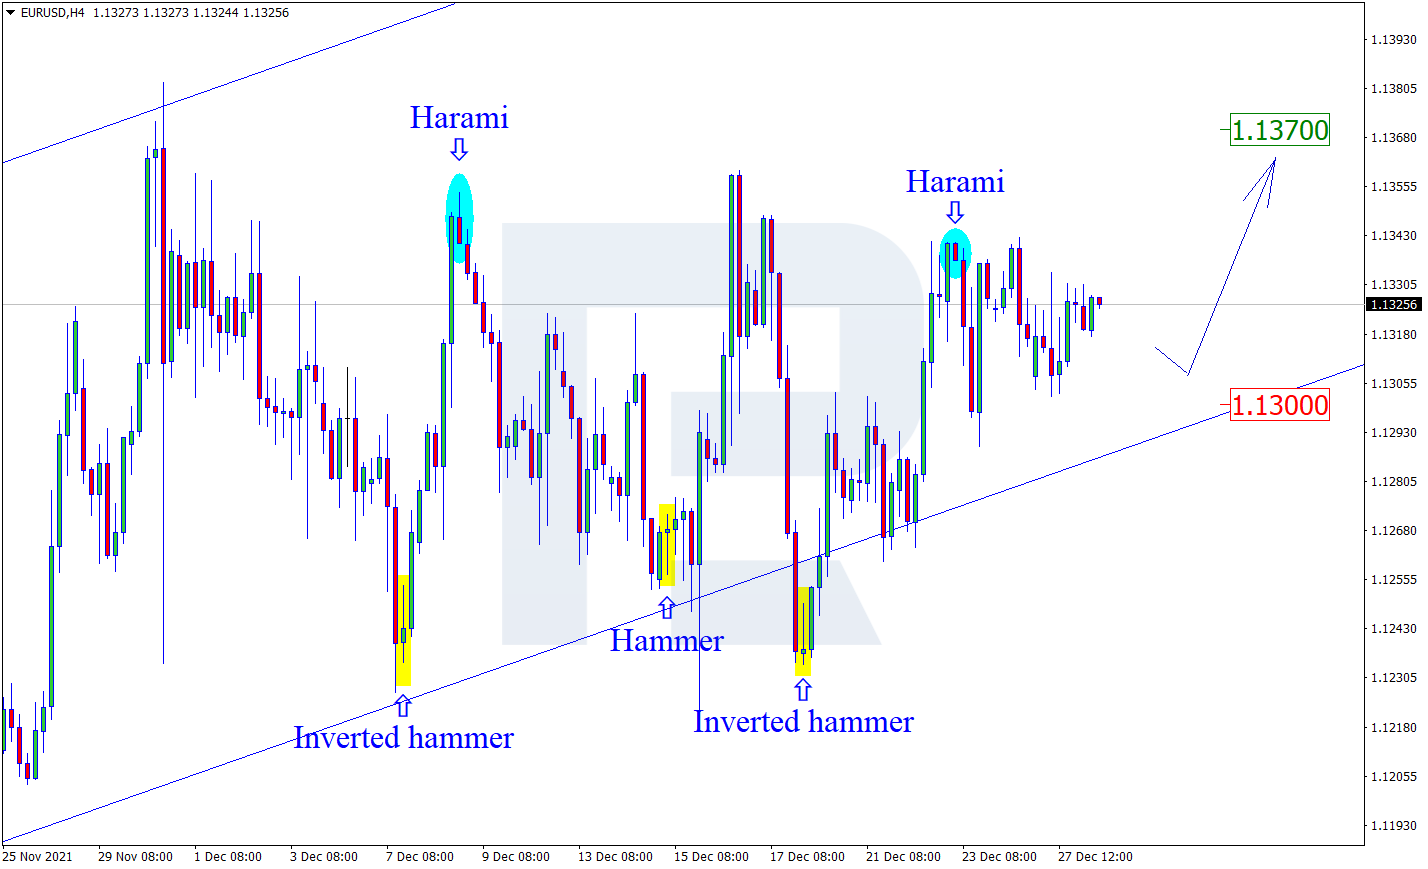
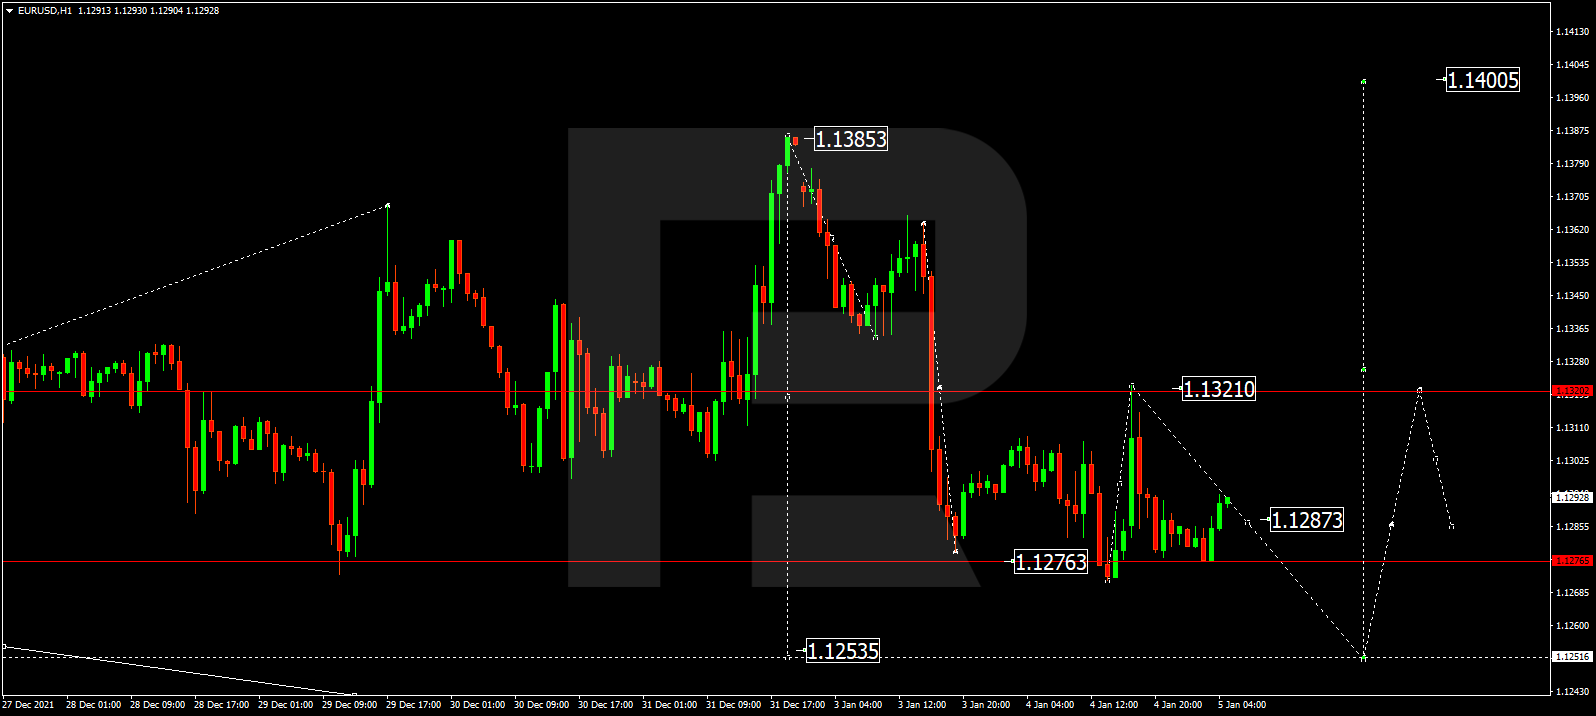
The major currency pair is falling a little bit on Monday. The current quote for the instrument is 1.1330.

The Unemployment Rate in the US dropped to 3.9% in December after being 4.1% the month before. The Average Hourly Earnings added 0.6% m/m, more than expected. It was good news for the “greenback”.

However, the next report turned out to be disappointing. The Non-Farm Payrolls showed only 199K after being 210K in the previous month and against the expected reading of 400K. It appears that the December reading didn’t go anywhere from the November one.

The Participation Rate remained at 61.9%.

Despite the NFP report, which was rather questionable, the labour market data was stronger than expected.

Market players are still processing the December FOMC Meeting Minutes. The document says that the regulator didn’t exclude a possibility of decreasing its own balance right after the rate hike. In addition to that, the Fed is expected to close the QE programme as early as March instead of June as it was announced in the past.

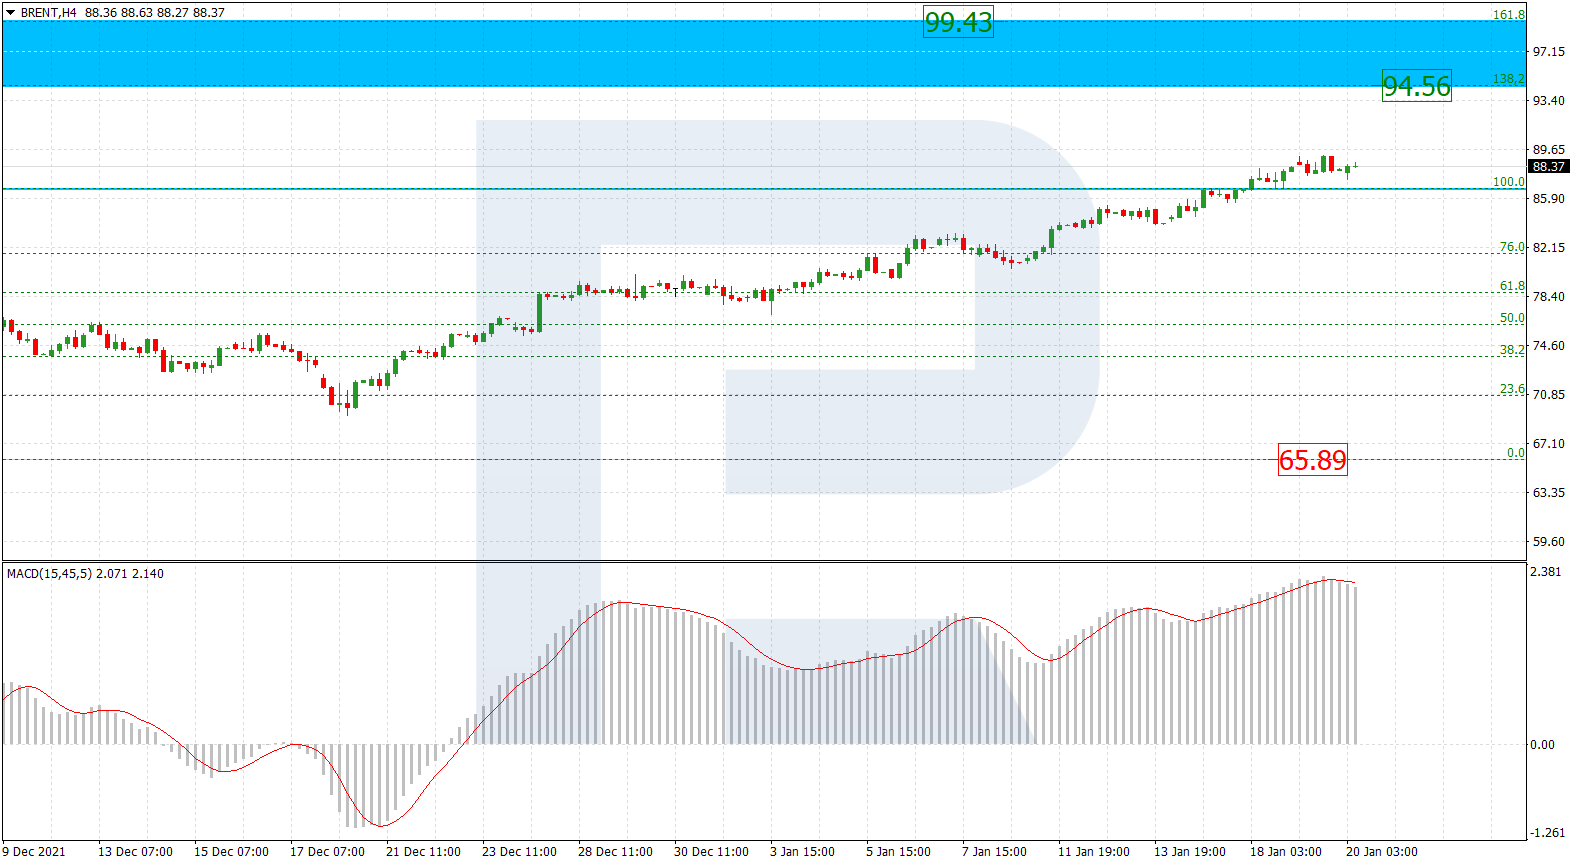
Forecasts for other instruments can be found in the section "Forex Forecasts and Analysis" on our website.

Re: Forex Technical Analysis & Forecast by RoboForex

Murrey Math Lines 11.01.2022 (AUDUSD, NZDUSD)

AUDUSD, “Australian Dollar vs US Dollar”

As we can see in the H4 chart, after breaking the 200-day Moving Average, AUDUSD is trading below it, thus indicating a possible descending tendency. In this case, the price is expected to test 5/8, break it, and then continue falling to reach the support at 4/8. However, this scenario may no longer be valid if the price breaks the resistance at 6/8 to the upside. After that, the instrument may continue growing towards 7/8.

https://roboforex.com/uploads/roboforecast/roboforex.com/99/2022/Murrey/january/11/1.png

Read more - Murrey Math Lines AUDUSD, NZDUSD

Re: Forex Technical Analysis & Forecast by RoboForex

Forex Technical Analysis & Forecast 12.01.2022

EURUSD, “Euro vs US Dollar”

Having completed the descending wave at 1.1313 and rebounding from this level, EURUSD is still growing and has already reached 1.1363; right now, it is consolidating around the latter level. Later, the market may break the range to the upside and form one more ascending structure with the short-term target at 1.1414.

https://roboforex.com/uploads/roboforecast/roboforex.com/99/2022/TA/january/12/EURUSDH1.png

Read more - Forex Technical Analysis & Forecast 12.01.2022

Re: Forex Technical Analysis & Forecast by RoboForex

Fibonacci Retracements Analysis 13.01.2022 (Brent, Dow Jones)

Brent

As we can see in the H4 chart, the situation has significantly changed over the last week. At the moment, Brent is steadily growing towards the high at 86.63. However, the asset may yet slightly correct before attacking this level. After breaking the high, the price may continue trading upwards to reach the post-correctional extension area between 138.2% and 161.8% fibo at 94.50 and 99.40 respectively. The key support is the low at 65.89.

https://roboforex.com/uploads/roboforecast/roboforex.com/99/2022/Fibo/january/13/BRENTH4.png

Read more - Fibonacci Retracements Analysis Brent, Dow Jones

Re: Forex Technical Analysis & Forecast by RoboForex

Japanese Candlesticks Analysis 14.01.2022 (XAUUSD, NZDUSD, GBPUSD)

XAUUSD, “Gold vs US Dollar”

As we can see in the H4 chart, after forming a Hammer reversal pattern not far from the support level, XAUUSD is reversing and may continue forming its ascending impulse. In this case, the upside target may be the resistance area at 1845.00. At the same time, an opposite scenario implies that the price may correct towards 1815.00 before resuming its ascending tendency.

https://roboforex.com/uploads/roboforecast/roboforex.com/99/2022/Candles/january/14/XAUUSDH4.png

Read more - Japanese Candlesticks Analysis XAUUSD, NZDUSD, GBPUSD

Re: Forex Technical Analysis & Forecast by RoboForex

Ichimoku Cloud Analysis 17.01.2022 (EURUSD, XAGUSD, USDCAD)

EURUSD, “Euro vs US Dollar”

EURUSD is trading at 1.1413; the instrument is moving above Ichimoku Cloud, thus indicating an ascending tendency. The markets could indicate that the price may test the cloud’s upside border at 1.1375 and then resume moving upwards to reach 1.1560. Another signal in favour of a further uptrend will be a rebound from the rising channel’s downside border. However, the bullish scenario may no longer be valid if the price breaks the cloud’s downside border and fixes below 1.1290. In this case, the pair may continue falling towards 1.1195.

https://roboforex.com/uploads/roboforecast/roboforex.com/99/2022/Ichimoku/january/17/eurusd.png

Read more - Ichimoku Cloud Analysis EURUSD, XAGUSD, USDCAD

592 (edited by RF roboforex 2022-01-18 11:11:32)

Re: Forex Technical Analysis & Forecast by RoboForex

Murrey Math Lines 18.01.2022 (AUDUSD, NZDUSD)

AUDUSD, “Australian Dollar vs US Dollar”

In the H4 chart, after breaking the 200-day Moving Average again, AUDUSD is trading below it, thus indicating a possible descending tendency. In this case, the price is expected to test 5/8, break it, and then continue falling to reach the support at 4/8. However, this scenario may no longer be valid if the price breaks the resistance at 6/8 to the upside. After that, the instrument may continue growing towards 8/8.

https://roboforex.com/uploads/roboforecast/roboforex.com/99/2022/Murrey/january/18/1.png

Read more - Murrey Math Lines AUDUSD, NZDUSD

Re: Forex Technical Analysis & Forecast by RoboForex

Forex Technical Analysis & Forecast 19.01.2022

EURUSD, “Euro vs US Dollar”

After forming a new consolidation range around 1.1410 and breaking it to the downside, EURUSD has extended the correction down to 1.1315; right now, it is starting to form one more ascending structure towards 1.1494. The first target is at 1.1410.

https://roboforex.com/uploads/roboforecast/roboforex.com/99/2022/TA/january/19/EURUSDH1.png

Read more - Forex Technical Analysis & Forecast 19.01.2022

Re: Forex Technical Analysis & Forecast by RoboForex

Fibonacci Retracements Analysis 20.01.2022 (Brent, Dow Jones)

Brent

As we can see in the H4 chart, Brent has broken its previous high at 86.63. Right now, the asset is trying to fix above it and continue trading upwards to reach the post-correctional extension area between 138.2% and 161.8% fibo at 94.56 and 99.43 respectively. The key support is the low at 65.89.

https://roboforex.com/uploads/roboforecast/roboforex.com/99/2022/Fibo/january/20/BRENTH4.png

Read more - Fibonacci Retracements Analysis Brent, Dow Jones

Re: Forex Technical Analysis & Forecast by RoboForex

Japanese Candlesticks Analysis 21.01.2022 (EURUSD, USDJPY, EURGBP)

EURUSD, “Euro vs US Dollar”

As we can see in the H4 chart, the asset has formed a Hammer reversal pattern close to the support level. At the moment, EURUSD is reversing and may form a new rising impulse. In this case, the upside target may be at 1.1390. However, an alternative scenario implies that the price may fall to reach 1.1300 before resuming ascending tendency.

https://roboforex.com/uploads/roboforecast/roboforex.com/99/2022/Candles/january/21/EURUSDH4.png

Read more - Japanese Candlesticks Analysis EURUSD, USDJPY, EURGBP

Re: Forex Technical Analysis & Forecast by RoboForex

Ichimoku Cloud Analysis 24.01.2022 (NZDUSD, EURUSD, AUDUSD

NZDUSD, “New Zealand Dollar vs US Dollar”

NZDUSD is trading at 0.6708; the instrument is moving below Ichimoku Cloud, thus indicating a descending tendency. The markets could indicate that the price may test Tenkan-Sen and Kijun-Sen at 0.6755 and then resume moving downwards to reach 0.6590. Another signal in favour of a further downtrend will be a rebound from the descending channel’s upside border. However, the bearish scenario may no longer be valid if the price breaks the cloud’s upside border and fixes above 0.6835. In this case, the pair may continue growing towards 0.6925.

https://roboforex.com/uploads/roboforecast/roboforex.com/99/2022/Ichimoku/january/24/nzdusd.png

Read more - Ichimoku Cloud Analysis NZDUSD, EURUSD, AUDUSD

597 (edited by RF roboforex 2022-01-25 11:41:07)

Re: Forex Technical Analysis & Forecast by RoboForex

Murrey Math Lines 25.01.2022 (AUDUSD, NZDUSD)

AUDUSD, “Australian Dollar vs US Dollar”

As we can see in the H4 chart, AUDUSD is trading below the 200-day Moving Average, thus indicating a possible descending tendency. In this case, the price is expected to test 4/8, break it, and then continue falling to reach the support at 3/8. However, this scenario may no longer be valid if the price breaks the resistance at 6/8 to the upside. After that, the instrument may reverse and grow towards the resistance at 7/8.

https://roboforex.com/uploads/roboforecast/roboforex.com/99/2022/Murrey/january/25/1.png

Read more - Murrey Math Lines AUDUSD, NZDUSD

Re: Forex Technical Analysis & Forecast by RoboForex

Forex Technical Analysis & Forecast 26.01.2022

EURUSD, “Euro vs US Dollar”

After finishing another descending structure at 1.1263, EURUSD is growing towards 1.1315, thus forming a new consolidation range around the latter level. If later the market breaks the range to the upside, the price may form one more ascending structure towards 1.1400; if to the downside – start a new decline with the target at 1.1200.

https://roboforex.com/uploads/roboforecast/roboforex.com/99/2022/TA/january/26/EURUSDH1.png

Read more - Forex Technical Analysis & Forecast 26.01.2022

Re: Forex Technical Analysis & Forecast by RoboForex

Fibonacci Retracements Analysis 27.01.2022 (Brent, Dow Jones)

Brent

As we can see in the H4 chart, after breaking the high at 86.63 and fixing above it, Brent has tested the psychologically important level of $90 per barrel. In this case, the asset may slightly correct in the nearest future and then resume growing. The next upside targets are inside the post-correctional extension area between 138.2% and 161.8% fibo at 94.50 and 99.45 respectively. The key support is the low at 65.89.

https://roboforex.com/uploads/roboforecast/roboforex.com/99/2022/Fibo/january/27/BRENTH4.png

Read more - Fibonacci Retracements Analysis Brent, Dow Jones

600 (edited by RF roboforex 2022-01-28 12:16:54)

Re: Forex Technical Analysis & Forecast by RoboForex

Japanese Candlesticks Analysis 28.01.2022 (USDCAD, AUDUSD, USDCHF)

USDCAD, “US Dollar vs Canadian Dollar”

As we can see in the H4 chart, after forming several reversal patterns, including Hanging Man, close to the resistance level, USDCAD is reversing and may form a new correctional impulse. In this case, the downside target may be the support area at 1.2655. However, an alternative scenario implies that the asset may grow to reach 1.2800 without any pullbacks.

https://roboforex.com/uploads/roboforecast/roboforex.com/99/2022/Candles/january/28/USDCADH4.png

Read more - Japanese Candlesticks Analysis USDCAD, AUDUSD, USDCHF

Posts: 576 to 600 of 1,098

Pages Previous 1 22 23 24 25 26 44 Next

You must login or register to post a reply

Forex Software → Market Analysis → Forex Technical Analysis & Forecast by RoboForex

Similar topics in this forum