forex software

Create and Test Forex Strategies

forex software

Skip to forum content

Forex Software

Create and Test Forex Strategies

You are not logged in. Please login or register.


(Page 23 of 44)

Forex Software → Market Analysis → Forex Technical Analysis & Forecast by RoboForex

Pages Previous 1 21 22 23 24 25 44 Next

You must login or register to post a reply

RSS topic feed

Posts: 551 to 575 of 1,098

Re: Forex Technical Analysis & Forecast by RoboForex

Fibonacci Retracements Analysis 18.11.2021 (Brent, Dow Jones)
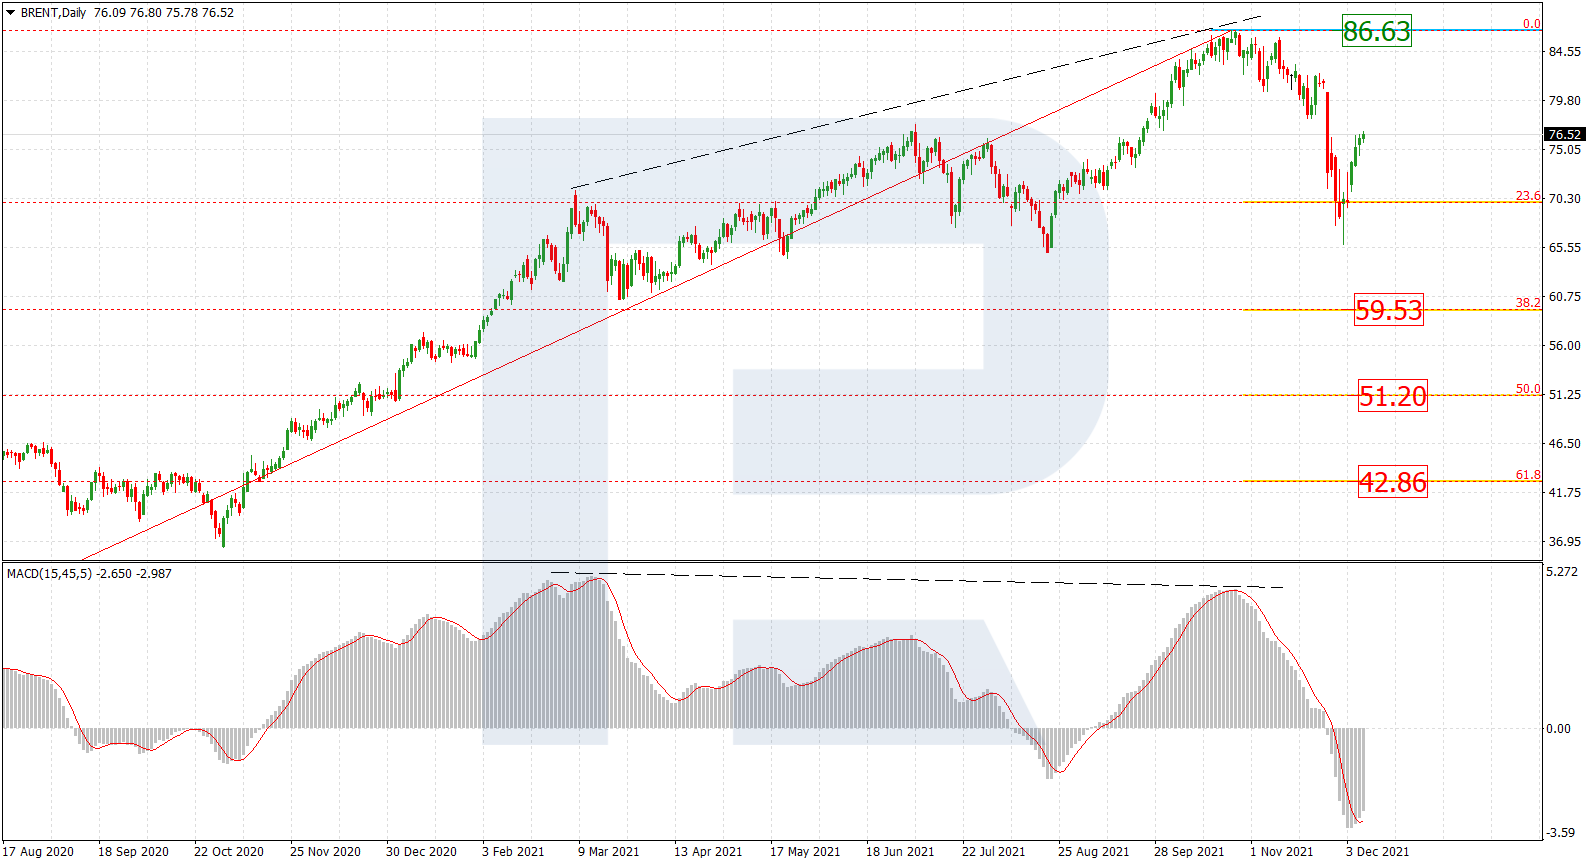
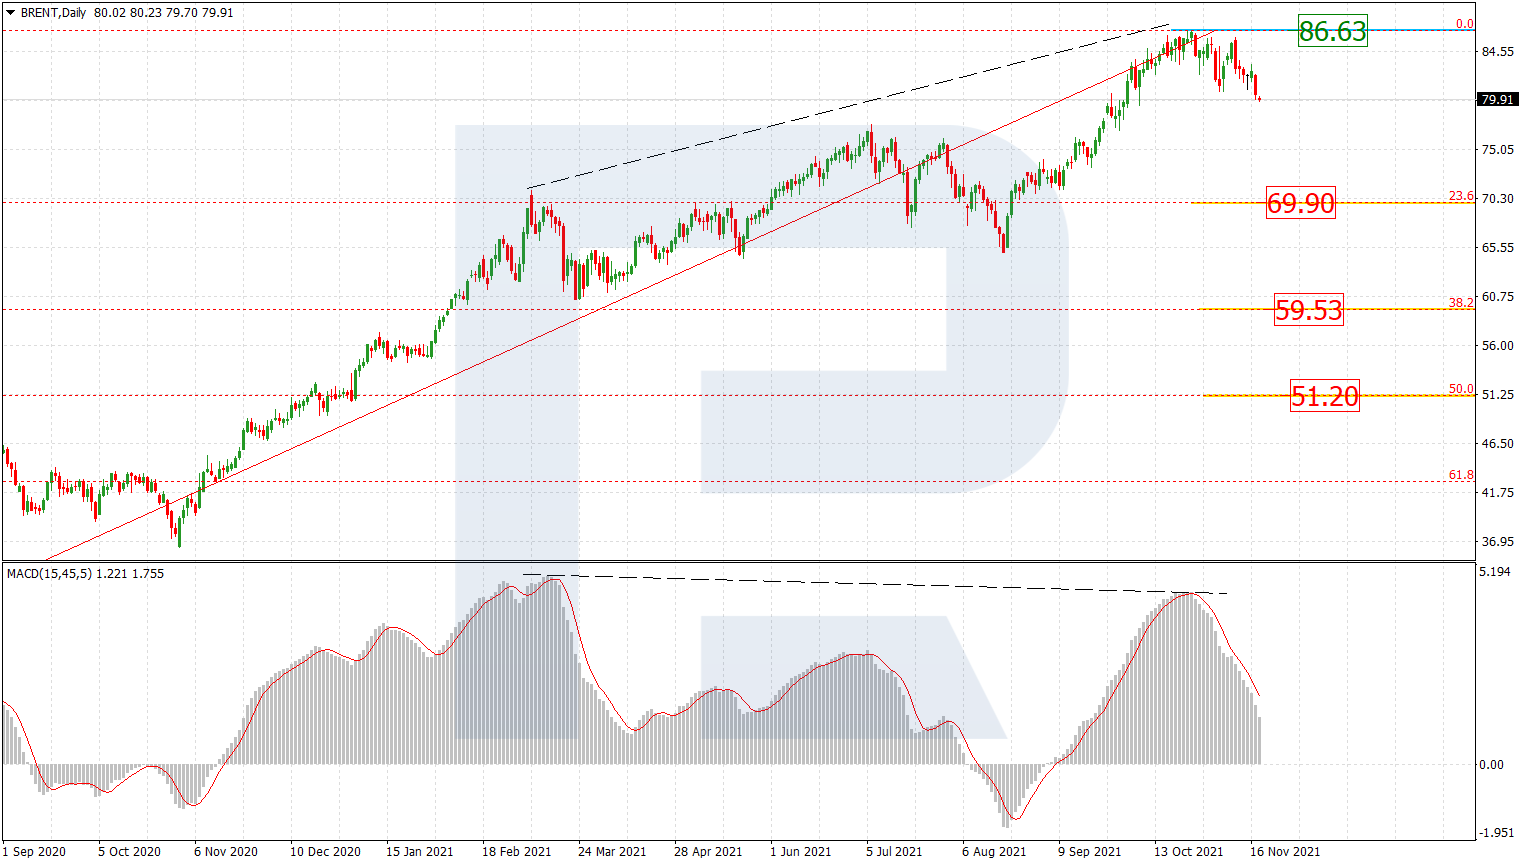
Brent

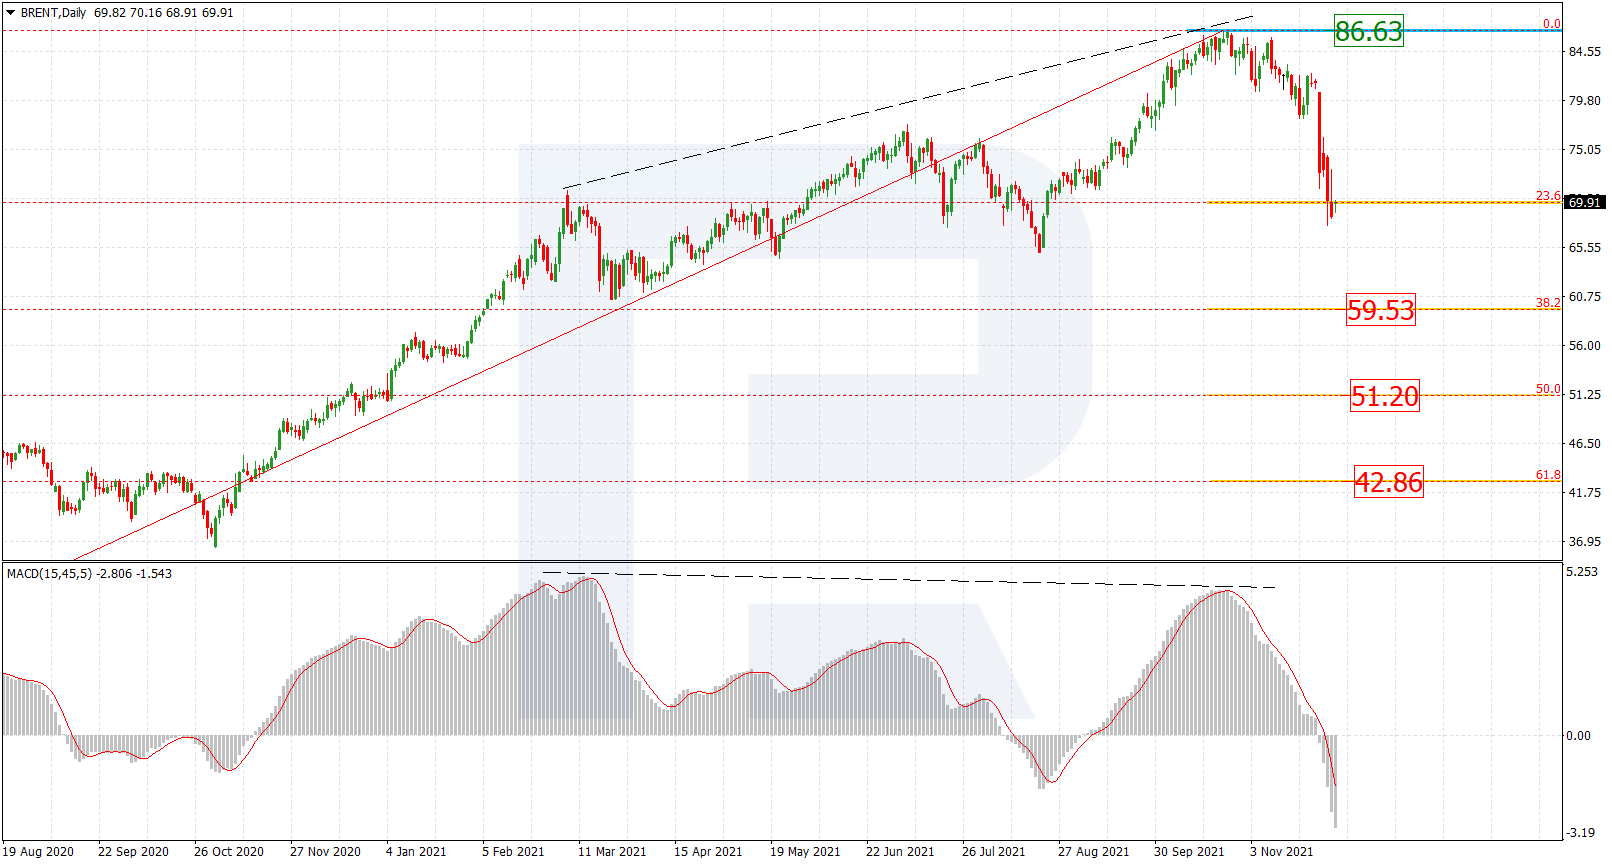
РAs we can see in the daily chart, Brent is falling and this descending movement may be both a pullback and a new “bearish” phase. The chart also allows to evaluate this decline for the long-term. The downside targets may be 23.6%, 38.2%, and 50.0% fibo at 69.90, 59.53, and 51.20 respectively. The key resistance here is the high at 86.63.

https://roboforex.com/uploads/roboforecast/roboforex.com/99/2021/Fibo/november/18/BRENTDaily.png

Read more - Fibonacci Retracements Analysis Brent, Dow Jones

Re: Forex Technical Analysis & Forecast by RoboForex

Japanese Candlesticks Analysis 19.11.2021 (EURUSD, USDJPY, EURGBP)

EURUSD, “Euro vs US Dollar”

As we can see in the H4 chart, the asset has formed several reversal patterns, including Hammer and Inverted Hammer, close to the support level. At the moment, EURUSD may reverse and start a new ascending impulse. In this case, the upside correctional target may be at 1.1400. Later, the market may rebound from the resistance area and resume the descending tendency. However, an alternative scenario implies that the price may continue falling to reach 1.1260 without correcting towards the resistance area.

https://roboforex.com/uploads/roboforecast/roboforex.com/99/2021/Candles/november/19/EURUSDH4.png

Read more - Japanese Candlesticks Analysis EURUSD, USDJPY, EURGBP

Re: Forex Technical Analysis & Forecast by RoboForex

Ichimoku Cloud Analysis 22.11.2021 (GBPUSD, USDCAD, NZDUSD)

GBPUSD, “Great Britain Pound vs US Dollar”

GBPUSD is trading at 1.3438; the instrument is moving below Ichimoku Cloud, thus indicating a descending tendency. The markets could indicate that the price may test at Tenkan-Sen and Kijun-Sen 1.3445 and then resume moving downwards to reach 1.3225. Another signal in favour of a further downtrend will be a rebound from the descending channel’s upside border. However, the bearish scenario may no longer be valid if the price breaks the cloud’s upside border and fixes above 1.3555. In this case, the pair may continue growing towards 1.3655. To confirm further decline, the asset must break the downside border of the Triangle pattern and fix below 1.3395.

https://roboforex.com/uploads/roboforecast/roboforex.com/99/2021/Ichimoku/november/22/gbpusd.png

Read more - Ichimoku Cloud Analysis GBPUSD, USDCAD, NZDUSD

Re: Forex Technical Analysis & Forecast by RoboForex

Murrey Math Lines 23.11.2021 (AUDUSD, NZDUSD)

AUDUSD, “Australian Dollar vs US Dollar”

As we can see in the H4 chart, AUDUSD is trading within the “oversold area”. In this case, the price is expected to test -1/8, break it, and then correct upwards to reach the resistance at 1/8. However, this scenario may no longer be valid if the price breaks -2/8 to the downside. After that, the lines in the chart will be redrawn, thus helping us to define new downside targets.

https://roboforex.com/uploads/roboforecast/roboforex.com/99/2021/Murrey/november/23/1.png

Read more - Murrey Math Lines AUDUSD, NZDUSD

Re: Forex Technical Analysis & Forecast by RoboForex

Forex Technical Analysis & Forecast 24.11.2021

EURUSD, “Euro vs US Dollar”

After completing the correctional structure at 1.1274, EURUSD is expected to fall towards 1.1197. Later, the market may start another correction with the target at 1.1274.

https://roboforex.com/uploads/roboforecast/roboforex.com/99/2021/TA/november/24/EURUSDH1.png

Read more - Forex Technical Analysis & Forecast 24.11.2021

Re: Forex Technical Analysis & Forecast by RoboForex

Fibonacci Retracements Analysis 25.11.2021 (Brent, Dow Jones)

Brent

As we can see in the H4 chart, after finishing the correctional decline at 38.2% fibo, Brent is growing and this ascending movement may continue to break the high at 86.83. However, another scenario implies a new wave to the downside to reach 50.0% and 61.8% fibo at 75.83 and 73.31 respectively.

https://roboforex.com/uploads/roboforecast/roboforex.com/99/2021/Fibo/november/25/BRENTH4.png

Read more - Fibonacci Retracements Analysis Brent, Dow Jones

Re: Forex Technical Analysis & Forecast by RoboForex

Japanese Candlesticks Analysis 26.11.2021 (USDCAD, AUDUSD, USDCHF)

USDCAD, “US Dollar vs Canadian Dollar”

As we can see in the H4 chart, after forming several an Engulfing reversal pattern close to the support level, USDCAD is reversing in the form of a new rising impulse. In this case, the upside target may be the resistance area at 1.2770. However, an alternative scenario implies that the asset may correct to reach 1.2670 before resuming its ascending tendency.

https://roboforex.com/uploads/roboforecast/roboforex.com/99/2021/Candles/november/26/USDCADH4.png

Read more - Japanese Candlesticks Analysis USDCAD, AUDUSD, USDCHF

Re: Forex Technical Analysis & Forecast by RoboForex

Ichimoku Cloud Analysis 29.11.2021 (EURUSD, USDCAD, GBPJPY)

EURUSD, “Euro vs US Dollar”

EURUSD is trading at 1.1281; the instrument is moving below Ichimoku Cloud, thus indicating a descending tendency. The markets could indicate that the price may test the cloud’s downside border at 1.1285 and then resume moving downwards to reach 1.1105. Another signal in favour of a further downtrend will be a rebound from the descending channel’s upside border. However, the bearish scenario may no longer be valid if the price breaks the cloud’s upside border and fixes above 1.1375. In this case, the pair may continue growing towards 1.1465.

https://roboforex.com/uploads/roboforecast/roboforex.com/99/2021/Ichimoku/november/29/eurusd.png

Read more - Ichimoku Cloud Analysis EURUSD, USDCAD, GBPJPY

559 (edited by RF roboforex 2021-11-30 12:33:02)

Re: Forex Technical Analysis & Forecast by RoboForex

Murrey Math Lines 30.11.2021 (AUDUSD, NZDUSD)

AUDUSD, “Australian Dollar vs US Dollar”

In the H4 chart, AUDUSD is trading below the 200-day Moving Average, thus indicating a descending tendency. In this case, the price is expected to break 1/8 and then fall to reach the support at 0/8. However, this scenario may no longer be valid if the price breaks 2/8 to the upside. After that, the instrument may grow towards 3/8.

https://roboforex.com/uploads/roboforecast/roboforex.com/99/2021/Murrey/november/30/1.png

Read more - Murrey Math Lines AUDUSD, NZDUSD

Re: Forex Technical Analysis & Forecast by RoboForex

Forex Technical Analysis & Forecast 01.12.2021

EURUSD, “Euro vs US Dollar”

After completing the descending impulse at 1.1239, EURUSD is correcting towards 1.1347. Later, the market may resume falling to break 1.1230 and then continue trading downwards with the target at 1.1133.

https://roboforex.com/uploads/roboforecast/roboforex.com/99/2021/TA/december/01/EURUSDH1.png

Read more - Forex Technical Analysis & Forecast 01.12.2021

Re: Forex Technical Analysis & Forecast by RoboForex

Fibonacci Retracements Analysis 02.12.2021 (Brent, Dow Jones)

Brent

As we can see in the daily chart, Brent has reached the long-term 23.0% fibo after divergence on MACD. The fact that “bears” were so active implies that they intend to continue the descending tendency. The next downside targets are 38.2%, 50.0%, and 61.8% fibo at 59.53, 51.20, and 42.86 respectively. The key resistance is the high at 86.63.

https://roboforex.com/uploads/roboforecast/roboforex.com/99/2021/Fibo/december/02/BRENTDaily.png

Read more - Fibonacci Retracements Analysis (Brent, Dow Jones

Re: Forex Technical Analysis & Forecast by RoboForex

Japanese Candlesticks Analysis 03.12.2021 (XAUUSD, NZDUSD, GBPUSD)

XAUUSD, “Gold vs US Dollar”

As we can see in the H4 chart, the asset is correcting. After forming an Inverted Hammer reversal pattern not far from the support level, XAUUSD may reverse and form a new rising impulse. In this case, the upside target may be the resistance area at 1795.00. At the same time, an opposite scenario implies that the price may fall towards 1750.00 first and then resume trading upwards.

https://roboforex.com/uploads/roboforecast/roboforex.com/99/2021/Candles/december/03/XAUUSDH4.png

Read more - Japanese Candlesticks Analysis XAUUSD, NZDUSD, GBPUSD

Re: Forex Technical Analysis & Forecast by RoboForex

Fibonacci Retracements Analysis 06.12.2021 (GOLD, USDCHF)

XAUUSD, “Gold vs US Dollar”

In the H4 chart, after growing and reaching 50.0% fibo, XAUUSD is correcting downwards. Convergence on MACD indicates that the correction may be over soon. In this case, the next upside targets may be 61.8% and 76.0% fibo at 1908.00 and 1969.50 respectively. The key support is the low at 1638.76.

https://roboforex.com/uploads/roboforecast/roboforex.com/99/2021/Fibo/december/06/XAUUSDH4.png

Read more - Fibonacci Retracements Analysis GOLD, USDCHF

Re: Forex Technical Analysis & Forecast by RoboForex

Murrey Math Lines 07.12.2021 (AUDUSD, NZDUSD)

AUDUSD, “Australian Dollar vs US Dollar”

In the H4 chart, AUDUSD is trading inside the “oversold area”. In this case, the price is expected to test 0/8, break it, and then grow to reach the resistance at 2/8. However, this scenario may no longer be valid if the price breaks the support at -1/8 to the downside. After that, the instrument may continue falling towards -2/8.

https://roboforex.com/uploads/roboforecast/roboforex.com/99/2021/Murrey/december/07/1.png

Read more - Murrey Math Lines AUDUSD, NZDUSD

565 (edited by RF roboforex 2021-12-08 10:37:14)

Re: Forex Technical Analysis & Forecast by RoboForex

Forex Technical Analysis & Forecast 08.12.2021

EURUSD, “Euro vs US Dollar”

EURUSD has completed the descending wave at 1.1226; right now, it is correcting towards 1.1296 and may later form a new descending structure to return to 1.1226. After that, the instrument may break this level and continue trading downwards with the target at 1.1177.

https://roboforex.com/uploads/roboforecast/roboforex.com/99/2021/TA/december/08/EURUSDH1.png

Read more - Forex Technical Analysis & Forecast 08.12.2021

Re: Forex Technical Analysis & Forecast by RoboForex

Fibonacci Retracements Analysis 09.12.2021 (Brent, Dow Jones)

Brent

As we can see in the daily chart, Brent is correcting upwards after reaching the long-term 23.0% fibo and divergence on MACD. If this correctional uptrend fails to break the high at 86.63, the next downside targets may be 38.2%, 50.0%, and 61.8% fibo at 59.53, 51.20, and 42.86 respectively.

https://roboforex.com/uploads/roboforecast/roboforex.com/99/2021/Fibo/december/09/BRENTDaily.png

Read more - Fibonacci Retracements Analysis Brent, Dow Jones

Re: Forex Technical Analysis & Forecast by RoboForex

Japanese Candlesticks Analysis 10.12.2021 (EURUSD, USDJPY, EURGBP)

EURUSD, “Euro vs US Dollar”

As we can see in the H4 chart, the asset has formed a Harami reversal pattern close to the resistance level. At the moment, after a slight pullback, EURUSD may reverse and resume falling. In this case, the downside target may be at 1.1195. However, an alternative scenario implies that the price may correct to reach 1.1350 before resuming its descending tendency.

https://roboforex.com/uploads/roboforecast/roboforex.com/99/2021/Candles/december/10/EURUSDH4.png

Read more - Japanese Candlesticks Analysis EURUSD, USDJPY, EURGBP

Re: Forex Technical Analysis & Forecast by RoboForex

Ichimoku Cloud Analysis 13.12.2021 (EURUSD, NZDUSD, AUDCAD)

EURUSD, “Euro vs US Dollar”

EURUSD is trading at 1.1288; the instrument is moving inside Ichimoku Cloud, thus indicating a sideways tendency. The markets could indicate that the price may test the cloud’s upside border at 1.1295 and then resume moving downwards to reach 1.1125. Another signal in favour of a further downtrend will be a rebound from the upside border of the Triangle pattern. However, the bearish scenario may no longer be valid if the price breaks the cloud’s upside border and fixes above 1.1345. In this case, the pair may continue growing towards 1.1435. To confirm further decline, the asset must break the support level and fix below 1.1205. This movement will indicate a breakout of the pattern’s downside border.

https://roboforex.com/uploads/roboforecast/roboforex.com/99/2021/Ichimoku/december/13/eurusd.png

Read more - Ichimoku Cloud Analysis EURUSD, NZDUSD, AUDCAD

Re: Forex Technical Analysis & Forecast by RoboForex

Murrey Math Lines 14.12.2021 (AUDUSD, NZDUSD)

AUDUSD, “Australian Dollar vs US Dollar”

In the H4 chart, AUDUSD is approaching the “oversold area” again. In this case, the price is expected to test 0/8, rebound from it, and then grow to reach the resistance at 2/8. However, this scenario may no longer be valid if the price breaks the support at 0/8 to the downside. After that, the instrument may continue falling towards -1/8.

https://roboforex.com/uploads/roboforecast/roboforex.com/99/2021/Murrey/december/14/1.png

Read more - Murrey Math Lines AUDUSD, NZDUSD

Re: Forex Technical Analysis & Forecast by RoboForex

Forex Technical Analysis & Forecast 15.12.2021

EURUSD, “Euro vs US Dollar”

EURUSD has completed another descending wave at 1.1260; right now, it is consolidating around this level. Possibly, the pair may break the range to the downside and reach 1.1210. Later, the market may start a new correction towards 1.1270 and then resume trading downwards with the target at 1.1180.

https://roboforex.com/uploads/roboforecast/roboforex.com/99/2021/TA/december/15/EURUSDH1.png

Read more - Forex Technical Analysis & Forecast 15.12.2021

571 (edited by RF roboforex 2021-12-17 10:04:44)

Re: Forex Technical Analysis & Forecast by RoboForex

Ichimoku Cloud Analysis 16.12.2021 (AUDUSD, USDCHF, NZDUSD)

AUDUSD, “Australian Dollar vs US Dollar”

AUDUSD is trading at 0.7162; the instrument is moving above Ichimoku Cloud, thus indicating an ascending tendency. The markets could indicate that the price may test the cloud’s upside border at 0.7120 and then resume moving upwards to reach 0.7275. Another signal in favour of a further uptrend will be a rebound from the rising channel’s downside border. However, the bullish scenario may no longer be valid if the price breaks the cloud’s downside border and fixes below 0.7065. In this case, the pair may continue falling towards 0.6975.

https://roboforex.com/uploads/roboforecast/roboforex.com/99/2021/Ichimoku/december/16/audusd.png

Read more - Ichimoku Cloud Analysis AUDUSD, USDCHF, NZDUSD

Re: Forex Technical Analysis & Forecast by RoboForex

Japanese Candlesticks Analysis 17.12.2021 (USDCAD, AUDUSD, USDCHF)

USDCAD, “US Dollar vs Canadian Dollar”

As we can see in the H4 chart, after forming several reversal patterns, including Inverted Hammer, close to the support level, USDCAD may reverse in the form of another rising wave. In this case, the upside target may be the resistance area at 1.2900. However, an alternative scenario implies that the asset may correct to reach 1.2740 first and then resume trading upwards.

https://roboforex.com/uploads/roboforecast/roboforex.com/99/2021/Candles/december/17/USDCADH4.png

Read more - Japanese Candlesticks Analysis USDCAD, AUDUSD, USDCHF

Re: Forex Technical Analysis & Forecast by RoboForex

Ichimoku Cloud Analysis 20.12.2021 (EURUSD, AUDUSD, BRENT)

EURUSD, “Euro vs US Dollar”

EURUSD is trading at 1.1253; the instrument is moving below Ichimoku Cloud, thus indicating a descending tendency. The markets could indicate that the price may test Tenkan-Sen and Kijun-Sen at 1.1265 and then resume moving downwards to reach 1.1145. Another signal in favour of a further downtrend will be a rebound from the downside border of the Triangle pattern. However, the bearish scenario may no longer be valid if the price breaks the cloud’s upside border and fixes above 1.1325. In this case, the pair may continue growing towards 1.1415. To confirm further decline, the asset must break the support level and fix below 1.1205.

https://roboforex.com/uploads/roboforecast/roboforex.com/99/2021/Ichimoku/december/20/eurusd.png

Read more - Ichimoku Cloud Analysis EURUSD, AUDUSD, BRENT

Re: Forex Technical Analysis & Forecast by RoboForex

Murrey Math Lines 21.12.2021 (AUDUSD, NZDUSD)

AUDUSD, “Australian Dollar vs US Dollar”

As we can see in the H4 chart, AUDUSD has rebounded from 0/8. In this case, the price is expected to grow and reach the resistance at 2/8. However, this scenario may no longer be valid if the price breaks the support at 0/8 to the downside. After that, the instrument may continue falling towards -1/8.

https://roboforex.com/uploads/roboforecast/roboforex.com/99/2021/Murrey/december/21/1.png

Read more - Murrey Math Lines AUDUSD, NZDUSD

Re: Forex Technical Analysis & Forecast by RoboForex

Forex Technical Analysis & Forecast 22.12.2021

EURUSD, “Euro vs US Dollar”

EURUSD continues falling. Possibly, today the pair may break 1.1262 and then reach 1.1230. After that, the instrument may start a new growth to test 1.1262 from below and then resume trading downwards with the target at 1.1221.

https://roboforex.com/uploads/roboforecast/roboforex.com/99/2021/TA/december/22/EURUSDH1.png

Read more - Forex Technical Analysis & Forecast 22.12.2021

Posts: 551 to 575 of 1,098

Pages Previous 1 21 22 23 24 25 44 Next

You must login or register to post a reply

Forex Software → Market Analysis → Forex Technical Analysis & Forecast by RoboForex

Similar topics in this forum