Ichimoku Cloud Analysis 03.04.2024 (XAUUSD, GBPUSD, USDCHF)
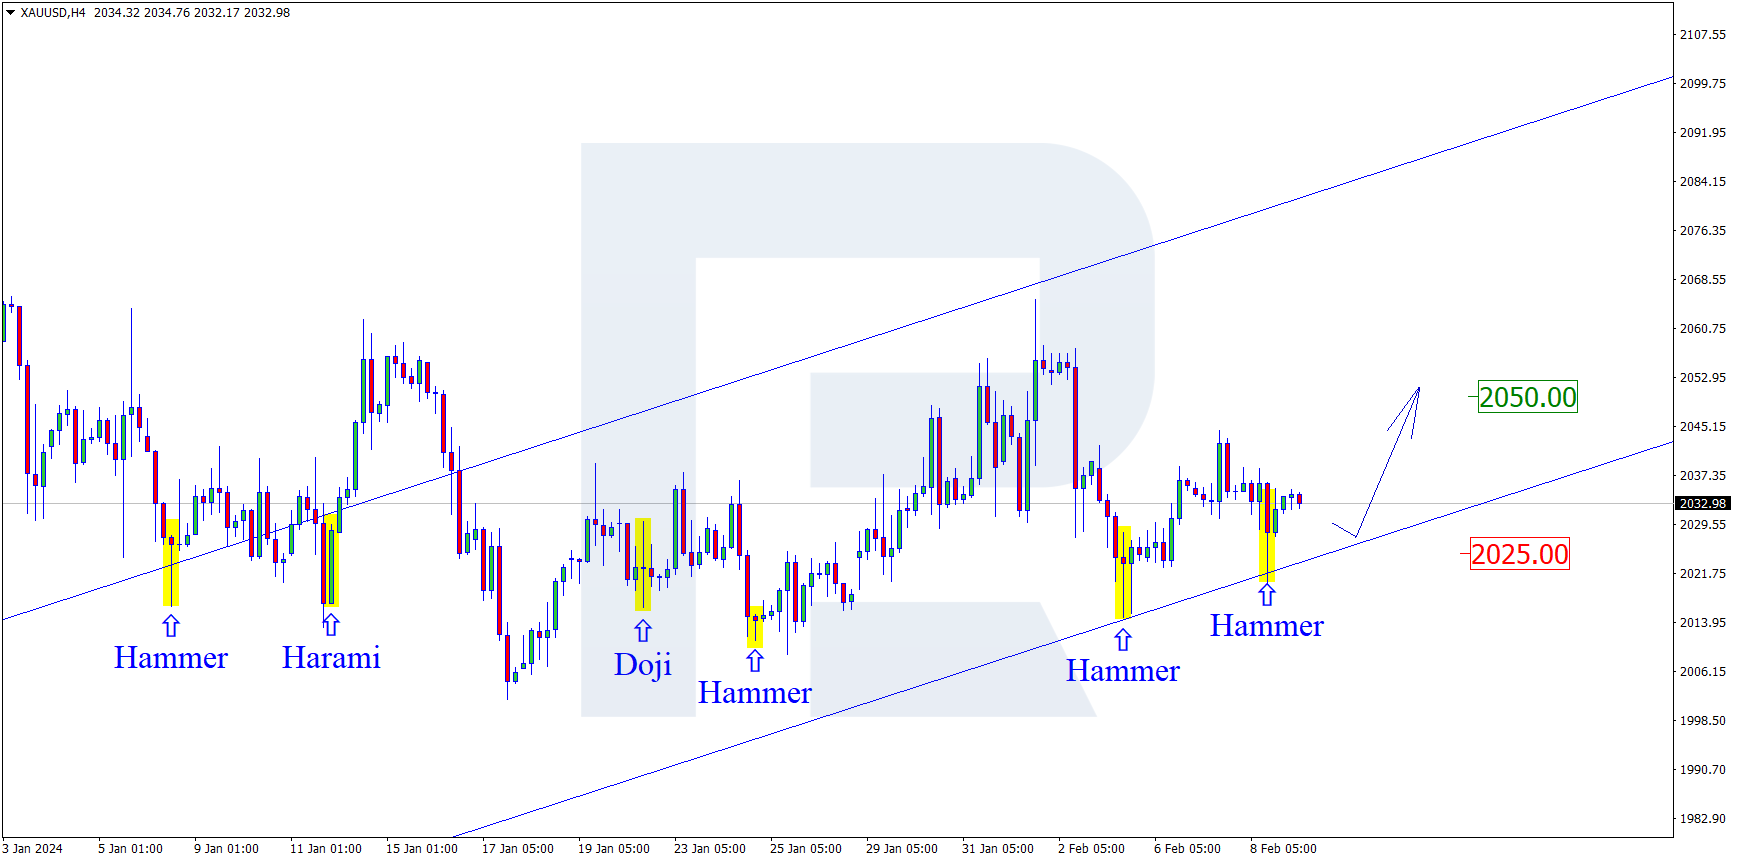
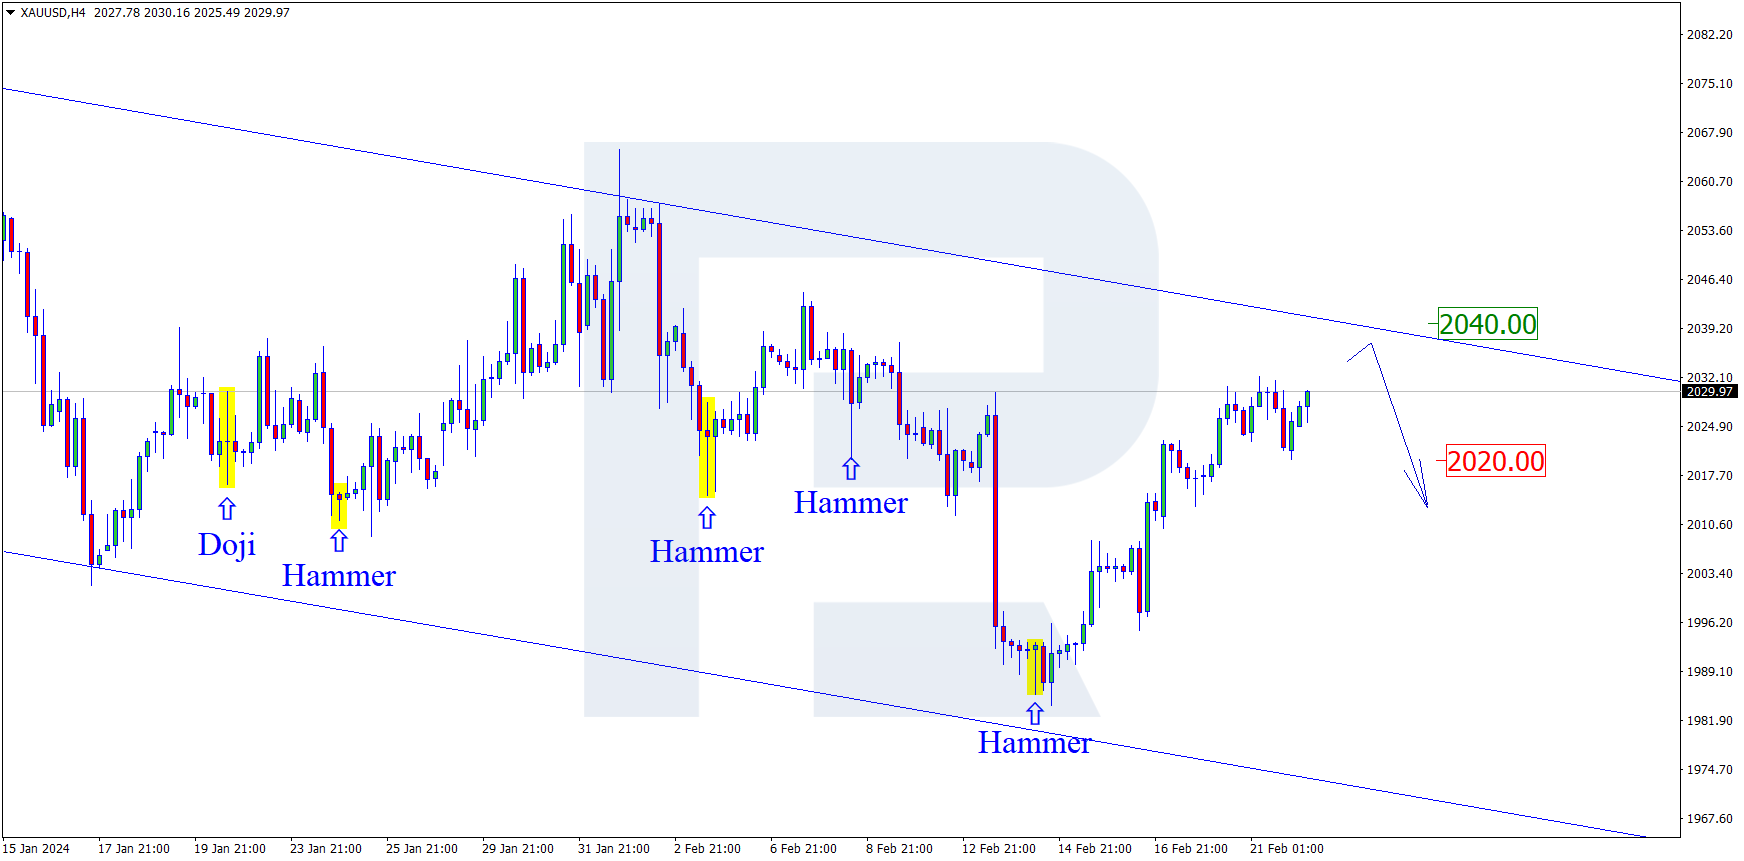
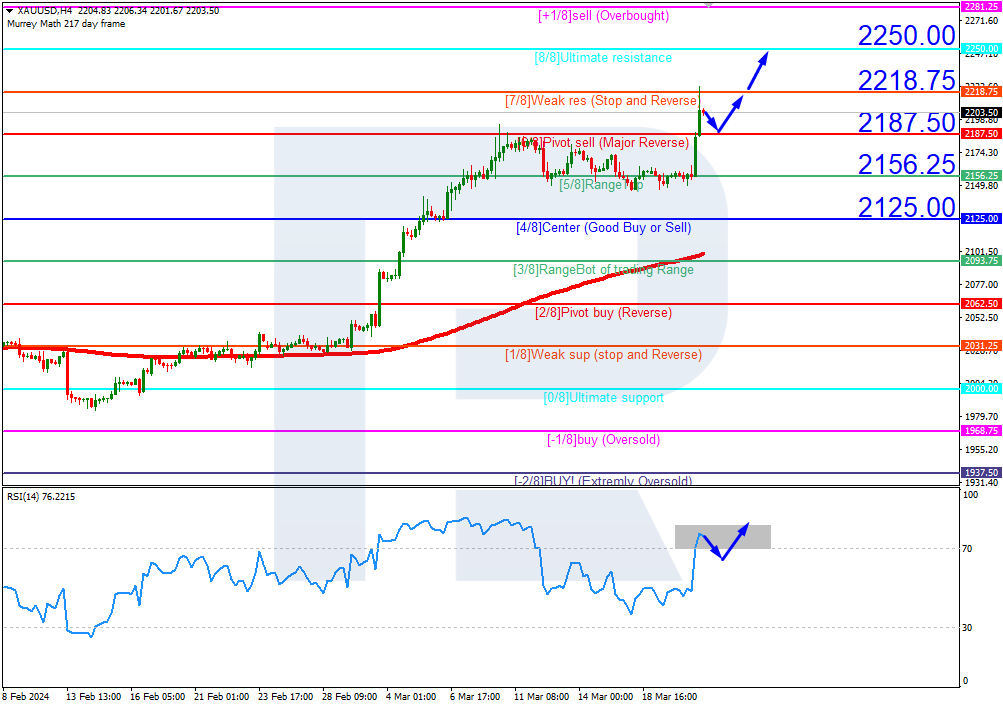
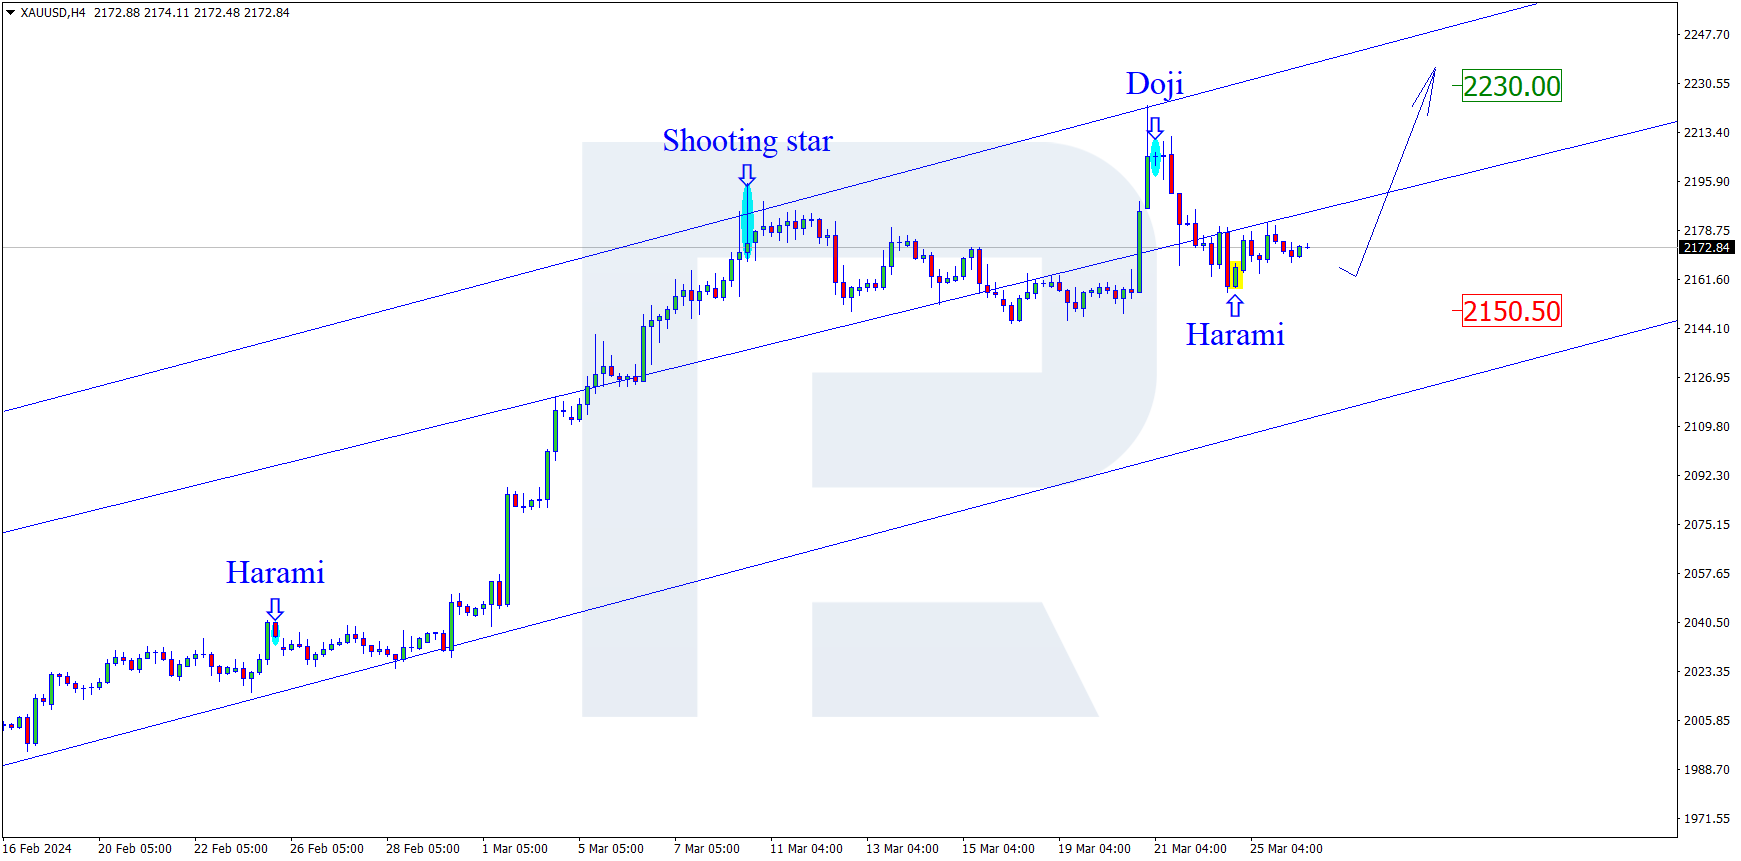
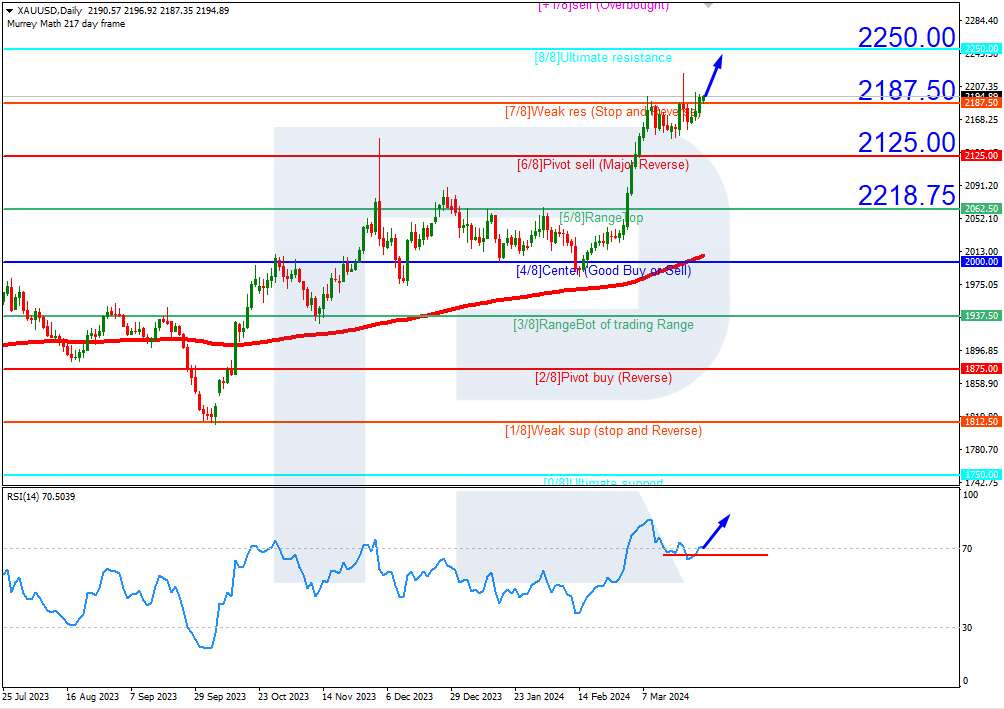
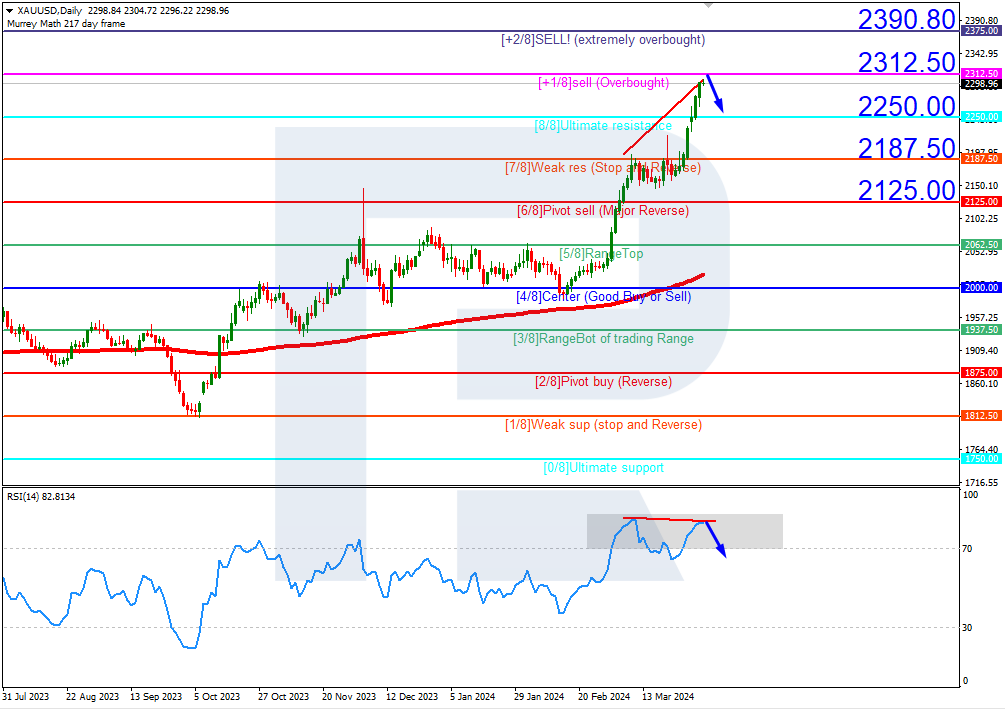
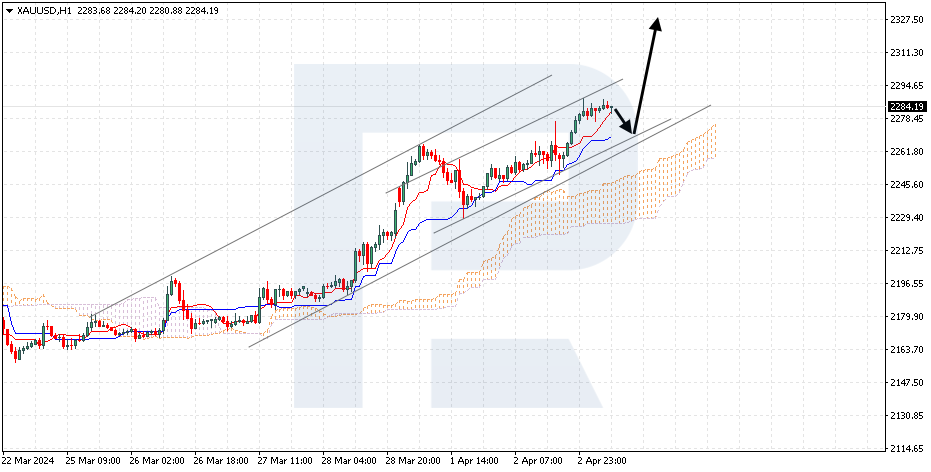
XAUUSD, “Gold vs US Dollar”
Gold has gained a foothold above the signal lines of the indicator. The instrument is going above the Ichimoku Cloud, which suggests an uptrend. A test of the Kijun-Sen line at 2265 is expected, followed by a rise to 2325. An additional signal confirming the rise could be a rebound from the lower boundary of the bullish channel. The scenario could be cancelled by a breakout of the lower boundary of the Cloud, with the price securing below 2215, which will signal a further decline to 2175.
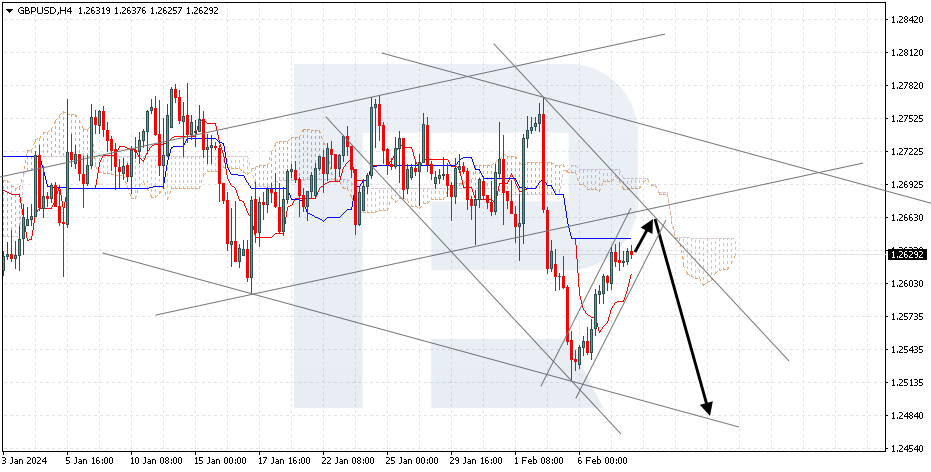
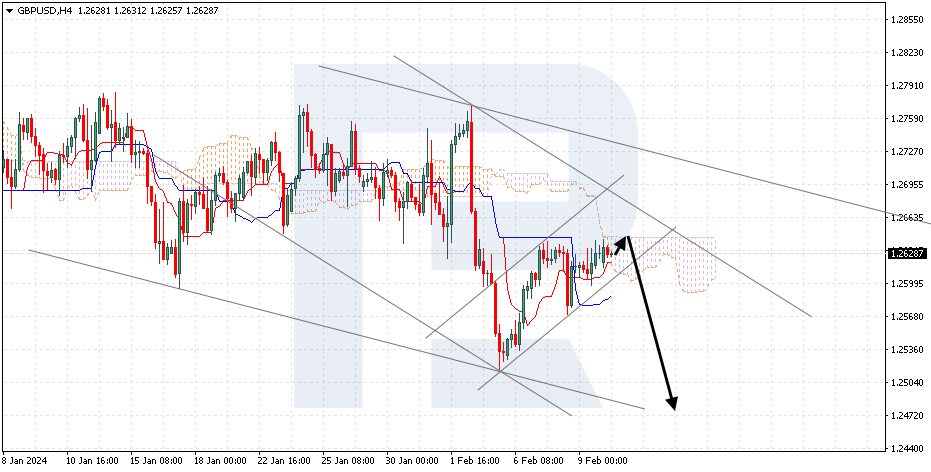
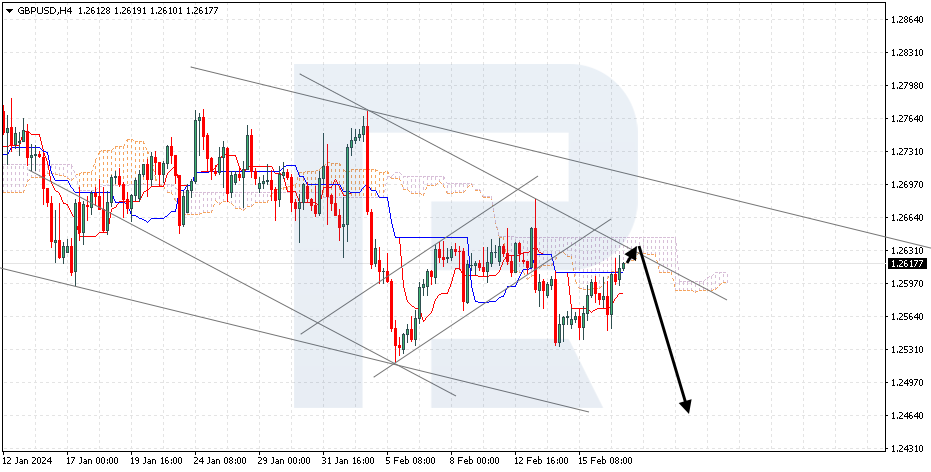
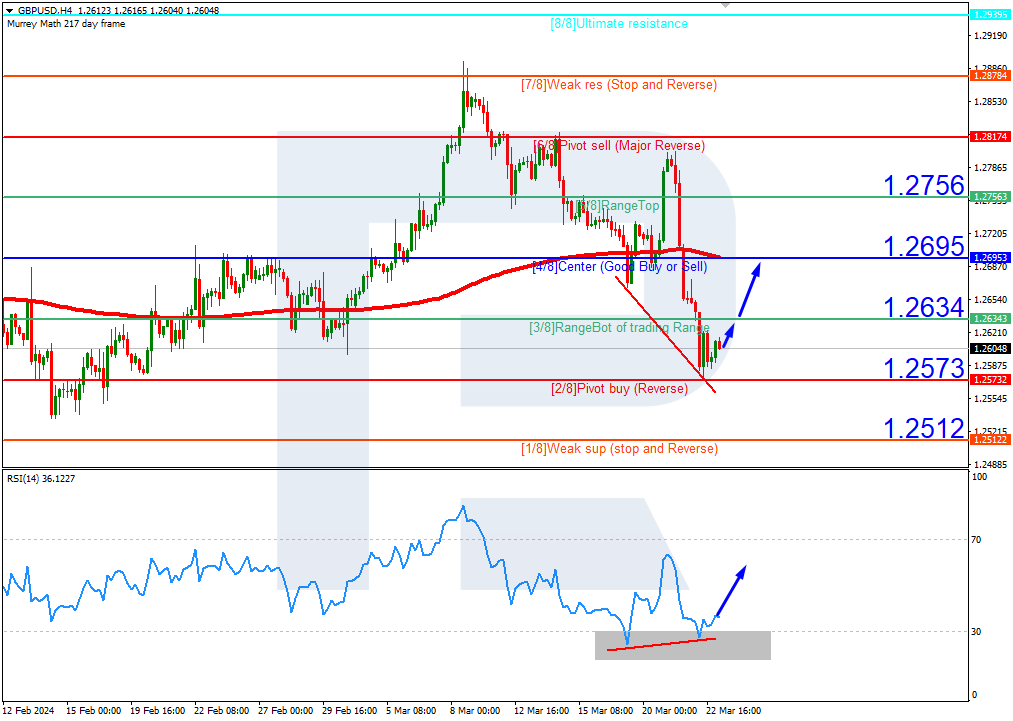
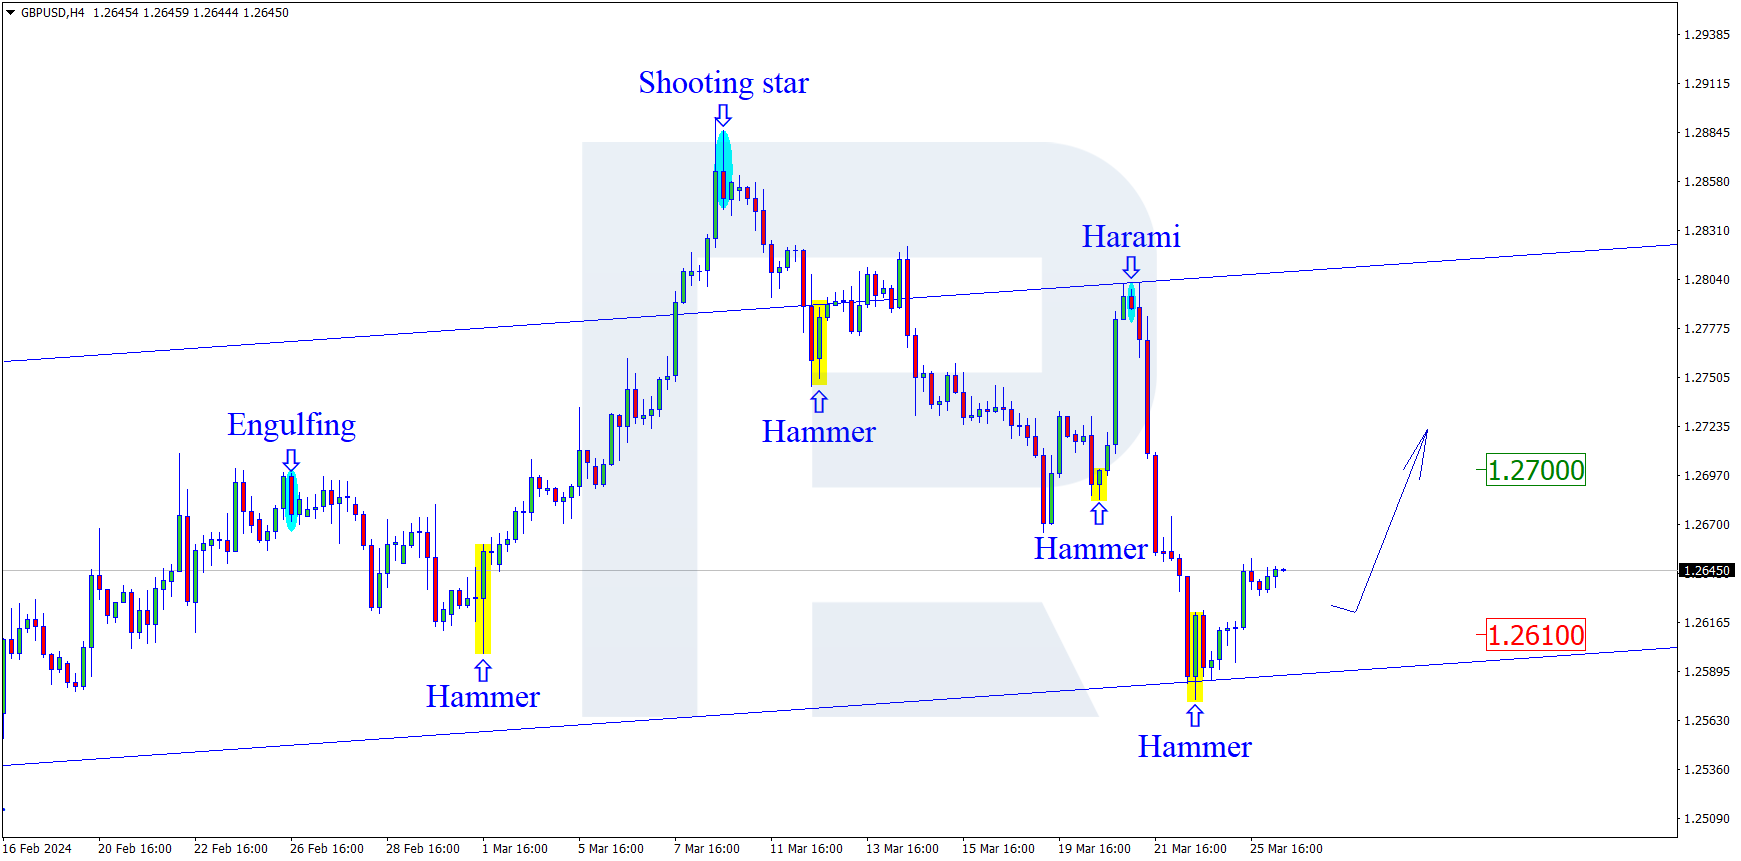
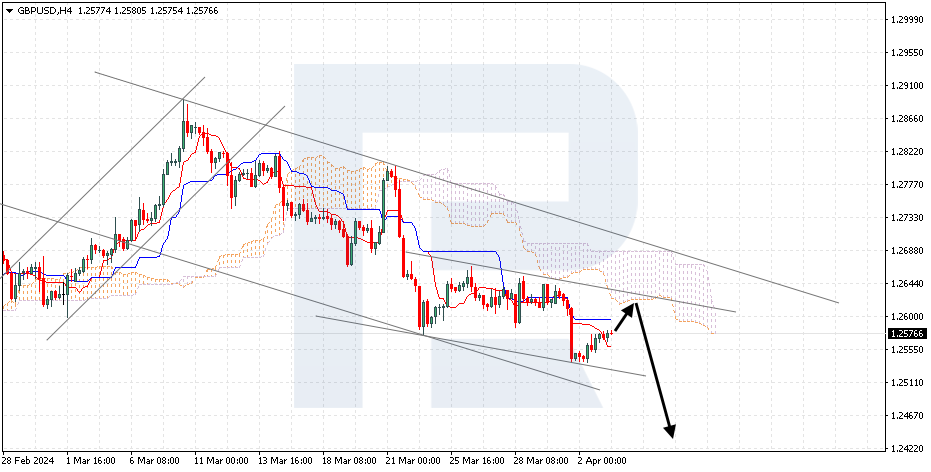
GBPUSD, “Great Britain Pound vs US Dollar”
GBPUSD is correcting following a rebound from the lower boundary of a bearish channel. The pair is going below the Ichimoku Cloud, which suggests a downtrend. A test of the lower boundary of the Cloud at 1.2605 is expected, followed by a decline to 1.2455. An additional signal confirming the decline could be a rebound from the upper boundary of the descending channel. The scenario can be cancelled by a breakout of the Cloud’s upper boundary, with the price securing above 1.2705, indicating further growth to 1.2805.
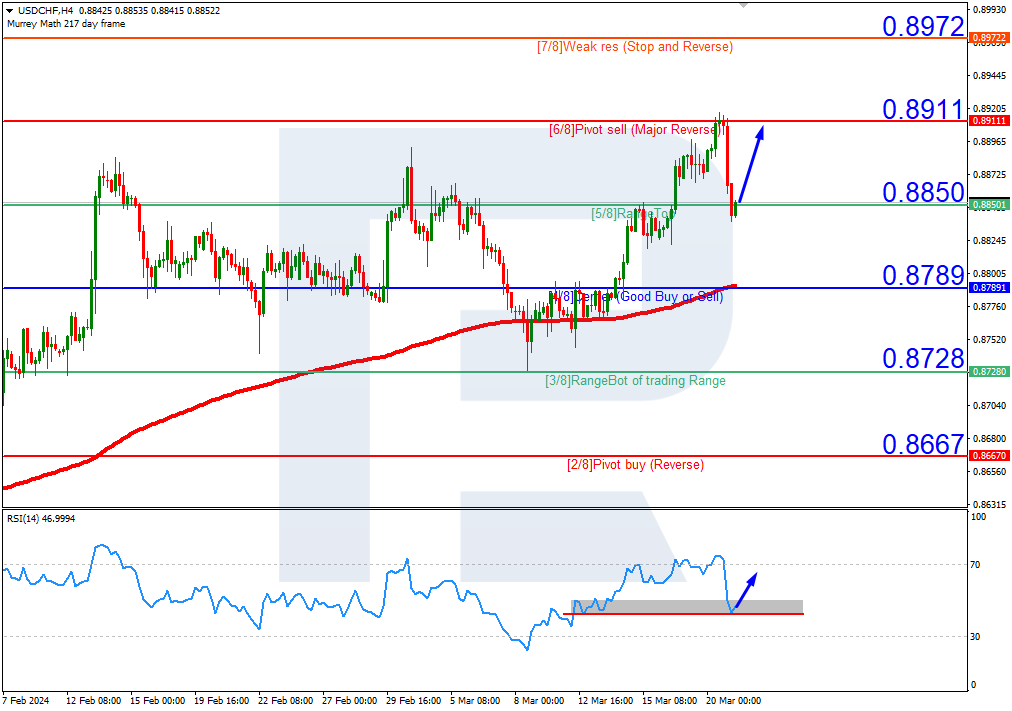
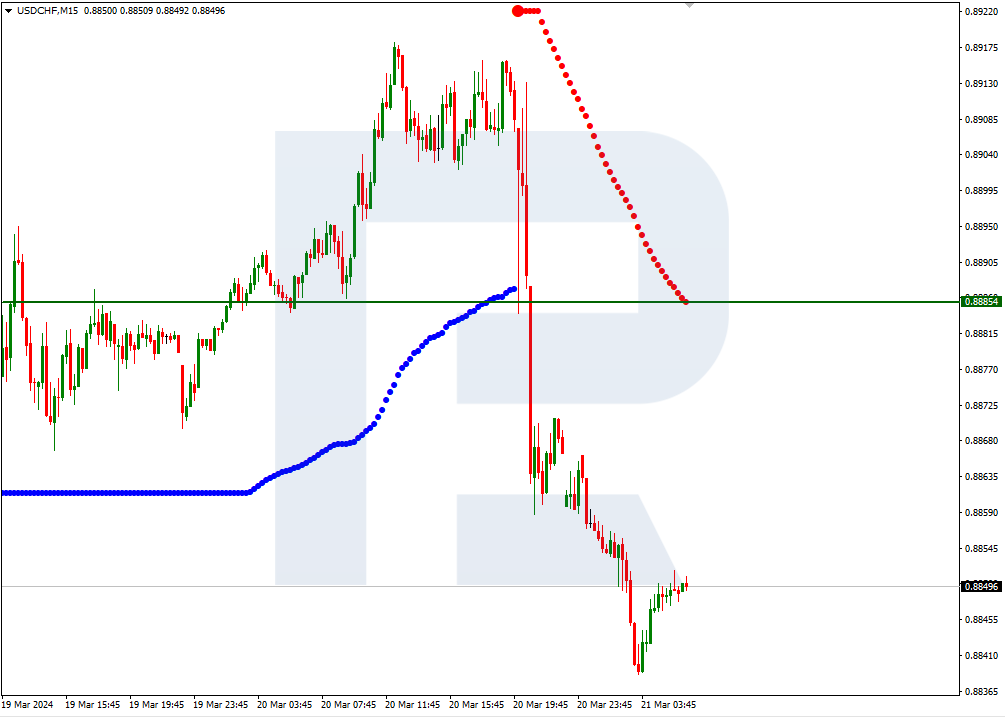
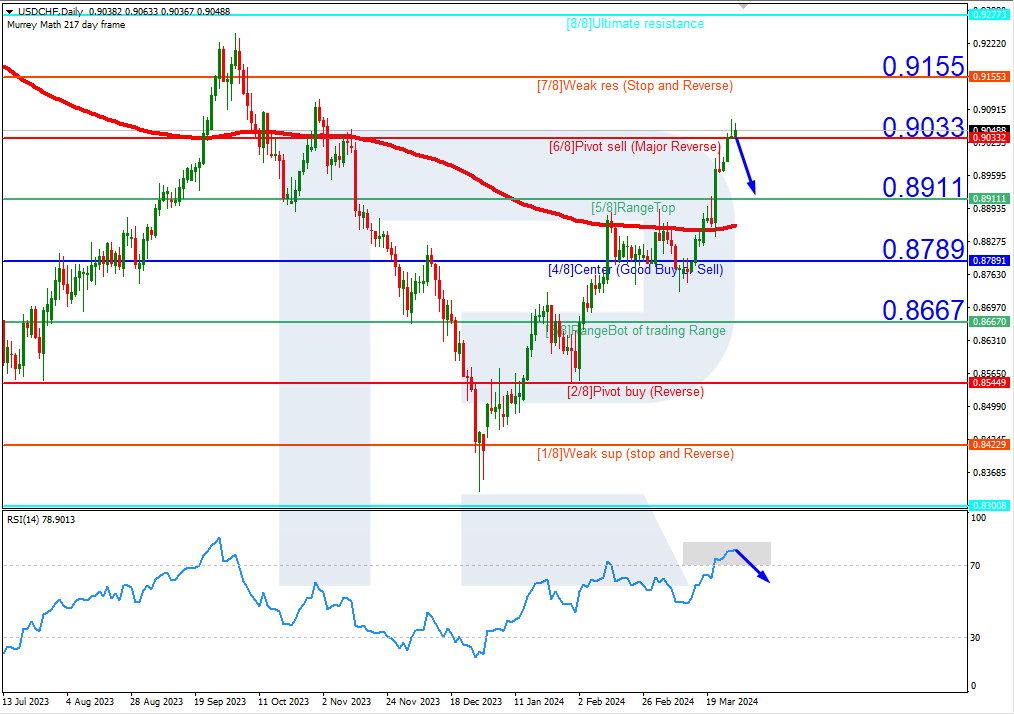
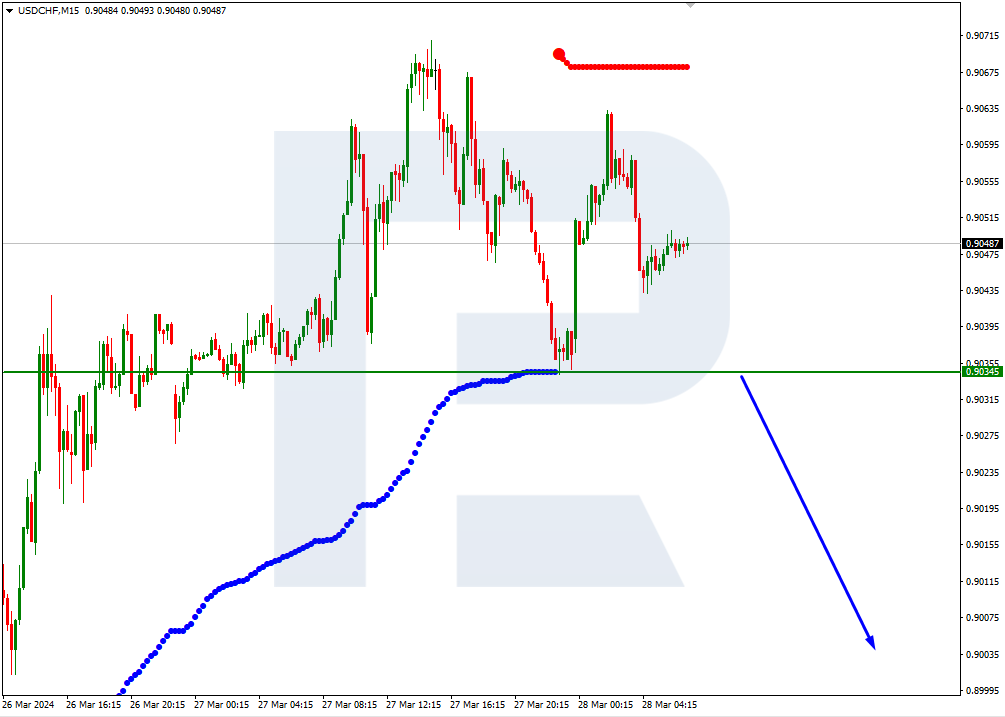
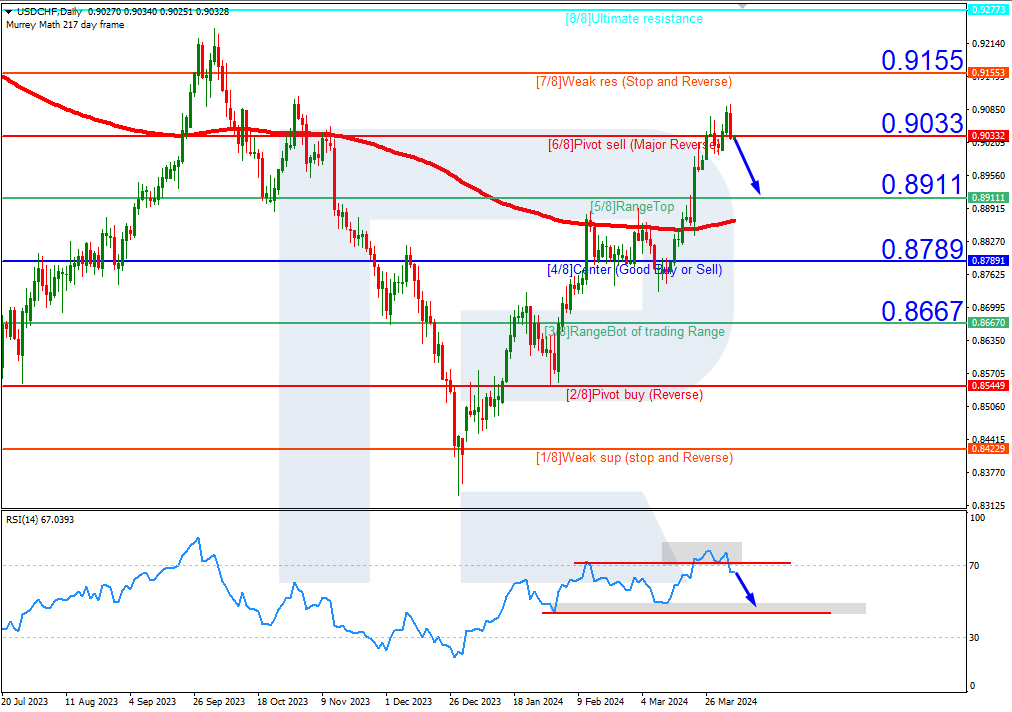
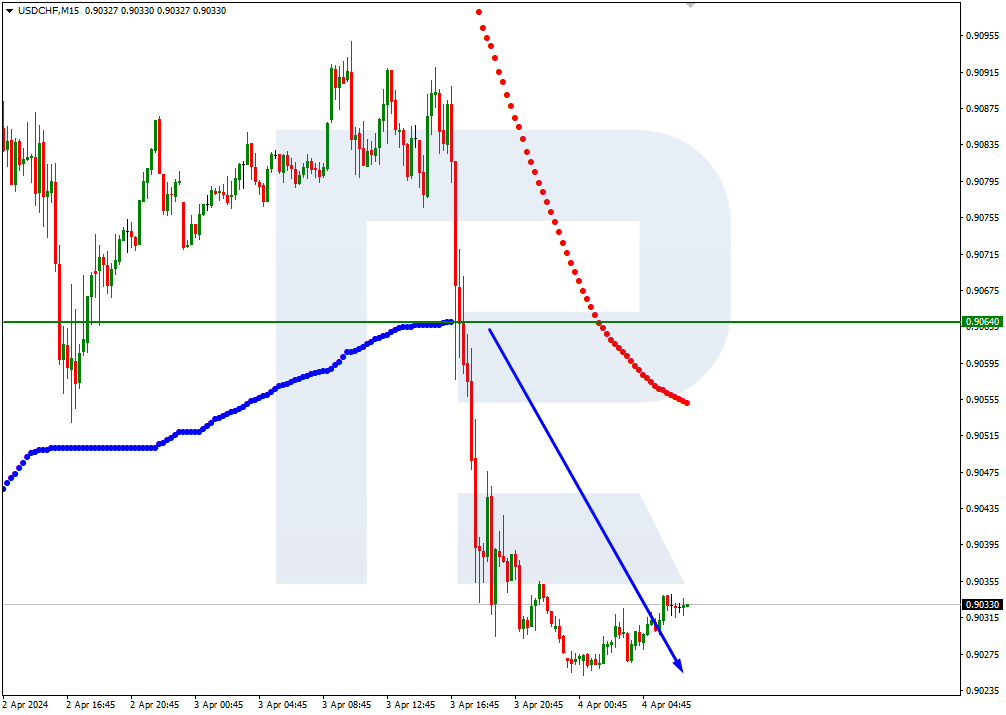
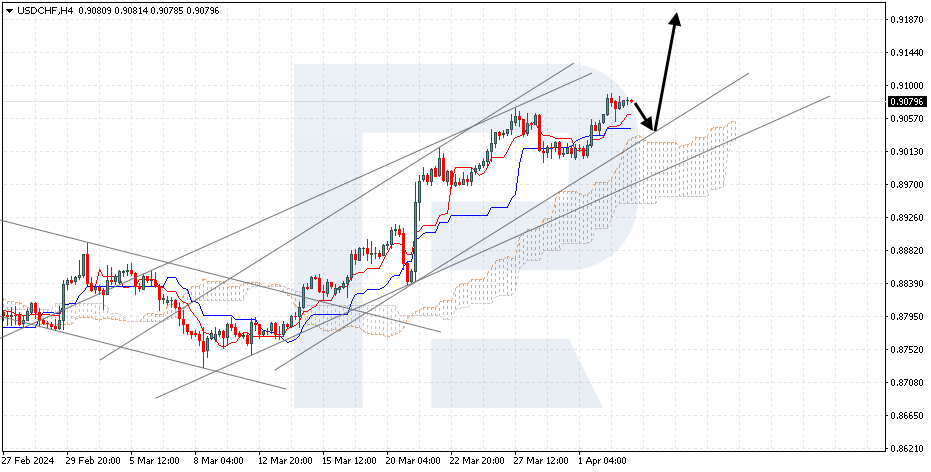
USDCHF, “US Dollar vs Swiss Franc”
USDCHF has established itself above the resistance level. The pair is going above the Ichimoku Cloud, which suggests an uptrend. A test of the Kijun-Sen line at 0.9025 is expected, followed by a rise to 0.9205. An additional signal confirming the rise could be a rebound from the lower boundary of the bullish channel. The scenario could be cancelled by a breakout of the lower boundary of the Ichimoku Cloud, with the price securing below 0.8920, which will signal a further decline to 0.8825.
Read more - Ichimoku Cloud Analysis (XAUUSD, GBPUSD, USDCHF)
Attention!
Forecasts presented in this section only reflect the author’s private opinion and should not be considered as guidance for trading. RoboForex bears no responsibility for trading results based on trading recommendations described in these analytical reviews.
Sincerely,
The RoboForex Team