forex software

Create and Test Forex Strategies

forex software

Skip to forum content

Forex Software

Create and Test Forex Strategies

You are not logged in. Please login or register.


(Page 52 of 62)

Forex Software → Market Analysis → InstaForex Analysis

Pages Previous 1 50 51 52 53 54 62 Next

You must login or register to post a reply

RSS topic feed

Posts: 1,276 to 1,300 of 1,547

Re: InstaForex Analysis

Forex Analysis & Reviews: Forecast for EUR/USD on February 22, 2023

This information is provided to retail and professional clients as part of marketing communication. It does not contain and should not be construed as containing investment advice or investment recommendation or an offer or solicitation to engage in any transaction or strategy in financial instruments. Past performance is not a guarantee or prediction of future performance. Instant Trading EU Ltd. makes no representation and assumes no liability as to the accuracy or completeness of the information provided, or any loss arising from any investment based on analysis, forecast or other information provided by an employee of the Company or otherwise. Full disclaimer is available here.


EUR/USD fell by 35 pips on Tuesday, breaking through the support level of 1.0660. However, the decline is short-lived as the pair is already trying to get back above 1.0660 during today's Asian session. This is already the second unsuccessful attempt to go under the support level. The first one was on February 17. Under the new circumstances, the pair may now make an attempt to rise to the target range of 1.0758/87.

https://forex-images.ifxdb.com/userfiles/20230222/analytics63f57f8a44085_source!.jpg

If the Marlin oscillator continues to move sideways or go down, the pair will not be able to climb up. After all, a consolidation has been going on since February 6, and a breakout is most likely to occur downward. If that happens, the pair will decline below 1.0595 and go further towards 1.0470.

https://forex-images.ifxdb.com/userfiles/20230222/analytics63f57f761d64d_source!.jpg

On the four-hour (H4) timeframe, the pair is under the indicator lines and the Marlin oscillator is moving sideways. Wait for a consolidation above or below 1.0660 and watch for further developments.

Risk Warning: CFDs are complex instruments and come with a high risk of losing money rapidly due to leverage. 77.95% of retail investor accounts lose money when trading CFDs with this provider. You should consider whether you understand how CFDs work and whether you can afford to take the high risk of losing your money.

Analysis are provided by InstaForex.

Read More

Best regards, PR Manager / Learn more about InstaForex Company at http://instaforex.com

Re: InstaForex Analysis

Forex Analysis & Reviews: Technical Analysis of Daily Price Movement of AUD/JPY Cross Currency Pairs, Thursday February 23 2023 Kamis 23 Februari 2023.

This information is provided to retail and professional clients as part of marketing communication. It does not contain and should not be construed as containing investment advice or investment recommendation or an offer or solicitation to engage in any transaction or strategy in financial instruments. Past performance is not a guarantee or prediction of future performance. Instant Trading EU Ltd. makes no representation and assumes no liability as to the accuracy or completeness of the information provided, or any loss arising from any investment based on analysis, forecast or other information provided by an employee of the Company or otherwise. Full disclaimer is available here.

https://forex-images.ifxdb.com/userfiles/20230223/analytics63f6eef09acb0_source!.jpg

Although this time on the daily chart AUD/JPY cross currency pairs is moving in a channel that dips downwards which means that the main bias is still bearish but currently AUD/JPY is experiencing a correction rallying upwards which is marked by the appearance of the Bearish Continuation Ascending Broadening Wedge pattern even though the Bullish 123 pattern has appeared which is followed by the appearance of several Ross Hooks (RH) , while the level that will be tested in the near future is the 92.98 level. If this level is successfully penetrated and as long as it does not return to its initial bias and goes below the 90.74 level, AUD/JPY in the next few days has the potential to test the 93.58 level as its first target and the 94.37 area level. -95.22 as the second target if the momentum and volatility are enough to support.

Risk Warning: CFDs are complex instruments and come with a high risk of losing money rapidly due to leverage. 77.95% of retail investor accounts lose money when trading CFDs with this provider. You should consider whether you understand how CFDs work and whether you can afford to take the high risk of losing your money.

Analysis are provided by InstaForex.

Read More

Best regards, PR Manager / Learn more about InstaForex Company at http://instaforex.com

Re: InstaForex Analysis

Forex Analysis & Reviews: Forecast for EUR/USD on February 24, 2023

This information is provided to retail and professional clients as part of marketing communication. It does not contain and should not be construed as containing investment advice or investment recommendation or an offer or solicitation to engage in any transaction or strategy in financial instruments. Past performance is not a guarantee or prediction of future performance. Instant Trading EU Ltd. makes no representation and assumes no liability as to the accuracy or completeness of the information provided, or any loss arising from any investment based on analysis, forecast or other information provided by an employee of the Company or otherwise. Full disclaimer is available here.

On Thursday, the euro showed some volatility, not being able to break away from the target level of 1.0595. This morning, the quote is also fluctuating near that level, but the Marlin oscillator started reversing upward, so it might correct to the resistance at 1.0660. If the price finds the strength to settle under 1.0595, then next week we can expect a hike to the target level of 1.0443/70.

https://forex-images.ifxdb.com/userfiles/20230224/analytics63f8294cc22b9_source!.jpg

On the four-hour chart, the nearest resistance to the corrective growth is the MACD indicator line (1.0622). Once it overcomes this line, we can expect further price growth. The Marlin oscillator, which has come out of its own descending channel upwards, counts on the bulls' potential success.

https://forex-images.ifxdb.com/userfiles/20230224/analytics63f8295b7caaa_source!.jpg

There is a traditional nuance - a false exit of the examined line beyond the boundary of the geometrical construction, so we're waiting for the development of events with the formation of confirming signs, both for bulls and bears.

Risk Warning: CFDs are complex instruments and come with a high risk of losing money rapidly due to leverage. 77.95% of retail investor accounts lose money when trading CFDs with this provider. You should consider whether you understand how CFDs work and whether you can afford to take the high risk of losing your money.

Analysis are provided by InstaForex.

Read More

Best regards, PR Manager / Learn more about InstaForex Company at http://instaforex.com

Re: InstaForex Analysis

Forex Analysis & Reviews: Forecast for USD/JPY on February 27, 2023

This information is provided to retail and professional clients as part of marketing communication. It does not contain and should not be construed as containing investment advice or investment recommendation or an offer or solicitation to engage in any transaction or strategy in financial instruments. Past performance is not a guarantee or prediction of future performance. Instant Trading EU Ltd. makes no representation and assumes no liability as to the accuracy or completeness of the information provided, or any loss arising from any investment based on analysis, forecast or other information provided by an employee of the Company or otherwise. Full disclaimer is available here.

On Friday, the yen showed its intention to break through the 137.70 target. Overcoming the resistance of this embedded price channel line will allow the pair to try and hit 138.90, 140.90 as well as other target levels.

https://forex-images.ifxdb.com/userfiles/20230227/analytics63fc141a6a9fa_source!.jpg

However, this brilliant plan is hindered by the Marlin oscillator, which is very reluctant to continue rising on the daily chart. The prospect of its growth is great, but the potential for a reversal to the downside is also great. It is very likely that before the price climbs above 137.70, the correctional decline to 133.90 will follow.

https://forex-images.ifxdb.com/userfiles/20230227/analytics63fc140d5f9d4_source!.jpg

On the four-hour chart, so far, the situation supports the growth scenario - the price is above the indicator lines, and after the reversal from the MACD line, the Marlin oscillator is in a position to rise. We're waiting for the completion of the growing branch of the 133.90-137.70 range.

Risk Warning: CFDs are complex instruments and come with a high risk of losing money rapidly due to leverage. 77.95% of retail investor accounts lose money when trading CFDs with this provider. You should consider whether you understand how CFDs work and whether you can afford to take the high risk of losing your money.

Analysis are provided by InstaForex.

Read More

Best regards, PR Manager / Learn more about InstaForex Company at http://instaforex.com

Re: InstaForex Analysis

Forex Analysis & Reviews: Forecast for GBP/USD on February 28, 2023

Yesterday, the pound made a big gain ahead of the currency market (122 points). The price overcame the signal level of 1.2030 and now it is aiming for the target level of 1.2155. On the daily chart, the signal line of the Marlin oscillator turned out to have made a false plunge under the graphical linear support (turquoise line).

https://forex-images.ifxdb.com/userfiles/20230228/analytics63fd6527842ca.jpg

The oscillator's move into positive territory has now dramatically increased the odds. An important sign of the price reversal in the medium-term growth will be its consolidation above 1.2155, the final sign - over the MACD line (1.2315). But this, of course, is an alternative scenario. In current conditions, I don't expect the pound to climb above 1.2155. If such growth happens, it is very likely to be false.

https://forex-images.ifxdb.com/userfiles/20230228/analytics63fd6517d8353.jpg

On the four-hour chart, so far, the situation supports the growth scenario - the price is above the indicator lines, and after the reversal from the MACD line, the Marlin oscillator is in a position to rise. We're waiting for the completion of the growing branch of the 133.90-137.70 range.

On the four-hour chart, the price has consolidated above both indicator lines, the Marlin has settled in the uptrend zone. We are waiting for the end of the pound's bullish correction. The opposite signal, confirming the reversal in the medium-term decline, will be the price moving below the MACD line (1.1980).

Analysis are provided by InstaForex.

Read More

Best regards, PR Manager / Learn more about InstaForex Company at http://instaforex.com

Re: InstaForex Analysis

Forex Analysis & Reviews: Technical Analysis of Intraday Price Movement of USD/CAD Commodity Currency Pairs, Wednesday March 01 2023

https://forex-images.ifxdb.com/userfiles/20230301/analytics63feca7f1ff98.jpg

If we look on the 4 hour chart The Loonie then there will be 2 important things:
1. The appearance of Bearish 123 pattern.
2. There is a hidden deviation between Price movement with Stochastic Oscillator indicator.

Based on two things above then as long as USD/CAD back to break above the level 1,3658 on the nearest time has the potential to go down to test the level of 1,3533. If this level successfully broken then level 1,3440 will become the next main target to pursue and level 1,3356 will be the second target to test later.

(Disclaimer)
*The market analysis posted here is meant to increase your awareness, but not to give instructions to make a trade.

Analysis are provided by InstaForex.

Read More

Best regards, PR Manager / Learn more about InstaForex Company at http://instaforex.com

Re: InstaForex Analysis

FOREX ANALYSIS & REVIEWS: TECHNICAL ANALYSIS OF DAILY PRICE MOVEMENT OF NASDAQ 100 INDEX, THURSDAY MARCH 02 2023.

https://forex-images.ifxdb.com/userfiles/20230302/analytics640020a52da5a.jpg

Nasdaq 100 Index on the daily chart seems continue the decline and currently trying to break below its Bearish Ross Hook at the level 11913.5 where it is also confirmed by the price movement that moves below EMA 10 and MACD indicator which intersects downwards where this all shows that the momentum from #NDX is in a bearish condition so that if this (RH) level is successfully broken down then #NDX has the potential to continue its decline to the level of 11546.3 as the first target and if the momentum and volatility are also supportive then no It is impossible for the 11246.8 level to become the second target with a note that during the descent towards these target levels there was no significant upward correction, especially to break above the 12236.7 level because if this level is successfully penetrated upwards then the downward scenario described previously has the potential not to occur. realized.

(Disclaimer)
*The market analysis posted here is meant to increase your awareness, but not to give instructions to make a trade.

Analysis are provided by InstaForex.

Read More

Best regards, PR Manager / Learn more about InstaForex Company at http://instaforex.com

Re: InstaForex Analysis

FOREX ANALYSIS & REVIEWS: FORECAST FOR USD/JPY ON MARCH 3, 2023

The yen is moving up so far, according to our main scenario, to the 137.75 target level. But the technical pressure on the pair is increasing every day. The signal line of the Marlin oscillator is being pushed down, against the rising price. The pair might not reach the 137.75 target.

https://forex-images.ifxdb.com/userfiles/20230303/analytics64015f52da28b.jpg

The pair can continue to rise if the dollar continues a massive attack in all markets, including commodities, then the oscillator's decline will transform before it rises further. And then the price could overcome the target level of 137.75 and the rally will continue to reach 138.90 (July 21, 2022 high).

https://forex-images.ifxdb.com/userfiles/20230303/analytics64015f4337907.jpg

There is a double divergence on the four-hour chart. If the price goes under the MACD line, below the 136.28 mark, it will also correspond to the move of the Marlin oscillator into the downtrend area. The downtrend will be fueled even more, once the price hits the 134.00 target. A full-fledged growth will start once the price surpasses yesterday's high (137.10).

Risk Warning: CFDs are complex instruments and come with a high risk of losing money rapidly due to leverage. 77.95% of retail investor accounts lose money when trading CFDs with this provider. You should consider whether you understand how CFDs work and whether you can afford to take the high risk of losing your money.

Analysis are provided by InstaForex.

Read More

Best regards, PR Manager / Learn more about InstaForex Company at http://instaforex.com

Re: InstaForex Analysis

FOREX ANALYSIS & REVIEWS: TECHNICAL ANALYSIS OF DAILY PRICE MOVEMENT OF EUR/GBP CROSS CURRENCY PAIRS, MONDAY MARCH 06, 2023.

https://forex-images.ifxdb.com/userfiles/20230306/analytics64055657cb0fc.jpg

On the daily chart EUR/GBP cross currency pairs you can see that the price movement is moving in a downward channel and the appearance of deviations between price movements and the MACD indicator strengthens the potential for a decline in EUR/GBP in the future where currently the 0.8754 level will try to be broken down if this level is successfully broken down and there is no upward correction that passes level 0.8928, EUR/GBP in the next few days will potentially fall down to the 0.8721 level as the first target and the 0.8546 level as the second target.

(Disclaimer)
*The market analysis posted here is meant to increase your awareness, but not to give instructions to make a trade.

Analysis are provided by InstaForex.

Read More

Best regards, PR Manager / Learn more about InstaForex Company at http://instaforex.com

Re: InstaForex Analysis

FOREX ANALYSIS & REVIEWS: FORECAST FOR USD/JPY ON MARCH 7, 2023

Yesterday's attempts to win back positions against the dollar were suppressed, and the pair ended the day above Friday's closing level by 9 points. The Marlin oscillator is persistently decreasing on the daily chart, but it also creates the potential for the oscillator to move into the overbought zone. We still have an uptrend, and the target is the nearest embedded line of the price hyperchannel around 137.75.

https://forex-images.ifxdb.com/userfiles/20230307/analytics6406a45626030.jpg

If the price overcomes yesterday's low (135.38), it can continue to fall to the bottom line of the price channel around 134.00.

https://forex-images.ifxdb.com/userfiles/20230307/analytics6406a47f4e3ff.jpg

On the four-hour chart, the price is under the balance and MACD indicator lines. The Marlin oscillator reverses upward, but it still needs to move into the positive area to support the bulls. In order for the pair to continue rising, the price needs to break through the MACD line at 136.53.

(Disclaimer)
*The market analysis posted here is meant to increase your awareness, but not to give instructions to make a trade.

Analysis are provided by InstaForex.

Read More

Best regards, PR Manager / Learn more about InstaForex Company at http://instaforex.com

Re: InstaForex Analysis

FOREX ANALYSIS & REVIEWS: TECHNICAL ANALYSIS OF DAILY PRICE MOVEMENT OF USD/CAD COMMODITY CURRENCY PAIRS, WEDNESDAY, MARCH 08 2023.

https://forex-images.ifxdb.com/userfiles/20230308/analytics64080ae144942.jpg

There is a few interesting things on the daily chart USD/CAD commodity currency pairs:
1. The appearance of three Wiseman signal.
2. There is a deviation between price movement with Awesome Oscillator indicator.
3. The price moves above the open Alligator gaping upwards.
4. The appearance of Bullish 123 pattern follow by 2 or Ross Hook (RH).
Based on the facts above we can predicted in a few days ahead that the Loonie will try to tested level 1,3977. However if on its way to to those levels suddenly corrected down below the level of 1,3554 the Bulls scenario that has been described earlier will become invalid and cancel by itself.

(Disclaimer)
*The market analysis posted here is meant to increase your awareness, but not to give instructions to make a trade.

Analysis are provided by InstaForex.

Read More

Best regards, PR Manager / Learn more about InstaForex Company at http://instaforex.com

Re: InstaForex Analysis

FOREX ANALYSIS & REVIEWS: ELLIOTT WAVE ANALYSIS OF UNG FOR MARCH 9, 2023

https://forex-images.ifxdb.com/userfiles/20230309/analytics6409750a6facb.jpg

UNG continues to follow our count to the letter and we are now close to testing the 61.8% corrective target of the rally from 7.16 to 9.99 at 8.23. This is likely enough to set the stage for the next impulsive rally higher towards 16.40 and 20.56 as the next upside targets.

A rally likely that in UNG warns the Natural Gas prices will lift off too and that inflation isn't under control as many politicians and economists like to tell us, so be alert as to when the next impulsive rally is ready to take off.

(Disclaimer)
*The market analysis posted here is meant to increase your awareness, but not to give instructions to make a trade.

Analysis are provided by InstaForex.

Read More

Best regards, PR Manager / Learn more about InstaForex Company at http://instaforex.com

Re: InstaForex Analysis

FOREX ANALYSIS & REVIEWS: FORECAST FOR EUR/USD ON MARCH 10, 2023

Yesterday, the euro managed to develop a correction so that it can reach the target level of 1.0595 this morning. The price returned to the consolidation range of the second half of December 2022, and can stay there until the release of the US employment data. Also, the price may settle below 1.0595, as the trading volumes have noticeably decreased in recent days.

https://forex-images.ifxdb.com/userfiles/20230310/analytics640a9a68c5e90.jpg

We expect today's Nonfarm Payrolls to be good as weekly jobless claims are coming in at a consistently low 196,000 on average over the past month. A month earlier, the average was 189,000 and then, in January, Nonfarm Payrolls showed an increase of 517,000 new jobs. Forecast for February is 205,000, the data is likely to be better than forecast. I expect the euro to fall to the target range of 1.0443/70.

On the four-hour chart, the price has stopped rising in the area where the MACD indicator line coincides with the target resistance of 1.0595. The signal line of the Marlin oscillator closely approached the zero neutral line.There is a high probability that the price will reverse to the downside. In the main bearish scenario, the price can also climb above the resistance, but this will be a false breakout.

https://forex-images.ifxdb.com/userfiles/20230310/analytics640a9a5a14ecd.jpg

(Disclaimer)
*The market analysis posted here is meant to increase your awareness, but not to give instructions to make a trade.

Analysis are provided by InstaForex.

Read More

Best regards, PR Manager / Learn more about InstaForex Company at http://instaforex.com

Re: InstaForex Analysis

FOREX ANALYSIS & REVIEWS: TRADING SIGNAL FOR GBP/USD FOR MARCH 13 - 14, 2023: BUY ABOVE 1.2052 OR SELL AFTER PULLBACK AT 1.2140 (200 EMA - GAP

https://forex-images.ifxdb.com/userfiles/20230313/analytics640ea69029e98.jpg

Early in the European session, the British pound is trading around 1.2071 above the 200 EMA above the 21 SMA. We can see that the GBP/USD pair opened this week's trade with a bullish gap.

The market sentiment is bullish and is being supported by the 200 EMA. It is likely to continue to rise in the next few hours and reach the maximum of 1.2140, the level seen on February 21 and 28.

This zone between the levels of 1.2140 -1.2161 (daily resistance_1) could act as a strong barrier for the British pound since in February, it acted as strong resistance twice.

In case of a pullback towards 1.2140 - 1.2161, we could sell with targets of 1.2085 (3/8 Murray) and 1.2050 (200 EMA).

If the British pound falls below the 200 EMA and trades on 4-hour charts below this level, we can expect it to fill the gap left around 1.2030 and reach support at 2/8 Murray at 1.19162.

In the event that the British pound trades below 4/8 Murray located at 1.2207 or any technical rebound in this area, we could see a signal to sell. In this case, the pair could reach 1.2000 in the next few days and even could fall to 1.1840 (1/8 Murray).

(Disclaimer)
*The market analysis posted here is meant to increase your awareness, but not to give instructions to make a trade.

Analysis are provided by InstaForex.

Read More

Best regards, PR Manager / Learn more about InstaForex Company at http://instaforex.com

Re: InstaForex Analysis

FOREX ANALYSIS & REVIEWS: FORECAST FOR GBP/USD ON MARCH 14, 2023

The pound continued its irrepressible growth yesterday, adding one and a half figures and overcoming the target level of 1.2155. It did not settle above this level, and this morning, it fell below it.

https://forex-images.ifxdb.com/userfiles/20230314/analytics640fee4cc0e16.jpg

Most likely, the price can now head to close the opening gap of the week (1.2028). The Marlin oscillator has marked the beginning of the reversal. On the four-hour chart, there are no obvious reversal signs yet, the signal line of the oscillator should decrease even more. The first step will be the price settling under 1.2155.

https://forex-images.ifxdb.com/userfiles/20230314/analytics640fee58f0199.jpg

If the price is able to exceed yesterday's high of 1.2198, it may continue to rise to the MACD line around 1.2272 on the daily chart.

(Disclaimer)
*The market analysis posted here is meant to increase your awareness, but not to give instructions to make a trade.

Analysis are provided by InstaForex.

Read More

Best regards, PR Manager / Learn more about InstaForex Company at http://instaforex.com

Re: InstaForex Analysis

ELLIOTT WAVE ANALYSIS OF EUR/USD FOR MARCH 15, 2023

https://forex-images.ifxdb.com/userfiles/20230315/analytics6411541abed38.jpg

EUR/USD has consolidated just above the double bottom neckline near 1.0710 and is ready to push higher towards the next minor resistance at 1.0807. EUR/USD is making its way higher to the 1.1248 target and possibly even closer to 1.1424 before wave 5 is in place.

Support is seen at 1.0710 and then at 1.0636 which we expect will be able to act as a floor for the next impulsive rally higher towards 1.1248 and possibly higher.

Analysis are provided by InstaForex.

Read More

Best regards, PR Manager / Learn more about InstaForex Company at http://instaforex.com

Re: InstaForex Analysis

TRADING PLAN FOR US DOLLAR INDEX ON MARCH 16, 2023

https://forex-images.ifxdb.com/userfiles/20230316/analytics6412ac0a4ebfd.jpg

Technical outlook:
The US dollar index slipped through 104.50 during the New York session on Wednesday as discussed earlier. The index is seen to be trading close to 104.10 at this point in writing as the bears remain inclined to come back in control intraday. Interim support is now in place at 103.00 and the bullish structure will remain intact until it holds well.

The US dollar index is currently working on its larger-degree rally between 100.50 and 105.50 as seen on the 4H chart here. The bears have been successful to drag prices lower towards 103.00, which is the Fibonacci 0.50 retracement of the above rally. Please note that the potential remains for a drag lower towards 102.50 if an Up Gartley is unfolding.

In that case, prices will test the Fibonacci 0.618 retracement around 102.50 before resuming its rally towards 106.50 and 109.00. Also, note that 102.50 is the Fibonacci 0.618 retracement of the above rally, hence the potential remains high for a bullish turn if prices manage to reach there. The overall direction remains higher against 100.50.

Trading idea:
A potential rally towards 106.00 and 109.00
Good luck!

Analysis are provided by InstaForex.

Read More

Best regards, PR Manager / Learn more about InstaForex Company at http://instaforex.com

Re: InstaForex Analysis

FORECAST FOR AUD/USD ON MARCH 17, 2023

Yesterday, the Australian dollar decided to take advantage of the wave of optimism in European markets and rose by 40 points. In today's Asian session, it is gaining the same amount.

https://forex-images.ifxdb.com/userfiles/20230317/analytics6413cf6b07f18.jpg

AUD might reach the target level of 0.6730, and on the daily chart, the signal line of the Marlin oscillator will reach its zero line by that time. After that a synchronous reversal of the price and the oscillator from their resistances may follow.

https://forex-images.ifxdb.com/userfiles/20230317/analytics6413cf5d46969.jpg

On the four-hour chart, the price is rising after initial consolidation above the indicator lines and resistance level of 0.6640. If the price changes its mind to rise further, falling below the support of 0.6640 and under the MACD line (0.6630) will be a confirmation of it.

Analysis are provided by InstaForex.

Read More

Best regards, PR Manager / Learn more about InstaForex Company at http://instaforex.com

Re: InstaForex Analysis

NZDUSD, H4 | POTENTIAL BEARISH REVERSAL

https://forex-images.ifxdb.com/userfiles/20230320/analytics64181d42ef917.jpg

The NZD/USD chart currently displays a bearish momentum, with price below a major descending trend line and the bearish Ichimoku cloud. The potential price movement could involve a bearish reaction off the 1st resistance, leading to a drop towards the 1st support level.

At 0.6097, the 1st support level is a strong overlap support that lines up with the 38.20% Fibonacci retracement. If price drops below this level, the next support level it could reach is the 2nd support at 0.5897, which is a swing low support that has a 61.80% Fibonacci retracement lining up with it.

Alternatively, if price bounces from the 1st support level, it could rise to the 1st resistance level at 0.6284, which is a pullback resistance. Beyond that, the 2nd resistance level at 0.6476 is a significant multi-swing high resistance.

Analysis are provided by InstaForex.

Read More

Best regards, PR Manager / Learn more about InstaForex Company at http://instaforex.com

Re: InstaForex Analysis

FORECAST FOR EUR/USD ON MARCH 21, 2023

Yesterday, the euro was up 53 points, having overcome not only the balance indicator line on the daily chart, but it had also gotten through the collapse of the eurozone trade balance for January at -30.6bn against the forecast of -12.5bn and -8.8bn in December. The signal line of the Marlin oscillator, which we considered in yesterday's review, reached the March 15 high, from which the oscillator, and the price behind it, may reverse to the downside.

https://forex-images.ifxdb.com/userfiles/20230321/analytics64191c9467f75.jpg

If the price ignores today's ZEW eurozone economic sentiment indicator, which is expected to decline from 29.7 to 23.2 in the March estimate, the price might reach the 1.0758/87 target range. If expectations of the Federal Reserve's rate hike at tomorrow's meeting comes to the fore, the price will turn around towards 1.0660.

On the four-hour chart, the price is rising above the indicator lines, the Marlin oscillator is rising quietly in the area of the uptrend. In general, we can say that the price is in a neutral state. I still expect the euro to fall.

https://forex-images.ifxdb.com/userfiles/20230321/analytics64191c8a92d5d.jpg

Analysis are provided by InstaForex.

Read More

Best regards, PR Manager / Learn more about InstaForex Company at http://instaforex.com

Re: InstaForex Analysis

WTI, H4 | POTENTIAL REVERSAL?

https://forex-images.ifxdb.com/userfiles/20230322/analytics641a94db8fed0.jpg

WTI crude oil has been experiencing bearish momentum lately, potentially leading to a bearish reaction off the first resistance at 70.38 and a drop towards the first support at 67.02. The second support level at 64.36 is also expected to act as support due to its multi-swing low status. The first resistance level at 70.38 is an overlap resistance, with the second resistance level at 73.40 being a 50% Fibonacci retracement level. There is also an intermediate resistance level at 69.75. Overall, the chart's momentum is bearish

Analysis are provided by InstaForex.

Read More

Best regards, PR Manager / Learn more about InstaForex Company at http://instaforex.com

Re: InstaForex Analysis

INDICATOR ANALYSIS: DAILY REVIEW OF GBP/USD ON MARCH 23, 2023

Trend analysis (Fig. 1).
The pound-dollar pair may move upward from the level of 1.2265 (closing of yesterday's daily candle) to the target at 1.2352, the 85.4% pullback level (blue dotted line). When testing this level, the price may continue to move upward with the target at 1.2446, the upper fractal (blue dotted line).

https://forex-images.ifxdb.com/userfiles/20230323/analytics641bf8fcf25c8.jpg

Fig. 1 (daily chart).
Comprehensive analysis:
Indicator analysis - up;
Fibonacci levels - up;
Volumes - up;
Candlestick analysis - up;
Trend analysis - up;
Bollinger bands - up;
Weekly chart - up.

General conclusion:
Today, the price may move upward from the level of 1.2265 (closing of yesterday's daily candle) to the target at 1.2352, the 85.4% pullback level (blue dotted line). When testing this level, the price may continue to move upward with the target at 1.2446, the upper fractal (blue dotted line).

Alternatively, the price may move upward from the level of 1.2265 (closing of yesterday's daily candle) to the target at 1.2352, the 85.4% pullback level (blue dotted line). From this level, a downward movement is possible with the target at 1.2256, the 14.6% pullback level (yellow dotted line).

Analysis are provided by InstaForex.

Read More

Best regards, PR Manager / Learn more about InstaForex Company at http://instaforex.com

Re: InstaForex Analysis

BTCUSD, H4 | POTENTIAL REVERSAL FROM A KEY LEVEL ?

https://forex-images.ifxdb.com/userfiles/20230324/analytics641d30bea53eb.jpg

The BTC/USD chart is currently bearish, indicating potential further price drops. The first resistance level at 28342 could prompt a bearish reaction towards the first support level at 26557. This support level is an overlap support with a 23.60% Fibonacci retracement, which could be a strong buying interest area. If broken, the price could fall towards the second support level at 25204, which is also an overlap support with a 38.20% Fibonacci retracement.

On the resistance side, the first resistance level at 28342 is a multi-swing high resistance that could lead to significant selling pressure. Breaking through it may drive the price towards the second resistance level at 31662, a swing high resistance.

Analysis are provided by InstaForex.

Read More

Best regards, PR Manager / Learn more about InstaForex Company at http://instaforex.com

Re: InstaForex Analysis

BTC UPDATE FOR MARCH 27,.2023 - TIGHT RANGE AND POTENTIAL FOR THE BREAKOUT

https://forex-images.ifxdb.com/userfiles/20230327/analytics6421436fa91fc.jpg

BTC/USD has been trading sideways at the price of $27.800 and I see potetnial for the breakout mode.
Due to the strong upside cycle in the background and higher lows on H4, I see potential for the upside continuation.
In case of the breakout of resistance at $28.500, I see potential rally towards $32.000 and $35.000
Additionally, I found contraction of Bolinger Bands, which is another confirmation of the potential breakout regime.

Analysis are provided by InstaForex.

Read More

Best regards, PR Manager / Learn more about InstaForex Company at http://instaforex.com

Re: InstaForex Analysis

TECHNICAL ANALYSIS OF GBP/USD FOR MARCH 28, 2023

https://forex-images.ifxdb.com/userfiles/20230328/analytics64221dd6d76c8.jpg

Overview :

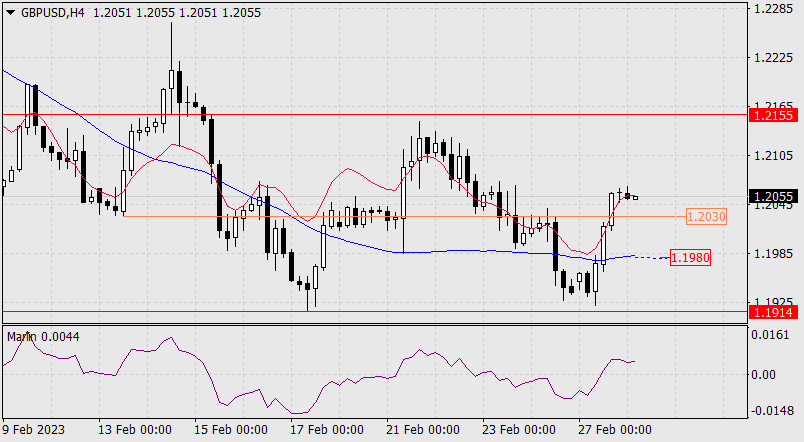
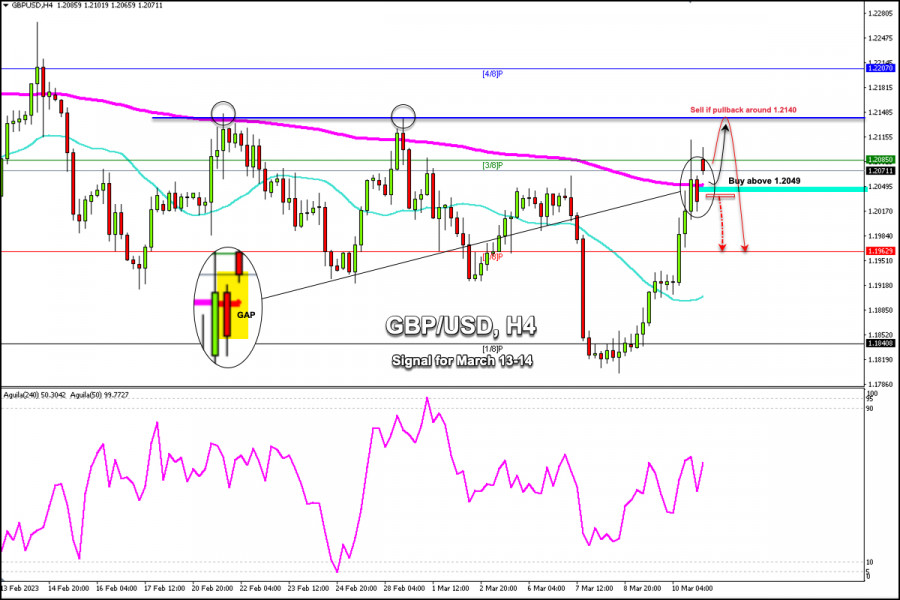
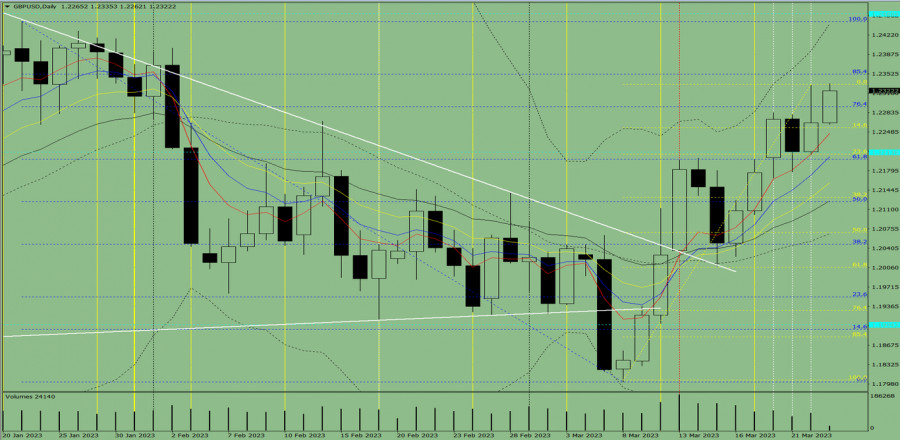
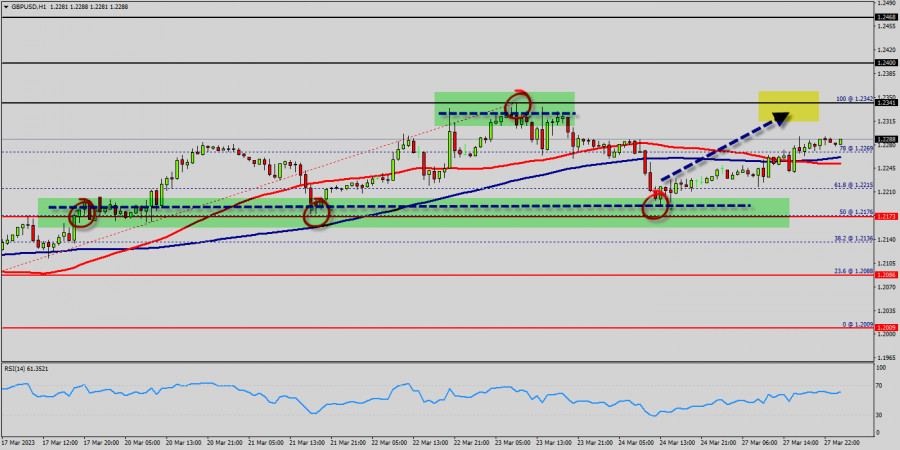
The GBP/USD pair traded higher and closed the day in the positive territory near the price of 1.2208. Right now, it was trading in a narrow range of 1.2150 staying close to a 2-days high. On the hourly chart, the GBP/USD pair is still trading above the MA (100) H1 moving average line (1.2068 - weekly pivot point). The situation is similar on the 4-hour chart. Based on the foregoing, it is probably worth sticking to the north direction in trading, and as long as the GBP/USD pair remains above MA 100 H1, it may be necessary to look for entry points to buy for the formation of a correction.

All elements being clearly bullish, it would be possible for traders to trade only long positions on the GBP/USD pair as long as the price remains well above the golden ratio of 1.2068. The buyers' bullish objective is set at 1.2209.

The price is likely to form a double top in the same time frame. Accordingly, the GBP/USD pair is showing signs of strength following a breakout of the highest level of 1.2209. So, buy above the level of 1.2068 with the first target at 1.2209 in order to test the daily resistance 1.

The level of 1.2209 is a good place to take profits. Moreover, the RSI is still signaling that the trend is upward as it remains strong above the moving average (100). This suggests that the pair will probably go up in coming hours.

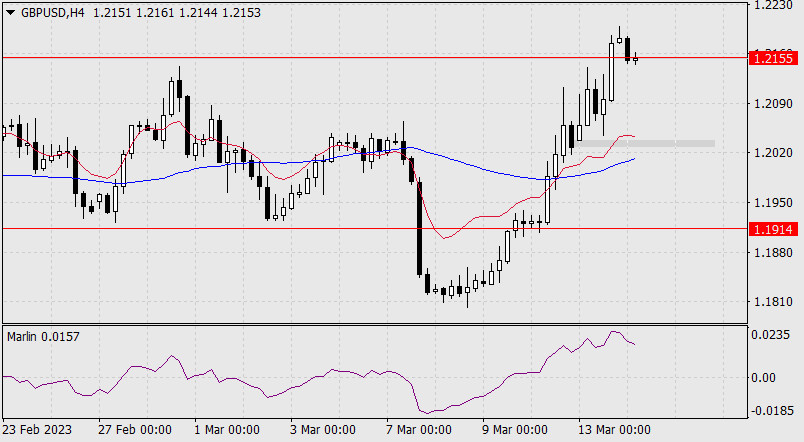
A bullish break in this resistance would boost the bullish momentum. Other outlook for the GBP/USD pair : Pound Sterling is currently trading at 1.2150. If the trend reverses from this point, then a possible future share price target could be 1.2209.

If the price of Pound Sterling is trading above 1.2150 then possibility of upside targets getting achieved is higher around the level of 1.2150.

The basic bullish trend is very strong on the GBP/USD pair, but the short term shows some signs of running out of steam. Nevertheless, a purchase could be considered as long as the price remains above 1.2150. Crossing the first resistance at 1.2209 would be a sign of a potential new surge in the price.

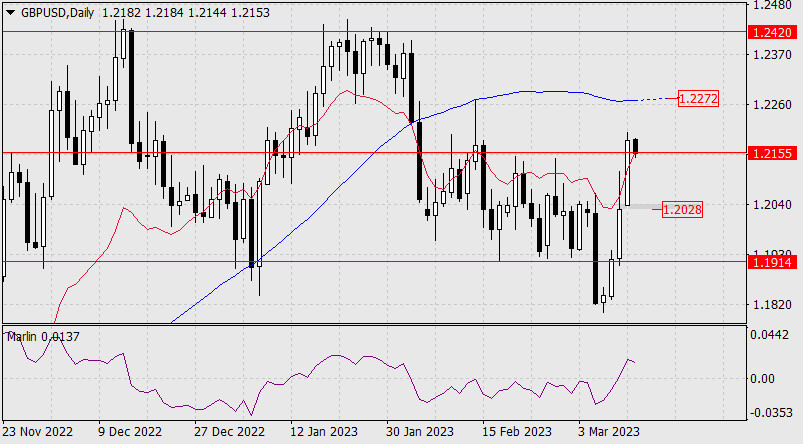
Buyers would then use the next resistance located at 1.2270 as an objective. Crossing it would then enable buyers to target 1.2270. Caution, a return to below 1.2270 would be a sign of a consolidation phase in the short-term basic trend.

If this is the case, remember that trading against the trend may be riskier. It would seem more appropriate to wait for a signal indicating reversal of the trend.

In the very short term, the general bullish sentiment is not called into question, despite technical indicators being indecisive.

All elements being clearly bullish market, it would be possible for traders to trade only long positions on the GBP/USD pair as long as the price remains well above the price of 1.2068.

The GBP/USD pair will continue rising from the level of 1.2068 in the long term. It should be noted that the support is established at the level of 1.2068 which represents the last bearish wave. The price is likely to form a double bottom in the same time frame.

Accordingly, the GBP/USD pair is showing signs of strength following a breakout of the highest level of 1.2068. So, buy above the level of 1.2068 with the first target at 1.2209 in order to test the daily resistance 1.

The buyers' bullish objective is set at the level of 1.2270 (last bullish wave). A bullish break in this resistance would boost the bullish momentum.

The buyers could then target the resistance located at 1.2270 . This suggests that the pair will probably go up in coming hours.

If the trend is able to break the level of 1.2209 (double top), then the market will call for a strong bullish market towards the objective of 1.2270 this week. If there is any crossing, the next objective would be the resistance located at 1.2270.

The level of 1.2270 is a good place to take profits. Moreover, the RSI is still signaling that the trend is upward as it remains strong above the moving average (100).

Since the trend is above the 61.8% Fibonacci level (1.2068), it means the market is still in a uptrend. From this point, the GBP/USD pair is continuing in a bullish trend from the new support of 1.2068. This is shown to us as the current price is in a bullish channel.

According to the previous events, we expect that the GBP/USD pair will move between 1.2068 and 1.2270 in coming hours. It is also should be noted, beware of bullish excesses that could lead to a possible short-term correction; but this possible correction would not be tradeable.

On the other hand, in case a reversal takes place and the GBP/USD pair breaks through the support level of 1.2068, a further decline to 1.1981 can occur. It would indicate a bearish market.

Analysis are provided by InstaForex.

Read More

Best regards, PR Manager / Learn more about InstaForex Company at http://instaforex.com

Posts: 1,276 to 1,300 of 1,547

Pages Previous 1 50 51 52 53 54 62 Next

You must login or register to post a reply

Forex Software → Market Analysis → InstaForex Analysis

Similar topics in this forum