forex software

Create and Test Forex Strategies

forex software

Skip to forum content

Forex Software

Create and Test Forex Strategies

You are not logged in. Please login or register.


(Page 51 of 62)

Forex Software → Market Analysis → InstaForex Analysis

Pages Previous 1 49 50 51 52 53 62 Next

You must login or register to post a reply

RSS topic feed

Posts: 1,251 to 1,275 of 1,547

Re: InstaForex Analysis

Forex Analysis & Reviews: Forecast for EUR/USD on January 17, 2023

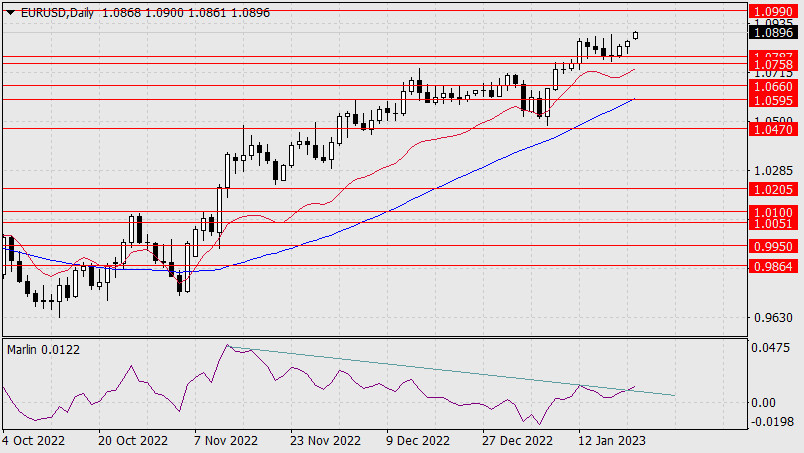
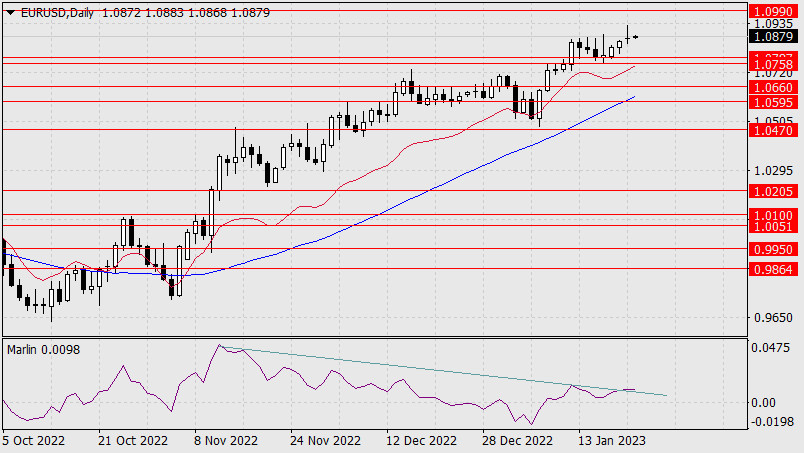
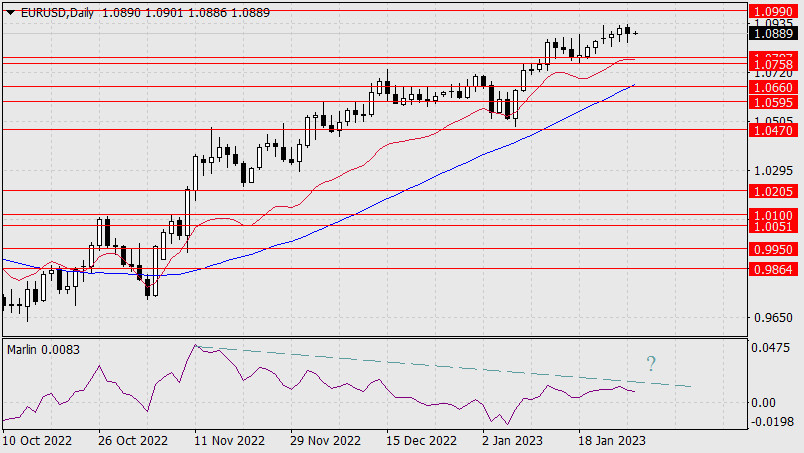
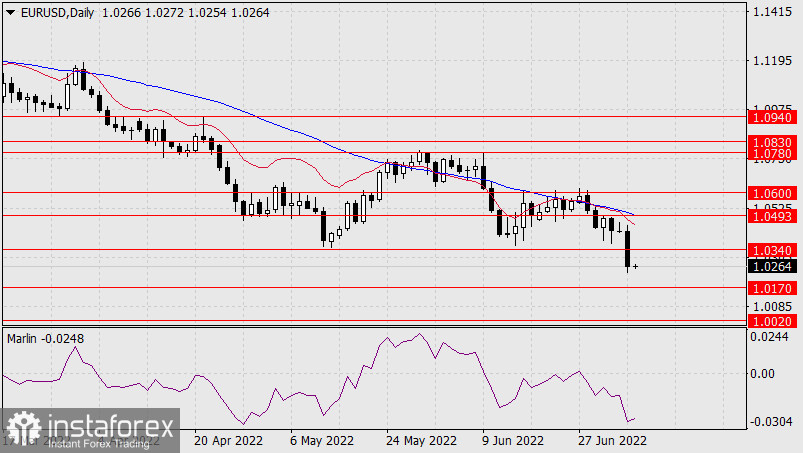
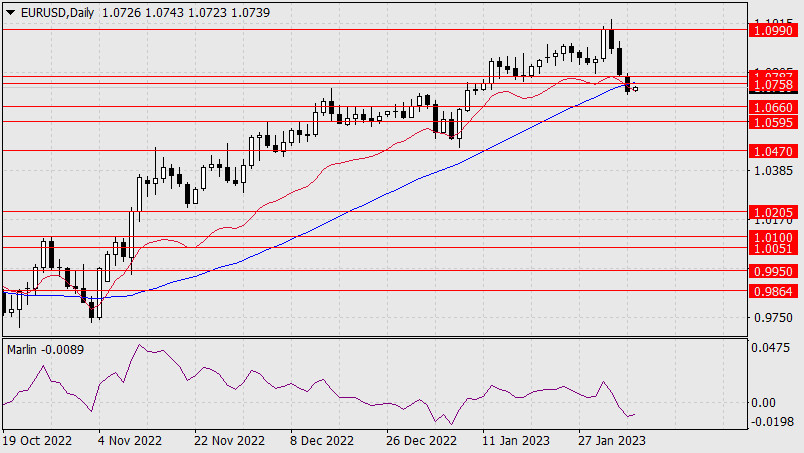
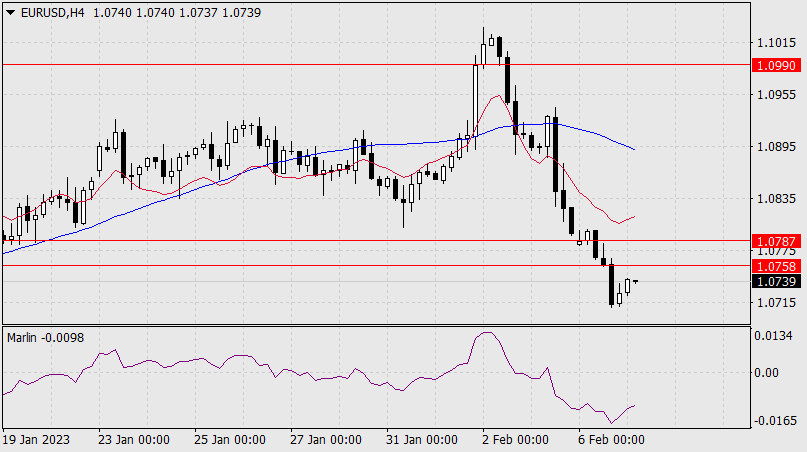
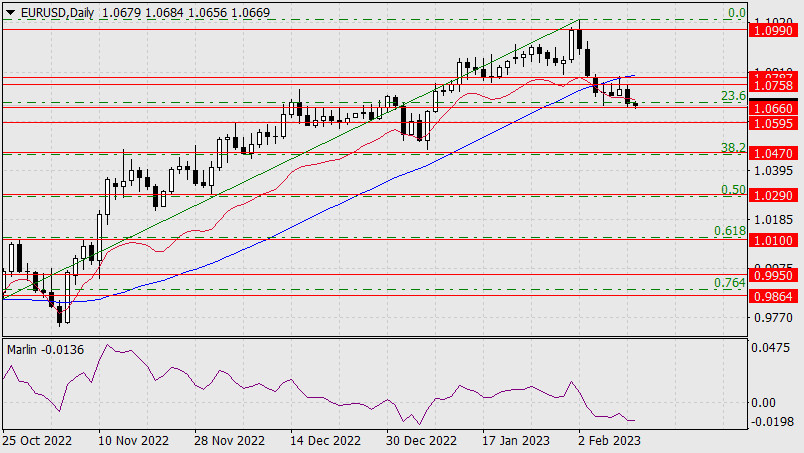
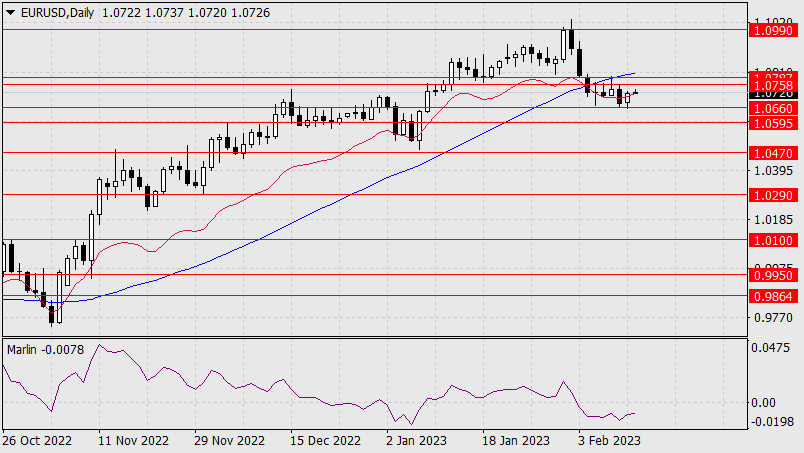
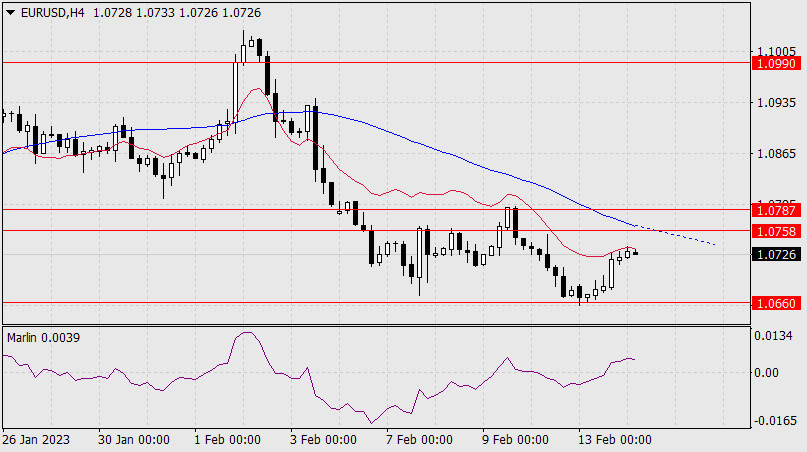
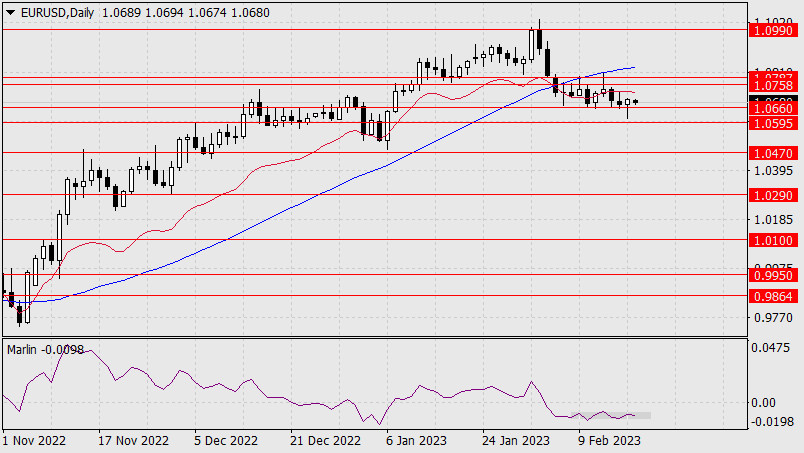
As we expected in yesterday's review, due to the US holiday, the euro moved sideways, confirming the consolidation above the target range of 1.0758/87. But over the past 24 hours important nuances appeared, while the main idea of the price breakdown of t1.0990 is preserved.

https://forex-images.ifxdb.com/userfiles/20230117/analytics63c61b8b945c0.jpg

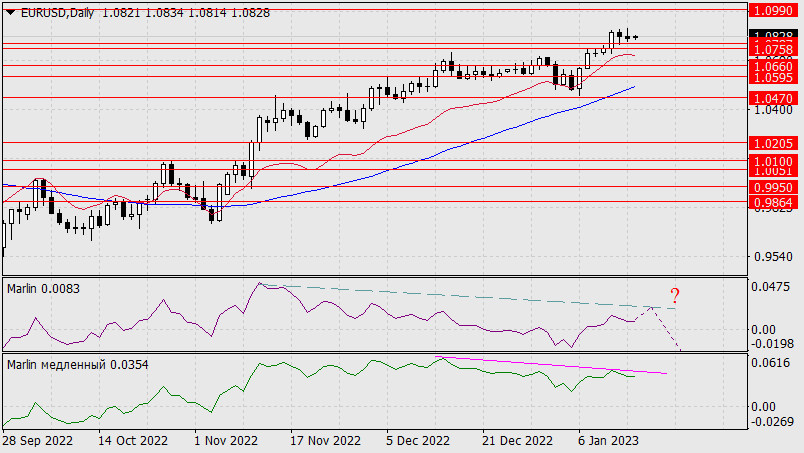
Our traditional Marlin oscillator still has the potential to form a renewed flat divergence, which is marked with a dotted line, and the so-called slow Marlin managed to form a traditional divergence, which increases the probability of a price reversal from the current levels. This will be confirmed once the price crosses the lower limit of the support range at 1.0758/87. Crossing yesterday's high at 1.0874 will push the pair to rise towards the target at 1.0990.

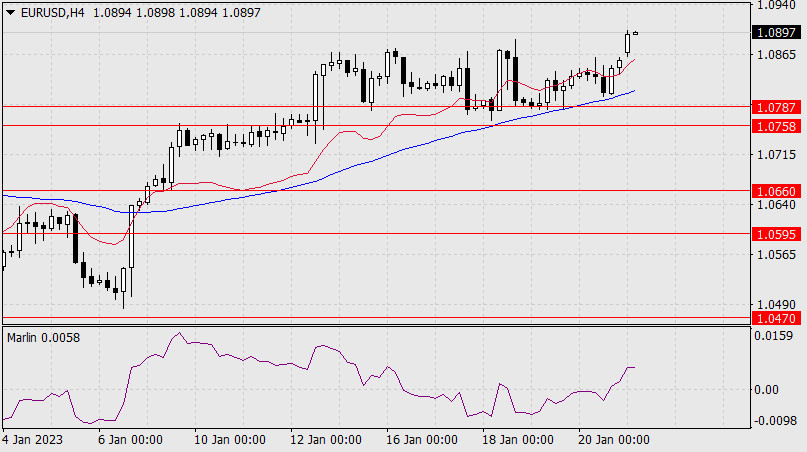
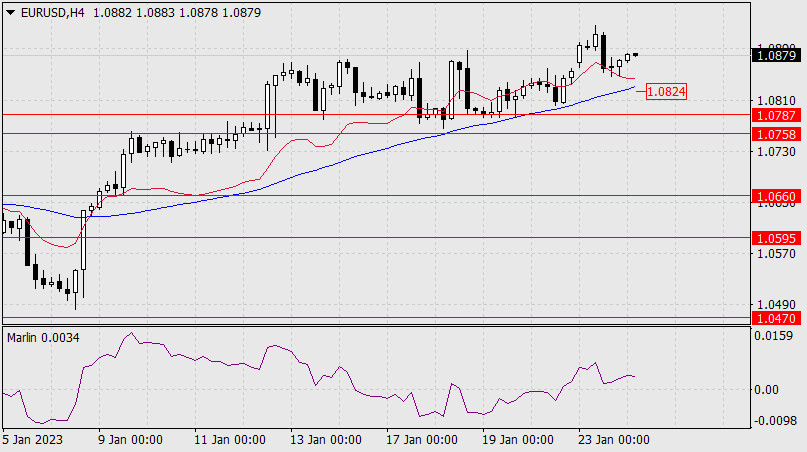
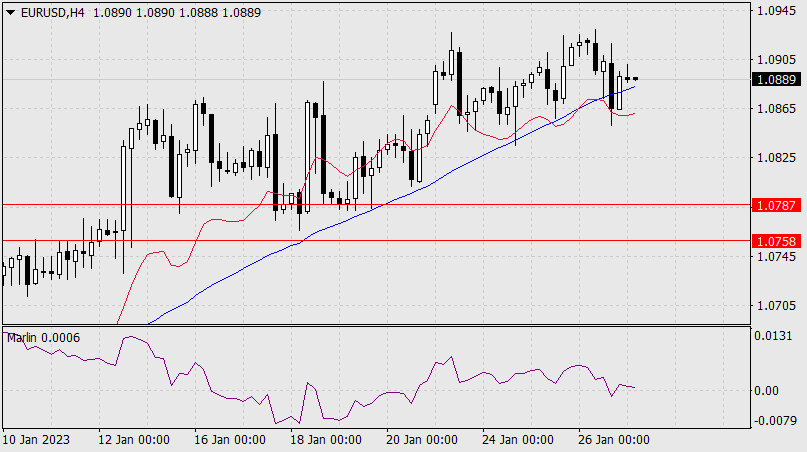
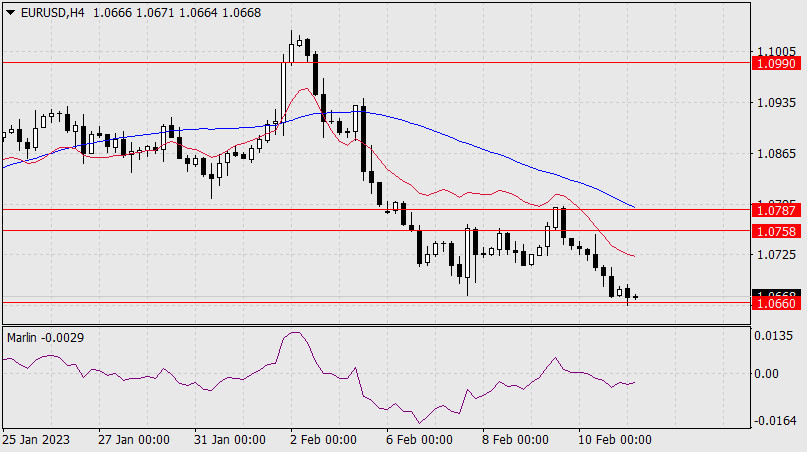
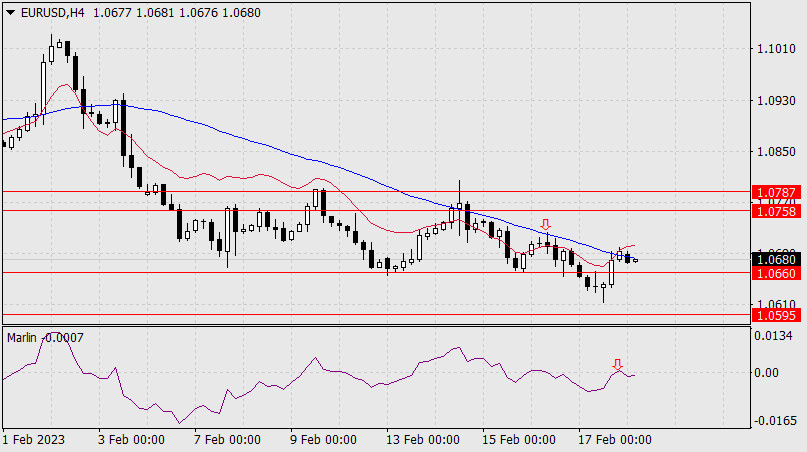
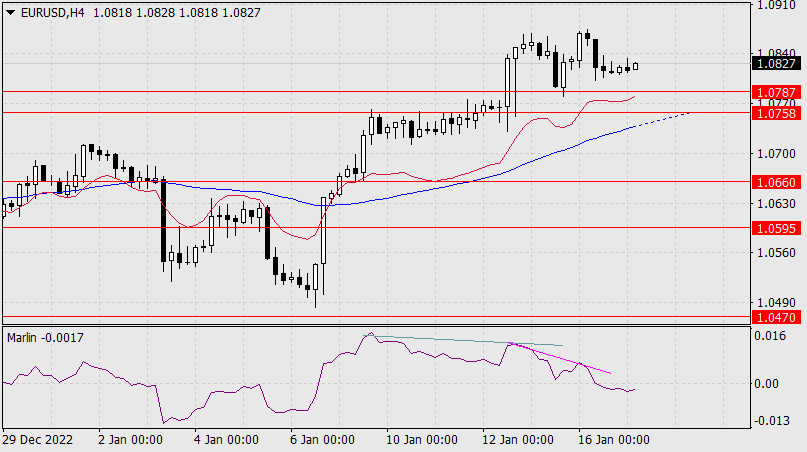
On the four-hour chart, under the pressure of a double divergence, the signal line went under the zero line, into the area of the downtrend. Now the price will be under pressure in the short-term. On the current chart, we see that crossing the lower limit of the range at 1.0758 coincides with crossing the MACD indicator line, and this will enhance the signal for further downward movement. We wait for the development of events.

https://forex-images.ifxdb.com/userfiles/20230117/analytics63c61b8378a50.jpg

*The market analysis posted here is meant to increase your awareness, but not to give instructions to make a trade.

Analysis are provided by InstaForex.

Read More

Best regards, PR Manager / Learn more about InstaForex Company at http://instaforex.com

Re: InstaForex Analysis

Forex Analysis & Reviews: Technical Analysis of Daily Price Movement of AUD/JPY Currency Pairs, Wednesday January 18, 2023

https://forex-images.ifxdb.com/userfiles/20230118/analytics63c770195254e.jpg

It can be seen clearly on the daily chart that the AUD/JPY currency pair is moving in a downward channel which means the bias is still bearish but currently it is corrected upwards especially since the emergence of the Bullish 123 pattern which was followed by the appearance of the Ross Hook where this level will be tested in the near future. tested by AUD/JPY so that if the 91.76 level is successfully penetrated above it then AUD/JPY in the next few days has the potential to appreciate up to the 93.50 level as the main target and the 95.03 level will be the next target to be tested but please pay attention to the emergence of the AUD Ascending Broadening Wedge pattern /JPY has the potential to fall back to its main bias (Bearish) where if the 86.97 level is penetrated below then all scenarios of an upward rally that have been described previously will become invalid.

*The market analysis posted here is meant to increase your awareness, but not to give instructions to make a trade.

Analysis are provided by InstaForex.

Read More

Best regards, PR Manager / Learn more about InstaForex Company at http://instaforex.com

Re: InstaForex Analysis

Forex Analysis & Reviews: Technical Analysis of Daily Price Movement of Silver Commodity Asset, Thursday January 19 2023.

https://forex-images.ifxdb.com/userfiles/20230119/analytics63c89b591905d.jpg

If we look at the 24,075-24,232 area level on the daily chart of commodity assets, Silver seems to function as a quite strong and significant resistance area because it is difficult for Silver to penetrate upwards where failure to penetrate above that level area creates Hagopian Rules conditions for this commodity asset that is in the channel. Bullish Pitchfork so that in the next few days Silver has the potential to fall corrected down to the level of the 22,010 - 21,400 area unless on the way down it suddenly Silver starts to rally again up significantly to break above the 24,485 level then the downside correction scenario described just now will become null and cancel by itself.

*The market analysis posted here is meant to increase your awareness, but not to give instructions to make a trade.

Analysis are provided by InstaForex.

Read More

Best regards, PR Manager / Learn more about InstaForex Company at http://instaforex.com

Re: InstaForex Analysis

Forex Analysis & Reviews: Forecast for USD/JPY on January 20, 2023

After the yen experienced increased volatility on Wednesday, the currency in question is moving sideways both yesterday and this morning as well. At the same time, traders are still bullish on the pair, the nearest target is 129.80, which is the line of the price channel on the higher chart. In case the quote continues to rise, the upper line of the descending green price channel is waiting around the 130.67 mark. Leaving the channel will open the next target at 133.60.

https://forex-images.ifxdb.com/userfiles/20230120/analytics63c9fec4713e9.jpg

The Marlin oscillator supports the price growth by rising in its own ascending channel. Crossing the signal line of the oscillator above the zero line will strengthen the price growth. On the four-hour chart, the Marlin oscillator is rising in the green zone, but growth is hampered by resistance of the balance indicator line. The MACD line is currently above the price, above the resistance of 129.80 on the daily chart.

Also, considering the downtrend, we can assume other market obstacles to the pair's growth. With time, however, we still expect a full-fledged correction from the price decline from October 21.

https://forex-images.ifxdb.com/userfiles/20230120/analytics63c9fed32498e.jpg

*The market analysis posted here is meant to increase your awareness, but not to give instructions to make a trade.

Analysis are provided by InstaForex.

Read More

Best regards, PR Manager / Learn more about InstaForex Company at http://instaforex.com

Re: InstaForex Analysis

Forex Analysis & Reviews: Forecast for EUR/USD on January 23, 2023

The stock markets' brisk rise helped keep the euro from nearly an "imminent" breakthrough from the 9-month high. This morning, there is a gap. Even the signal line of the Marlin oscillator was above the divergence line.

https://forex-images.ifxdb.com/userfiles/20230123/analytics63cdf26907fff.jpg

We don't know why the S&P 500 rallied by 1.89% on Friday, almost simultaneously (since Thursday) with pension funds contributions being cut to delay the "shutdown", as the US starts a hot period of disputes about the limit of the national debt.

In the meantime, the euro is moving towards the target level of 1.0990. But the gap is open, and if it closes after crossing 1.0990 or if the price doesn't reach this mark, we don't know what will happen. I don't expect the euro to rise above 1.0990, we consider the given growth only as a temporary way out of the general strategy, which involves a decrease in risk appetite.

On the four-hour chart, nothing interferes with growth, except for the window at the opening of the session. The price is above the indicator lines and the Marlin oscillator is in a good position for growth. The growth is expected to be short-term.

https://forex-images.ifxdb.com/userfiles/20230123/analytics63cdf276234ec.jpg

*The market analysis posted here is meant to increase your awareness, but not to give instructions to make a trade.

Analysis are provided by InstaForex.

Read More

Best regards, PR Manager / Learn more about InstaForex Company at http://instaforex.com

Re: InstaForex Analysis

Forex Analysis & Reviews: Forecast for EUR/USD on January 24, 2023

Investors are stubbornly buying stock market instruments and bringing confusion to the related currency market. Yesterday, the S&P 500 gained 1.19% and the euro gained 15 pips. There is a double divergence on the daily chart, but the market's desire to change this technical pattern is obvious. The 1.0990 target is getting closer.

https://forex-images.ifxdb.com/userfiles/20230124/analytics63cf4818b52d4.jpg

The eurozone business activity indicator for January will be released this afternoon, the forecast is 50.2 points against 49.8 in December. In the US, this indicator may also show growth (the forecast is 45.0 vs. 44.7 previously), but manufacturing PMI is expected to weaken to 46.0 from 46.2 in December, while in Germany the Manufacturing PMI is expected to rise to 47.9 from 47.1. The euro can take advantage of this divergence.

On the four-hour chart, the upward trend is still present - the price is above the indicator lines and the Marlin is in a rising position. The closest signal to a downtrend will be when the price crosses the support of the MACD line, below 1.0824.

https://forex-images.ifxdb.com/userfiles/20230124/analytics63cf480ec94e4.jpg

*The market analysis posted here is meant to increase your awareness, but not to give instructions to make a trade.

Analysis are provided by InstaForex.

Read More

Best regards, PR Manager / Learn more about InstaForex Company at http://instaforex.com

Re: InstaForex Analysis

Forex Analysis & Reviews: Technical Analysis of Intraday Price Movement of Crude Oil Commodity Asset, Wednesday January 25, 2023.

https://forex-images.ifxdb.com/userfiles/20230125/analytics63d0790052ca3.jpg

On the 4th hour chart Crude Oil commodity asset seems that there is a discrepancy between the price movement and the Awesome Oscillator indicator which confirms that in the near future there will be a downward movement below the 79.66 level which is the Equal Low level so that if this level is successfully broken below then the 78.12 level will be the next target to be tested but if on the way down suddenly #CL turned up and penetrated the 82.62 level,it is very likely that the decline scenario that has been described will become invalid and cancel itself.

*The market analysis posted here is meant to increase your awareness, but not to give instructions to make a trade.

Analysis are provided by InstaForex.

Read More

Best regards, PR Manager / Learn more about InstaForex Company at http://instaforex.com

Re: InstaForex Analysis

Forex Analysis & Reviews: Forecast for EUR/USD on January 27, 2023

Yesterday, the euro failed to move towards the 1.0990 target and rolled back to Wednesday's initial positions. If today's U.S. consumer income/expenditure data is close to the forecast, the 1.0990 target will be much closer.

https://forex-images.ifxdb.com/userfiles/20230127/analytics63d3376fe626b.jpg

Consumer spending for December is expected to be down 0.1%, while income is expected to be up 0.2% after a 0.4% gain in November.

As before, the probability of forming a divergence between the price and the Marlin oscillator with the consequent reversal of the price into a medium-term decrease remains.

https://forex-images.ifxdb.com/userfiles/20230127/analytics63d3375dc703b.jpg

On the four-hour chart, the price returned above the MACD indicator line after a brief (and false) move below it. The same false movement was made by the Marlin oscillator yesterday. Currently, there is growth. Expect the day to close above Wednesday's closing level.

*The market analysis posted here is meant to increase your awareness, but not to give instructions to make a trade.

Analysis are provided by InstaForex.

Read More

Best regards, PR Manager / Learn more about InstaForex Company at http://instaforex.com

Re: InstaForex Analysis

Forex Analysis & Reviews: Technical Analysis of Daily price movement of GBP/USD Main Currency Pairs, Monday January 30, 2023

https://forex-images.ifxdb.com/userfiles/20230130/analytics63d7124dd075b.jpg

If we look at the daily chart for the main GBP/USD currency pair, then there will be some interesting things:

1. The appearance of the Double Top Pattern (Yellow circle).

2. Deviations appear between price movements and the MACD indicator.

3. The appearance of Bearish 123 pattern.

Based on the three facts above then in a few days ahead Cable has the potential to go down trying to break below the level 1,2262 as the main target to be tested if this level managed to break then 1,2086 will be the next target to be tested while on the way to these levels is not a upward correction which exceeds the 1.2447 level because if this level is successfully penetrated upwards then it is very likely that the decline scenario described earlier will become invalid and automatically cancel itself.

*The market analysis posted here is meant to increase your awareness, but not to give instructions to make a trade.

Analysis are provided by InstaForex.

Read More

Best regards, PR Manager / Learn more about InstaForex Company at http://instaforex.com

Re: InstaForex Analysis

Forex Analysis & Reviews: Forecast for AUD/USD on January 31, 2023

The Australian dollar lost 47 points yesterday, it led losses, but technically there are no signs of a trend reversal yet. We just assume that the price broke off from the MACD indicator line, and now it is about to do that. There is a chance that the price will meet the MACD line near its intersection with the support level of 0.6873 (low of January 19, low of August 5, 2022).

https://forex-images.ifxdb.com/userfiles/20230131/analytics63d87d76e389a.jpg

The aussie fell this morning due to weak retail sales in December, which were down 3.9% vs. the forecast of -0.3%. A little later, the Chinese manufacturing activity index for January of 50.1 points against December's 47.0 points stopped the AUD/USD decline.

https://forex-images.ifxdb.com/userfiles/20230131/analytics63d87d83e07a1.jpg

On the four-hour chart, the price settled below the MACD line. Also, the price overcame the support of the local low of January 25 (gray oval). The Marlin oscillator is in the area of the downtrend. We wait for the results of tomorrow's Federal Reserve meeting.

*The market analysis posted here is meant to increase your awareness, but not to give instructions to make a trade.

Analysis are provided by InstaForex.

Read More

Best regards, PR Manager / Learn more about InstaForex Company at http://instaforex.com

Re: InstaForex Analysis

Forex Analysis & Reviews: Technical Analysis of Intraday Price Movement of Gold Commodity Asset, Wednesday February 01 2023

https://forex-images.ifxdb.com/userfiles/20230201/analytics63d9bd4e987db.jpg

On the 4-hour chart, it can be seen that this commodity asset is being held back by the Resistance level at 1930.52 so that in the near future it has the potential to depreciate to the level of 1900.38 where this has also been confirmed by the MA 10 which is below the MA 20 plus price movements inside the channel which go down indicated that the sellers were dominating the previous buyers. However, please pay attention if on the way down, this commodity asset suddenly reverses up and breaks the level of 1934.50, then it is very likely that the downward scenario described earlier will cancel itself.

*The market analysis posted here is meant to increase your awareness, but not to give instructions to make a trade.

Analysis are provided by InstaForex.

Read More

Best regards, PR Manager / Learn more about InstaForex Company at http://instaforex.com

Re: InstaForex Analysis

Forex Analysis & Reviews: AUDUSD Potential for Bullish rise to previous swing high


https://forex-images.ifxdb.com/userfiles/20220706/analytics62c4ffed07a5a_source!.jpg


Description :
Looking at the H4 chart, my overall bias for AUDUSD is bullish due to the current price being above the Ichimoku cloud, Looking for a buy entry at 0.71277 where the pullback entry and the 1st resistance level. We are looking to take profit at 0.72775, where the previous swing high is and -27.2% Fibonacci line. Stop loss will be placed at 0.69753 where the recent swing low support is.


Trading Recommendation


Entry: 0.71277


Reason for Entry: Ichimoku cloud + price momentum


Take Profit: 0.72775


Reason for Take Profit:


Previous swing high resistance


Stop Loss: 0.69753


Reason for Stop Loss:


recent swing low support


*The market analysis posted here is meant to increase your awareness, but not to give instructions to make a trade.


Analysis are provided byInstaForex.


Read More

Best Regards,PR Manager
InstaForex Companies Group

Re: InstaForex Analysis

Forex Analysis & Reviews: Forecast for USD/JPY on February 3, 2023


The Japanese yen got a little stronger after the meetings of the three major central banks, but it only strengthened the neutral position and uncertainty, since it is technically staying between the two lines of the price channel at 127.30 and 129.97.


https://forex-images.ifxdb.com/userfiles/20230203/analytics63dc71bd5bd4b.jpg


The signal line of the Marlin oscillator is in the negative zone, but it has not yet reached the bottom of its own ascending channel (turquoise). Considering the fact that the dollar has been rising against European currencies and the stock market is also rising, I believe that the price will climb above the resistance of 129.97. Then the price may overcome the resistance of the MACD line (131.72), and logically, the breakthrough will end by reaching the resistance of 133.74. The alternative scenario assumes overcoming the support at 127.30 and falling further to the underlying price channel line at 124.10.


https://forex-images.ifxdb.com/userfiles/20230203/analytics63dc71ae759ce.jpg


On the four-hour chart, the price is consolidating under the balance and MACD indicator lines, the Marlin oscillator is rising in the territory of the downtrend with the possible intention to move to the green zone. Let's wait for the resolution of the uncertainty when the US employment data comes out this evening.


*The market analysis posted here is meant to increase your awareness, but not to give instructions to make a trade.


Analysis are provided byInstaForex.


Read More

Best Regards,PR Manager
InstaForex Companies Group

Re: InstaForex Analysis

Forex Analysis & Reviews: Technical Analysis of Daily Price Movements of CAD/JPY Commodity Currency Pairs, Monday February 06 2023.

https://forex-images.ifxdb.com/userfiles/20230206/analytics63e06f950a699.jpg

With the success of the CAD/JPY Commodity currency pair breaking above its Penant pattern which was followed by a deviation from the MACD Histogram indicator with price movements that were also above the Moving Average movement, we can conclude that Buyers are starting to return to CAD/JPY which will make this commodity currency pair have the potential to appreciate and rally upwards in the next few days to test the equal high level (liquidity gathering place) at 101.14 and 105.71 will be the targets of both, but if on the way to these target levels there is one and another thing that makes this currency pair return to its original bias (Bearish), especially if it manages to break below the 95.30 level, the upward rally scenario described earlier will become invalid and cancel itself.

*The market analysis posted here is meant to increase your awareness, but not to give instructions to make a trade.

Analysis are provided by InstaForex.

Read More

Best regards, PR Manager / Learn more about InstaForex Company at http://instaforex.com

Re: InstaForex Analysis

Forex Analysis & Reviews: Forecast for EUR/USD on February 7, 2023

Yesterday, the euro managed to overcome the support of the 1.0758/87 target range as well as the MACD line, which has already been embedded. Now the nearest target is 1.0660, followed by 1.0595. The range of these levels represents the consolidation of December.

https://forex-images.ifxdb.com/userfiles/20230207/analytics63e1b6c78ab84.jpg

Traditionally, there is a correction after a sharp downtrend, afterwards, the pair will enter growth in the medium-term. It is possible for the pair to enter a bullish correction from the range of 1.0595-1.0660.

https://forex-images.ifxdb.com/userfiles/20230207/analytics63e1b6a83b418.jpg

On the four-hour chart, the price has settled under the lower limit of the 1.0758/87 range, the signal line of the Marlin oscillator slightly turned up, and this range will probably be tested. I expect EUR/USD to fall further.

*The market analysis posted here is meant to increase your awareness, but not to give instructions to make a trade.

Analysis are provided by InstaForex.

Read More

Best regards, PR Manager / Learn more about InstaForex Company at http://instaforex.com

Re: InstaForex Analysis

Forex Analysis & Reviews: Technical Analysis of Intraday Price Movements of USD/MXN currency pairs, Wednesday 08 February 2023.

https://forex-images.ifxdb.com/userfiles/20230208/analytics63e2eb17ba97d.jpg

After succesfully break above the level 19,104 and after that USD/MXN currency pairs halted by the upward movement by the Dynamic Resistance (MA 200). Now USD/MXN is falling back down to test the 18,762 level. If this level is able to withstand the downward trend of USD/MXN, this currency pair has the potential to rise again if during a downward correction. there was no significant decline that passed below the 18,672 level where if this level was not broken then USD/MXN would have the potential to rally again up to the 19,213-19,398 area level as the first target and the 19,639-19,900 area level as the second target.

*The market analysis posted here is meant to increase your awareness, but not to give instructions to make a trade.

Analysis are provided by InstaForex.

Read More

Best regards, PR Manager / Learn more about InstaForex Company at http://instaforex.com

Re: InstaForex Analysis

Forex Analysis & Reviews: USDJPY analysis for February 9th, 2023.

https://forex-images.ifxdb.com/userfiles/20230209/analytics63e4f6f6e6d4f.jpg

Yellow rectangle- support area
Green lines- expected path
Violet lines- Fibonacci retracement levels

USDJPY as expected has pulled back and closed the open gap from Monday's open. Price so far follows our expected price path towards 129.90-130.60 area where we expect to finish the counter trend move. Price is now testing the 50% Fibonacci retracement once again. This time expect to see a move below the 50% retracement towards the 61.8% level which is key support. We usually see trend reversals if price respects the 61.8% retracement. Because price formed 5 waves up from the 128 lows, I expect to see a retracement of this upward move with the formation of a higher low inside the yellow rectangle area.

*The market analysis posted here is meant to increase your awareness, but not to give instructions to make a trade.

Analysis are provided by InstaForex.

Read More

Best regards, PR Manager / Learn more about InstaForex Company at http://instaforex.com

Re: InstaForex Analysis

Forex Analysis & Reviews: Forecast for GBP/USD on February 10, 2023

My expectation that the British pound would reverse on Thursday did not materialize. On the contrary, the pound is up 50 pips. But the upper shadow is higher by 75 pips, which is a good sign of the reversal. The Fibonacci time zone tool had to be abandoned. Ideally, nothing has changed. I expect the pound to weaken along with other currencies because of the global strengthening of the dollar.

https://forex-images.ifxdb.com/userfiles/20230210/analytics63e5aa981cc9d.jpg

The pound may even go ahead of the market today, as weaker economic data is expected for the UK. Q4 GDP is forecast to show zero growth, December GDP may show a decline of 0.3%, annual GDP is expected to decline to 0.4% from the previous 1.9%, December industrial production may show a decline of 0.2%, trade balance is expected to deteriorate to -16.4 billion from the previous -15.6 billion. On the daily chart, the upper shadow pierced the resistance of 1.2155, the Marlin oscillator turned down in the downtrend zone. The nearest bearish target is 1.1933. On the four-hour chart, the growth was stopped by the MACD indicator line. Now the price has settled below 1.2155 and under the red balance line. Marlin turned down. So, we are waiting for today's UK reports and the pound to fall.

https://forex-images.ifxdb.com/userfiles/20230210/analytics63e5aa87cf301.jpg

*The market analysis posted here is meant to increase your awareness, but not to give instructions to make a trade.

Analysis are provided by InstaForex.

Read More

Best regards, PR Manager / Learn more about InstaForex Company at http://instaforex.com

Re: InstaForex Analysis

Forex Analysis & Reviews: Forecast for EUR/USD on February 13, 2023

The euro fell by 62 points on Friday. The price is very close to 1.0660, the upper limit of the consolidation range of December 16-26. Overcoming the support can push the price to 1.0595, it can fall further to the target level of 1.0470, the lows of June 22 and April 28, 2022. Also, this level is close to the 38% retracement of the entire growth since September 28.

https://forex-images.ifxdb.com/userfiles/20230213/analytics63e9a2a97c29c.jpg

The price has overcome the support of the balance and MACD indicator lines, the Marlin oscillator is declining in the red zone - a blatant downtrend.

https://forex-images.ifxdb.com/userfiles/20230213/analytics63e9a29c1f3f9.jpg

On the four-hour chart, the price shows signs of consolidation before reaching the support of 1.0660, the Marlin has settled in the area of the downtrend. We can also see the price in preparation as it falls further.

*The market analysis posted here is meant to increase your awareness, but not to give instructions to make a trade.

Analysis are provided by InstaForex.

Read More

Best regards, PR Manager / Learn more about InstaForex Company at http://instaforex.com

Re: InstaForex Analysis

Forex Analysis & Reviews: Forecast for EUR/USD on February 14, 2023

The market was calm on Monday, without any upbeat news, the euro could not overcome the technical support at 1.0660, yesterday's growth was 45 pips. The euro continued to move sideways in the 1.0660-1.0758 range.

https://forex-images.ifxdb.com/userfiles/20230214/analytics63eaf2c7ed777.jpg

The best thing that the euro can do for the bearish scenario is to pierce the upper limit of the 1.0758/87 range. If the euro settles above the MACD line (above 1.0820), the alternative option is for the price to rise to 1.0990. I expect the price to cross 1.0660 and fall further to 1.0595.

https://forex-images.ifxdb.com/userfiles/20230214/analytics63eaf2b0011f2.jpg

On the four-hour chart, the signal line of the Marlin oscillator is in the green zone. This will help the price and if it doesn't overcome the nearest resistance, then it will linger in the sideways movement. At the moment, time is not on the euro's side, since the MACD line is getting closer to the price with each candle, and it increases the pressure.

*The market analysis posted here is meant to increase your awareness, but not to give instructions to make a trade.

Analysis are provided by InstaForex.

Read More

Best regards, PR Manager / Learn more about InstaForex Company at http://instaforex.com

Re: InstaForex Analysis

Forex Analysis & Reviews: Technical Analysis of Daily Price Movement of USD Currency Index, Wednesday February 15 2023.

https://forex-images.ifxdb.com/userfiles/20230215/analytics63ec3d83561cf.jpg

On the daily chart of the USD Dollar Index, it can be seen that there was a trendline break (TLB) condition on the CCI (14) indicator which was previously in a bear condition where the Chop Zone (CZ) indicator (levels 100 & -100) was red but after that TLB and CCI move above level 0, so CZ changes color to cyan blue and now the CCI histogram (14) has turned green, followed by Sidewinder color (levels 200 & -200) changes color to yellow (volatile/Trending) and green (very volatile / trending) so that in the future USDX has the potential to be Bullish appreciated going up to the 103.96 level as the first target and the 105.63 level as the second target but before that it seems that USDX will be corrected down to test the 102.19 level and as long as this level is strong enough to hold back the pace correction and does not exceed the level of 100.82, USDX has the potential to strengthen again where this can be seen at CCI 914) is trying to form Zero Line Reject (ZLR) pattern.

*The market analysis posted here is meant to increase your awareness, but not to give instructions to make a trade.

Analysis are provided by InstaForex.

Read More

Best regards, PR Manager / Learn more about InstaForex Company at http://instaforex.com

Re: InstaForex Analysis

Forex Analysis & Reviews: Forecast for GBP/USD on February 16, 2023

Pound fell by 140 pips as sellers became active yesterday due to the weaker-than-expected inflation data. It indicated that core CPI fell from 12.9% y/y to 12.6% y/y in January.

https://forex-images.ifxdb.com/userfiles/20230216/analytics63ed943684d05.jpg

There was a price reversal on the daily (D1) timeframe, both from the MACD line and the Marlin oscillator. This means that traders have to take the target level of 1.1900 in order to open the way towards 1.1737.

https://forex-images.ifxdb.com/userfiles/20230216/analytics63ed941308d8e.jpg

On the four-hour (H4) timeframe, the price has consolidated under the balance and MACD lines, while the Marlin oscillator consolidated in the area of the downward trend. This indicates that there will be a further downward move in GBP/USD.

*The market analysis posted here is meant to increase your awareness, but not to give instructions to make a trade.

Analysis are provided by InstaForex.

Read More

Best regards, PR Manager / Learn more about InstaForex Company at http://instaforex.com

Re: InstaForex Analysis

Forex Analysis & Reviews: USDCAD Potential for Bullish Rise to 61.8% Fibonacci line

https://forex-images.ifxdb.com/userfiles/20230217/analytics63ef476e8f974.jpg

Description :
Looking at the H4 chart, my overall bias for USDCAD is bullish as the current price is above the Ichimoku Cloud. Looking for a pullback buy entry at 1.34295 where the 38.2% Fibonacci line is. We are looking to take profit at 1.35352 where the 61.8% Fibonacci line is, Stop loss will be placed at 1.33638, where the recent swing low is.

Trading Recommendation
Entry: 1.34295
Reason for Entry: 38.2%
Fibonacci line
Take Profit: 1.35352
Reason for Take Profit:
61.8% Fibonacci line
Stop Loss: 1.33638
Reason for Stop Loss:
the recent swing low

*The market analysis posted here is meant to increase your awareness, but not to give instructions to make a trade.

Analysis are provided by InstaForex.

Read More

Best regards, PR Manager / Learn more about InstaForex Company at http://instaforex.com

Re: InstaForex Analysis

Forex Analysis & Reviews: Forecast for EUR/USD on February 20, 2023

The 60-pip decline of EUR/USD last Friday could not be extended. This is because the pair closed with a small white candle, and this morning went back to the range it was trading at last February 16. Although indicator readings have not changed over the past two days, it seems that euro is preparing to overcome the support level of 1.0660.

https://forex-images.ifxdb.com/userfiles/20230220/analytics63f2dbae52458.jpg

If that happens, the way towards the target level of 1.0470 will be easier. Market players should look out for the exit of the signal line of the Marlin oscillator, which is marked on the daily (D1) chart with a gray rectangle.

https://forex-images.ifxdb.com/userfiles/20230220/analytics63f2db9f4e2fb.jpg

On the four-hour (H4) chart, Friday's growth was stopped by the resistance of the balance and MACD lines. The signal line of the oscillator is also turning down, and although there was a similar pattern of simultaneous reversal of the price and the oscillator from last Thursday, the signal this time may turn out to be more significant.

*The market analysis posted here is meant to increase your awareness, but not to give instructions to make a trade.

Analysis are provided by InstaForex.

Read More

Best regards, PR Manager / Learn more about InstaForex Company at http://instaforex.com

Re: InstaForex Analysis

Forex Analysis & Reviews: Forecast for GBP/USD on February 21, 2023

GBP/USD closed on Monday at Friday's closing levels. Then, this morning, there is a slightly bearish sentiment, which turned the Marlin oscillator in the daily (D1) timeframe down, pushing it towards a negative territory.

https://forex-images.ifxdb.com/userfiles/20230221/analytics63f42cb535182_source!.jpg

It seems that hitting the target level of 1.1900 is becoming more and more plausible. If that happens, the pair will head towards 1.1737, which is the top last September 13, 2022. A price movement below the balance and MACD lines will keep the trend bearish.

But on the four-hour (H4) chart, the pair continues a sideways movement, right between the balance and MACD lines.

https://forex-images.ifxdb.com/userfiles/20230221/analytics63f42ce20266d_source!.jpg

The signal line of the Marlin oscillator is reversing from zero, indicating that it is going to test the MACD line (1.1989), which is also the low last February 15. If it succeeds, the pair will decline further to the target support level of 1.1900.

This information is provided to retail and professional clients as part of marketing communication. It does not contain and should not be construed as containing investment advice or investment recommendation or an offer or solicitation to engage in any transaction or strategy in financial instruments. Past performance is not a guarantee or prediction of future performance. Instant Trading EU Ltd. makes no representation and assumes no liability as to the accuracy or completeness of the information provided, or any loss arising from any investment based on analysis, forecast or other information provided by an employee of the Company or otherwise. Full disclaimer is available here.

Risk Warning: CFDs are complex instruments and come with a high risk of losing money rapidly due to leverage. 77.95% of retail investor accounts lose money when trading CFDs with this provider. You should consider whether you understand how CFDs work and whether you can afford to take the high risk of losing your money.

Analysis are provided by InstaForex.

Read More

Best regards, PR Manager / Learn more about InstaForex Company at http://instaforex.com

Posts: 1,251 to 1,275 of 1,547

Pages Previous 1 49 50 51 52 53 62 Next

You must login or register to post a reply

Forex Software → Market Analysis → InstaForex Analysis

Similar topics in this forum