forex software

Create and Test Forex Strategies

forex software

Skip to forum content

Forex Software

Create and Test Forex Strategies

You are not logged in. Please login or register.


(Page 54 of 62)

Forex Software → Market Analysis → InstaForex Analysis

Pages Previous 1 52 53 54 55 56 62 Next

You must login or register to post a reply

RSS topic feed

Posts: 1,326 to 1,350 of 1,547

Re: InstaForex Analysis

Forex Analysis & Reviews: GBP/USD. Overview for May 3. Market sentiment is changing to "bearish"

https://forex-images.ifxdb.com/userfiles/20230503/analytics6451a5f154f3d_source!.jpg

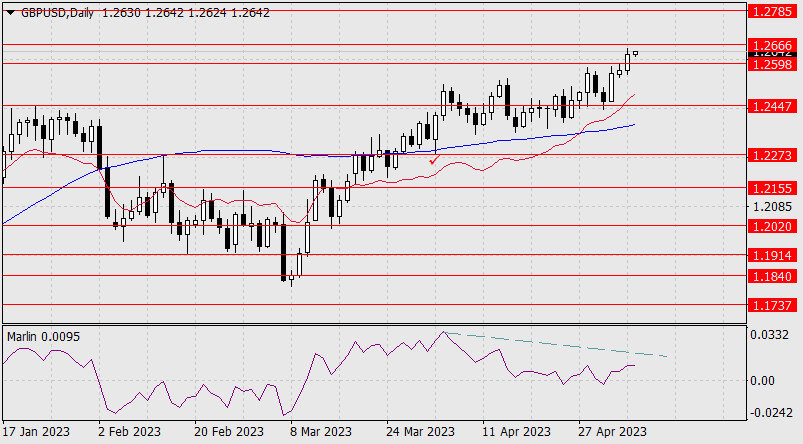
The GBP/USD currency pair continued its not-too-strong decline for most of the day on Tuesday. All the week's most important events are still ahead, so the market is in no hurry to rush into opening trading deals. Moreover, the ECB and FRS decisions, likely to be announced on Wednesday and Thursday, have already been factored into the market. This means we may see sharp spikes in activity these days without significant changes in currency pair rates. In the case of the British pound, there has been uncorrected growth for two months. Uncorrected, not unstoppable, as the upward trend has weakened in recent weeks. The pound moved up with its last strength. The pain of the bulls, who desperately wanted to maintain the upward trend and interpreted almost every report favoring the pound, was visible. Still, at the same time, they received an extremely small number of real factors supporting the British currency. In any case, the pound has grown by 700 points in 2 months, and almost everything shows that a strong correction should begin in the 4-hour timeframe.

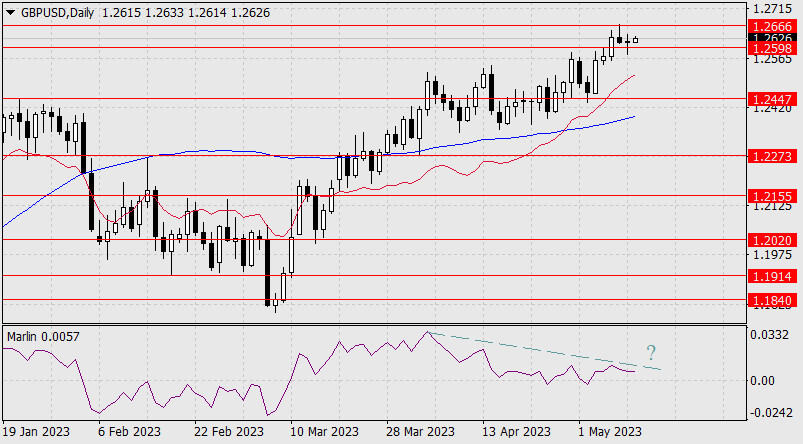
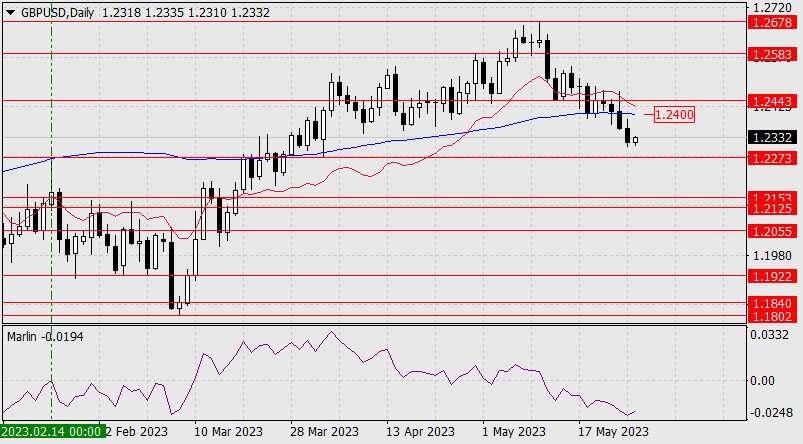
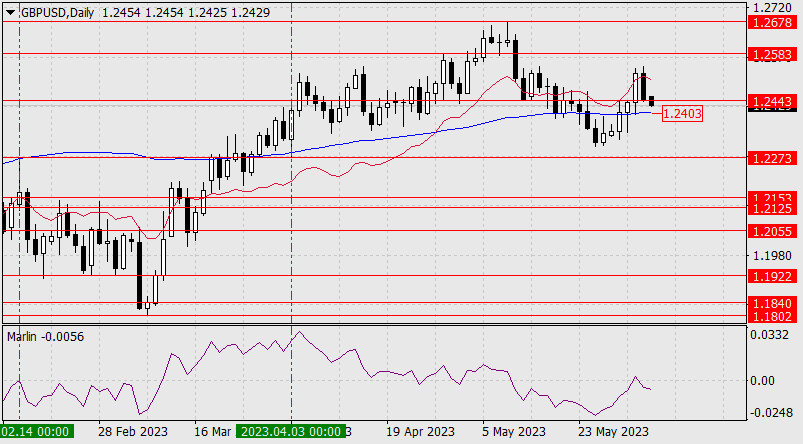
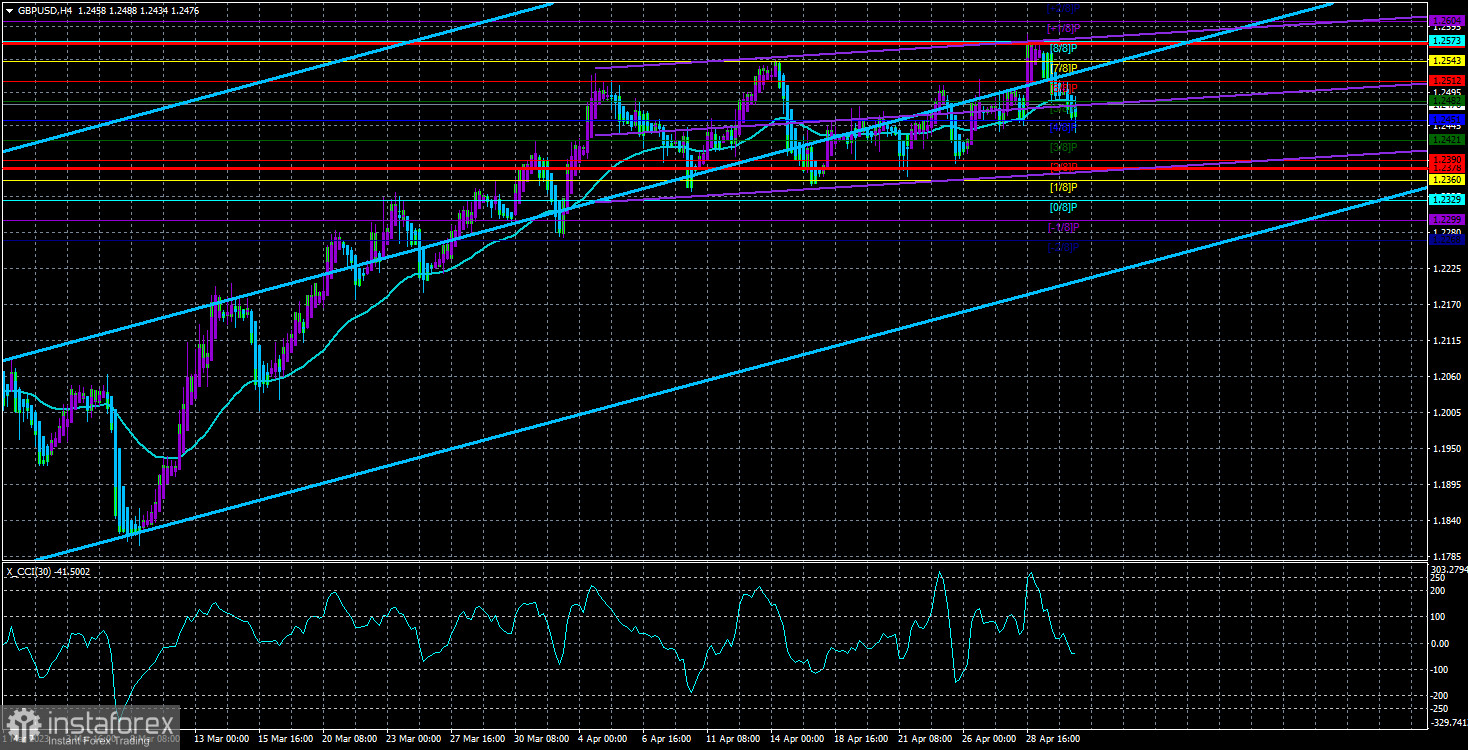
On the 24-hour timeframe, it should also begin and be stronger than on the 4-hour. On the daily chart, about 2200 points were passed upward, implying a significant correction. Of course, making such conclusions on the eve of three central bank meetings is presumptuous, but if we see unprovoked growth in both pairs again at the end of this and next week, it will be too much. The market cannot be forbidden to trade in any direction, even if there are no reasons for it. But in this case, you can close your eyes to fundamental and macroeconomic analysis. What's the point if the market doesn't pay attention to it? The price has once again consolidated below the moving average line, which we have observed for the last two months at least seven times. No decline started after any of these overcomes. The CCI indicator has already entered the overbought area twice, which is a strong sell signal, so we continue to expect a powerful drop in the British pound.

The US labor market continues to shrink.

We would like to note one significant moment from yesterday, which may mean a change in market sentiment to "bearish." In the second half of the day, the JOLTs report on the number of job openings in the US labor market was released, which again turned out to be worse than the forecast value - 9.59 million against 9.775 million. The number of job openings has been falling for three months, which means a deterioration in the atmosphere of the labor market. We may see weaker reports on nonfarm payrolls and unemployment on Friday than currently expected. But that's not important. The US dollar practically did not fall immediately after the publication of this report. Earlier, traders would have had enough for the American currency to lose 60–80 points. On Tuesday, it lost 50 but quickly tried to return to its original path - to the south.

This moment indicates that the market is refusing further purchases, regardless of the decisions made by the FRS and ECB. Of course, this conclusion is quite risky, but simultaneously, the pair cannot constantly move in one direction. Sooner or later, a turning point must come. Why not a day before the FRS meeting and a week before the Bank of England meeting? After all, surprises are unlikely, and in the case of the BoE, we may see a refusal to tighten policy for the first time in a long time. We believe that the rate will be raised once again, as inflation is still above 10%, but at the same time, we believe that one or two more increases - and this cycle will be completed regardless of the current inflation rate. The pound, like the euro, is losing one of its main support factors, of which there have been few recently.

https://forex-images.ifxdb.com/userfiles/20230503/analytics6451a5fc4f844_source!.jpg

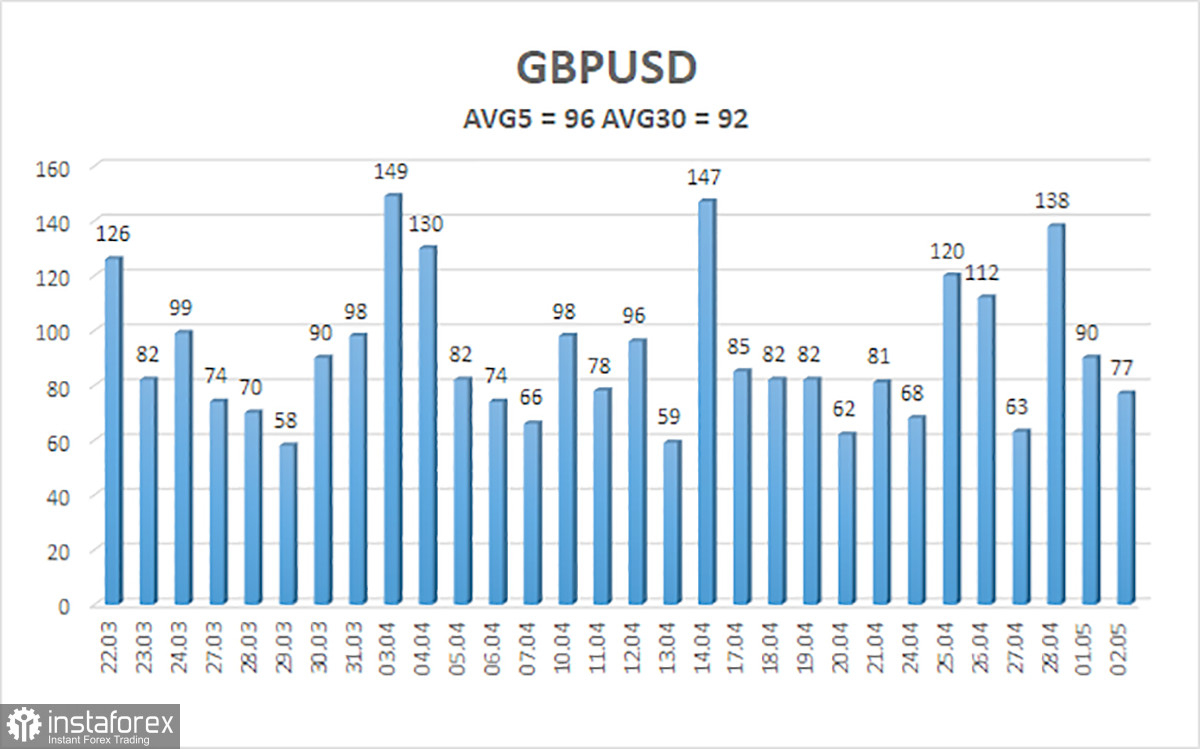
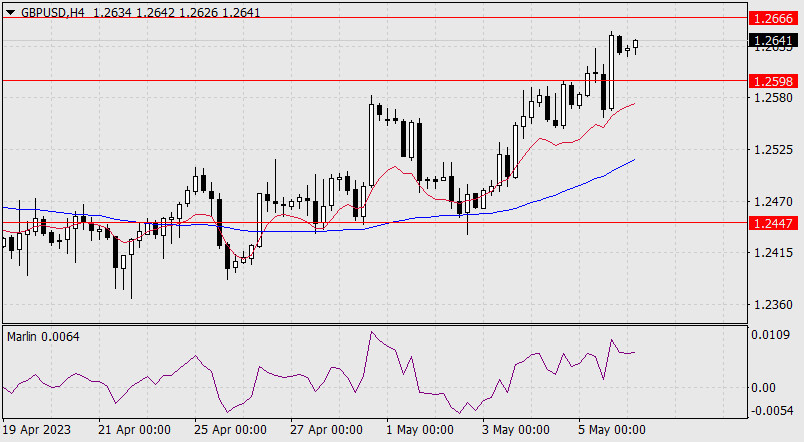
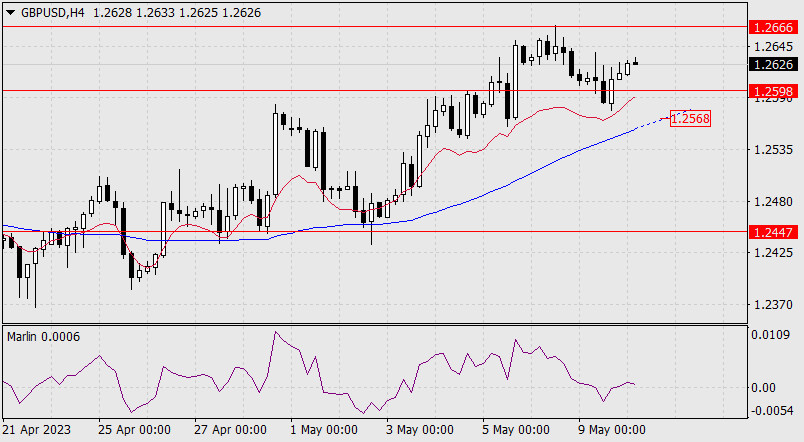
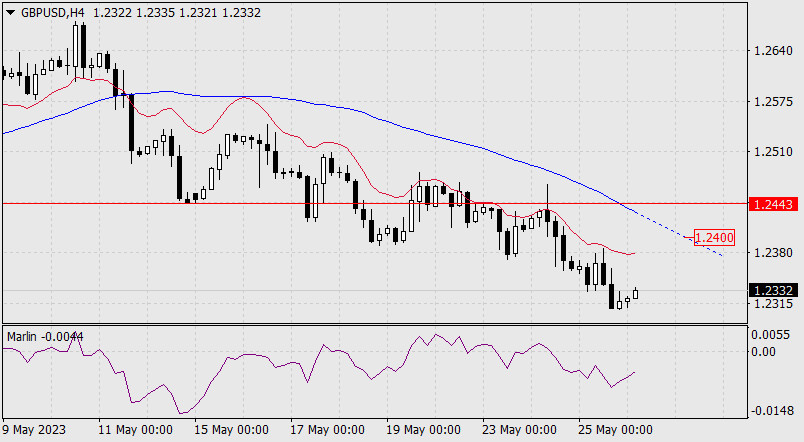
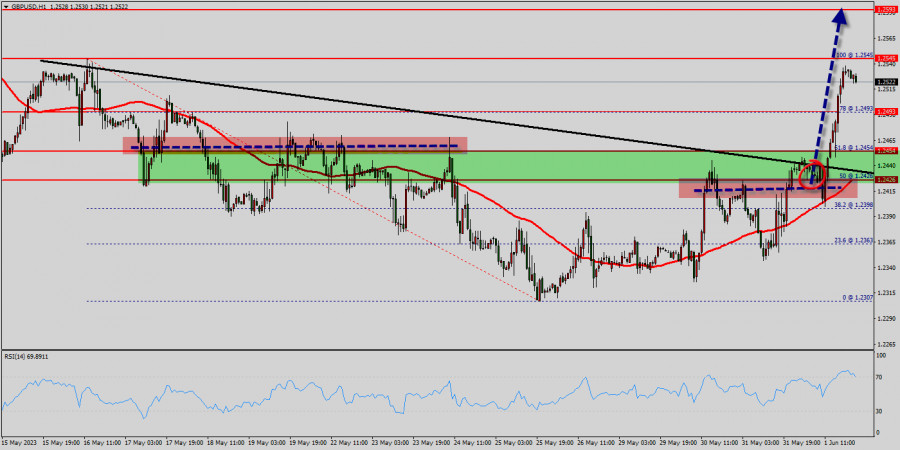
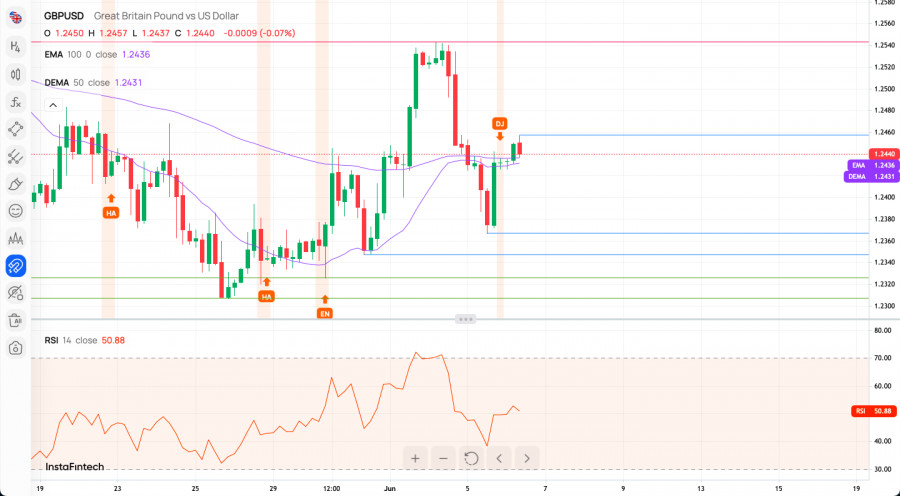
The average volatility of the GBP/USD pair over the last five trading days is 96 points. For the pound/dollar pair, this value is considered "average." On Wednesday, May 3, we thus expect the movement within the channel to be limited by levels 1.2378 and 1.2572. A reversal of the Heiken Ashi indicator upward will signal a new round of upward movement.

Nearest support levels:
S1 – 1.2451
S2 – 1.2421
S3 – 1.2390
Nearest resistance levels:
R1 – 1.2482
R2 – 1.2512
R3 – 1.2543

Trading recommendations:
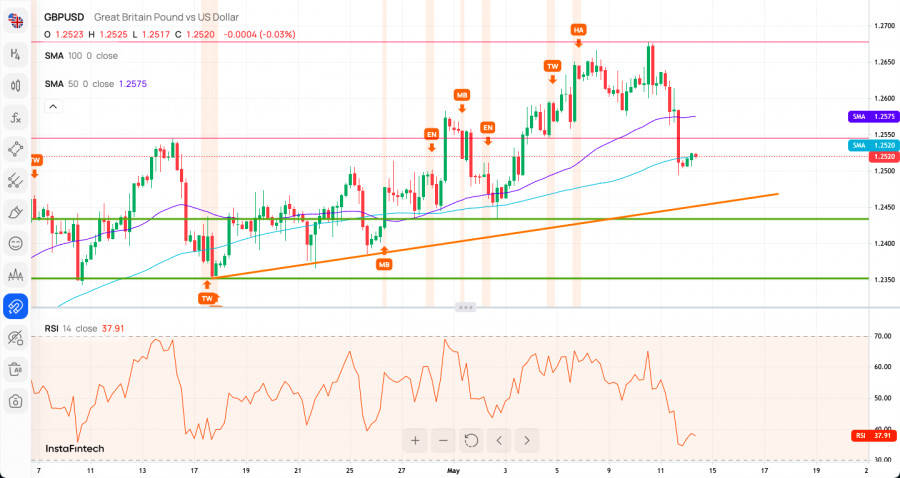
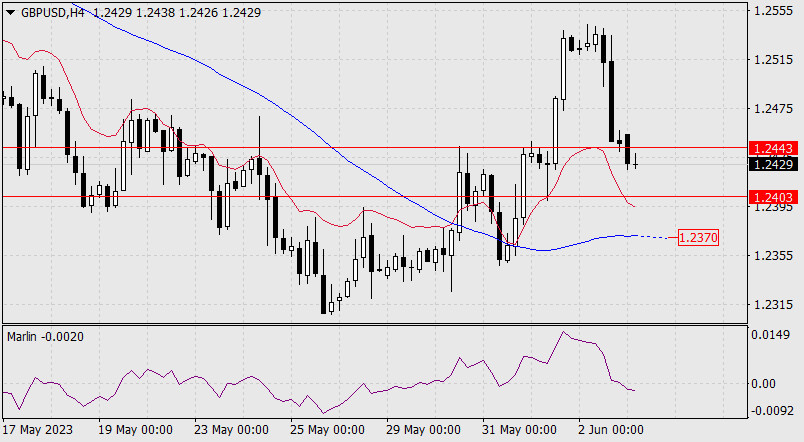
The GBP/USD pair in the 4-hour timeframe has corrected to the moving average. Sideway movement may resume again, as in recent weeks, we often observe flat rather than a trend. Trading can be done again only by reversing the Heiken Ashi indicator or on younger timeframes. Explanations of illustrations:
Linear regression channels - help determine the current trend. If both are directed in one direction, the trend is currently strong.
Moving average line (settings 20.0, smoothed) - determines the short-term trend and the direction in which it is now advisable to trade.
Murray levels - target levels for movements and corrections.
Volatility levels (red lines) - the likely price channel the pair will spend the next day, based on current volatility indicators.
CCI indicator - its entry into the oversold area (below -250) or overbought area (above +250) means that a trend reversal is approaching in the opposite direction.

Analysis are provided by InstaForex.

Read More

Best regards, PR Manager / Learn more about InstaForex Company at http://instaforex.com

Re: InstaForex Analysis

Forex Analysis & Reviews: USD/JPY analysis for May 04, 2023 - Potential for the further downside movement

https://forex-images.ifxdb.com/userfiles/20230504/analytics64534c6186a25_source!.jpg

USD/JPY has been trading downside as I expected and the first upside objective has been reached at 135.00. Anyway, I see potential for the lower prices towards 133.35.

Due to the strong downside momentum and no signs for the reversal, I see potential for the further downside movement towards lower reference.

Next major downside objective is set at the price of 133.35

MACD is showing negative reading, which is sign that sellers are still in control.

Intraday resistance is set at the price of 135.00

Analysis are provided by InstaForex.

Read More

Best regards, PR Manager / Learn more about InstaForex Company at http://instaforex.com

Re: InstaForex Analysis

Forex Analysis & Reviews: Forecast for EUR/USD on May 5, 2023

EUR/USD
Yesterday, the European Central Bank raised the rate by the expected 0.25%, and ECB President Christine Lagarde "promised" another increase around September. In general, the ECB's mood cooled investors' expectations, and the euro fell by 46 points.

https://forex-images.ifxdb.com/userfiles/20230505/analytics64546dddd7d6e_source!.jpg

Yesterday, the Marlin oscillator managed to record a low below the zero line (-0.0003), which, for a market with moderate volatility, shows the effective desire for the asset. The price needs to consolidate below 1.1033, which is easy to do with today's employment report since there's a possibility that it may exceed expectations. The euro's target is the convergence area of the MACD line with the embedded line of the descending price channel at 1.0920.

https://forex-images.ifxdb.com/userfiles/20230505/analytics64546dea19b38_source!.jpg

On the four-hour chart, the price has not yet been able to consolidate below the MACD indicator line – the volatility after the ECB meeting is making itself felt. Also, the Marlin oscillator did not stay in negative territory.

I believe that today's US employment report will turn out to be better than forecasts, as the preceding indicators this week indicate an improvement in the labor market. This is a sharp increase in employment in the private sector (296,000 versus a forecast of 148,000), a sharp decrease in the number of layoffs according to Challenger data, and a normalization of unemployment benefit claims (albeit above average).

And such an important point – three major American banks: PacWest Bancorp, Western Alliance Bancorp, Metropolitan are at risk of bankruptcy in the coming days, with KeyCorp, Valley National Bancorp, and a number of small banks approaching. The stock market is no longer able to grow at a rate of 5.25% (especially the banking sector), S&P 500 is falling heavily for the third straight day (yesterday -0.72%), so the counter-dollar currencies are unlikely to rise even with neutral macro data.

Analysis are provided by InstaForex.

Read More

Best regards, PR Manager / Learn more about InstaForex Company at http://instaforex.com

Re: InstaForex Analysis

Forecast for GBP/USD on May 8, 2023

GBP/USD
On Friday, the British pound chose an alternative scenario with a short-term perspective – on quite good data on US employment, it overcame the resistance of 1.2598 and approached the target level of 1.2666. Now the whole question is in the level of divergence slope by the Marlin oscillator. The price may continue to rise to the second target of 1.2785, and the divergence will not be obstructed.

https://forex-images.ifxdb.com/userfiles/20230508/analytics64585fab247a2.jpg

This target level is the average value of the extremes of June 2020 and November 2019. Such a scenario can be realized if the price consolidates above 1.2666. If the price consolidates below 1.2598, the pound will make additional efforts to reach 1.2447.

https://forex-images.ifxdb.com/userfiles/20230508/analytics64585f9760b51.jpg

On the four-hour chart, the price, indicators, and oscillator are growing. The bullish sentiment is optimistic, and we can only wait for the price to consolidate above 1.2666. The probability of implementing the described scenarios is equal.

Analysis are provided by InstaForex.

Read More

Best regards, PR Manager / Learn more about InstaForex Company at http://instaforex.com

Re: InstaForex Analysis

Forecast for EUR/USD on May 9, 2023

EUR/USD
As of today, the euro clearly correlates with the yields of US government bonds, which are growing and pulling the single currency down. But for more reliable conditions for the euro's medium-term decline, it lacks other correlating instruments - commodities or the stock market, which are still growing. Other counter-dollar currencies are also not in a hurry to reverse.

https://forex-images.ifxdb.com/userfiles/20230509/analytics6459b4ea9dca3.jpg

On the daily chart, the price is moving towards the important support of 1.0910, and consolidating below it may indicate a break in the uptrend from March 16th. The 1.0804 target will become available. The signal line of the Marlin oscillator is in negative territory - in the downtrend area. At the moment, the euro has not fallen deep enough to prevent it from reversing and working through the range of 1.1078-1.1110.

On the four-hour chart, the price has once again consolidated below the indicator lines, with Marlin in the area of the downtrend. If signals from related markets support the dollar, this time these technical signals will be effective.

https://forex-images.ifxdb.com/userfiles/20230509/analytics6459b4f752e8c.jpg

Analysis are provided by InstaForex.

Read More

Best regards, PR Manager / Learn more about InstaForex Company at http://instaforex.com

Re: InstaForex Analysis

Forecast for GBP/USD on May 10, 2023

GBP/USD
Yesterday, the pound closed almost at Monday's closing level. The Marlin oscillator's signal line lies in a sideways trend, thereby reducing the likelihood of creating divergence from Monday's peak, which tested the target level of 1.2666.

https://forex-images.ifxdb.com/userfiles/20230510/analytics645b01c412adf.jpg

But the reversal potential is not exhausted, so consolidating below 1.2598 and overcoming yesterday's low of 1.2577 opens the target at 1.2447. On the four-hour chart, the Marlin oscillator returned to the positive area, but probably for a short time.

https://forex-images.ifxdb.com/userfiles/20230510/analytics645b01d662617.jpg

Below the level of 1.2598, there is another support – the MACD line. Overcoming it (1.2568) will remove the last obstacle for the development of a medium-term decline in the British currency.

Analysis are provided by InstaForex.

Read More

Best regards, PR Manager / Learn more about InstaForex Company at http://instaforex.com

Re: InstaForex Analysis

Forecast for USD/JPY on May 11, 2023

USD/JPY
After the price reached the target level of 135.40 on Wednesday, it returned below the price channel line (134.50). The target on the MACD indicator line is 133.03.

https://forex-images.ifxdb.com/userfiles/20230511/analytics645c581eab7e3.jpg

The Marlin oscillator approached the zero line and presents two different interpretations: either the oscillator's signal line will reverse from this zero boundary and pull the quote above 134.50 for a repeated attack on the 135.40 level, or the Marlin will move to negative territory and help the price reach the MACD line (133.03).

https://forex-images.ifxdb.com/userfiles/20230511/analytics645c58133ddbb.jpg

On the four-hour chart, the price has consolidated below 134.50 and below the indicator lines; the Marlin oscillator has returned to negative territory. All these circumstances maintain the downtrend and the main scenario of achieving the target of 133.03.

Analysis are provided by InstaForex.

Read More

Best regards, PR Manager / Learn more about InstaForex Company at http://instaforex.com

Re: InstaForex Analysis

Technical Analysis of GBP/USD for May 12, 2023

Technical Market Outlook:
The GBP/USD pair has made another new swing high at the level of 1.2678, so the key technical resistance located t 1.2666 was broken. After the new swing high was made, the Bearish Engulfing candlestick pattern was made at the top of the move, so the market pulled-back and keeps moving lower towards the technical support seen at the level of 1.2434. Please keep an eye on this level as any breakout lower might trigger the bigger correction on Pound. The weak and negative momentum in the H4 time frame chart supports the short-term bearish outlook for Pound.

https://forex-images.ifxdb.com/userfiles/20230512/analytics645ddc6050e21.jpg

Weekly Pivot Points:
WR3 - 1.27061
WR2 - 1.26746
WR1 - 1.26607
Weekly Pivot - 1.26431
WS1 - 1.26292
WS2 - 1.26116
WS3 - 1.25801

Trading Outlook:
Pound continues the corrective cycle to the upside and on the Weekly time frame chart the price is about to hit the 61% Fibonacci retracement located at the level of 1.2778. When this level is hit, the high volatility is expected, so please stay focused as the bears will defend this level strongly.

Analysis are provided by InstaForex.

Read More

Best regards, PR Manager / Learn more about InstaForex Company at http://instaforex.com

Re: InstaForex Analysis

Technical Analysis of Intraday Price Movement of GBP/JPY Cross Currency Pairs, Monday May 15, 2023

https://forex-images.ifxdb.com/userfiles/20230515/analytics64619793c5688.jpg

On the 4-hour intraday chart of the GBP/JPY cross currency pairs, a Failing Wedge pattern can be seen and the support level at 168.04 is strong enough to prevent the GBP/JPY downward correction, especially with the confirmation by the MACD indicator which is in a speculative BUY position, so there is a high probability for GBP/JPY In the near future, JPY will appreciate, rally up to the level of 171.14 as the first target and the level of 172.30 as the second target as long as it is on its way to these targets, there will be no significant downward correction, especially if it breaks below the 166.46 level because if this level is broken down, all Bull scenarios that have been previously described will become invalid and cancel by themselves.

Analysis are provided by InstaForex.

Read More

Best regards, PR Manager / Learn more about InstaForex Company at http://instaforex.com

Re: InstaForex Analysis

Forecast for EUR/USD on May 16, 2023

EUR/USD
On Monday, the euro went through a calm correction after sharply falling in the last two days. On the daily chart, there is no sign of the end of the correction, so it could continue to the resistance line of the price channel at the 1.0900 mark. It is possible to overcome this line, and then the price will be stopped by the MACD indicator line, located 15 points higher.

https://forex-images.ifxdb.com/userfiles/20230516/analytics6462eb8acfdf0.jpg

Then the price could reverse into a new wave of decline with the nearest target of 1.0804. On the 4-hour chart, the accelerated growth of the Marlin oscillator catches the eye.

https://forex-images.ifxdb.com/userfiles/20230516/analytics6462eba10afb5.jpg

This could be a sign of oscillator discharge before further subsequent decline, or the euro is waiting for a more complex correction from the new local low with the formation of convergence, as shown on the chart with dashed lines. Perhaps, until the end of the month, the euro will spend in a sideways wide-range.

Analysis are provided by InstaForex.

Read More

Best regards, PR Manager / Learn more about InstaForex Company at http://instaforex.com

Re: InstaForex Analysis

Forecast for EUR/USD on May 17, 2023

EUR/USD So, in accordance with our forecast, after sharply falling below technical supports on May 12, yesterday the price returned to one of them and went through a retest (embedded line of the price channel). It's also noticeable that on the daily chart, touching the channel line occurred at the point of contact with the balance indicator line.

https://forex-images.ifxdb.com/userfiles/20230517/analytics64644290d9a51.jpg

Now we are waiting for the price to drop to the previously indicated target of 1.0804. Falling below this level will allow the price to compete with the support of the underlying price channel line and reach the support level of 1.0736 (the peak of December 15, 2022). However, if it fails to cross support at 1.0804, the price will stay in a short-term sideways trend.

https://forex-images.ifxdb.com/userfiles/20230517/analytics6464428750795.jpg

On the four-hour chart, there was a reversal of the signal line of the Marlin oscillator from the zero line (arrow) yesterday. In general, the price is falling in a linear regression channel. We are waiting for the price at the target level of 1.0804.

Analysis are provided by InstaForex.

Read More

Best regards, PR Manager / Learn more about InstaForex Company at http://instaforex.com

Re: InstaForex Analysis

Forecast for AUD/USD on May 18, 2023

AUD/USD The Australian dollar traded within the target levels of 0.6628 and 0.6670 yesterday. The reversal of the Marlin oscillator's signal line from the zero line was confirmed (arrow) on the daily chart.

https://forex-images.ifxdb.com/userfiles/20230518/analytics64658b2c89850.jpg

Now, the probability of the price overcoming the 0.6628 support has significantly increased, and the price will soon reach the target level of 0.6567 (the low of March 8). In case of an alternative scenario, with the price surpassing 0.6670, it will continue to rise to the MACD line around the 0.6704 mark.

https://forex-images.ifxdb.com/userfiles/20230518/analytics64658b199578f.jpg

On the four-hour chart, the Marlin oscillator's signal line has turned down from the oscillator's zero line. The price is developing under the balance and MACD indicator lines. In the short term, we expect the price to overcome the 0.6628 support level according to the main scenario.

Analysis are provided by InstaForex.

Read More

Best regards, PR Manager / Learn more about InstaForex Company at http://instaforex.com

Re: InstaForex Analysis

Forecast for EUR/USD on May 19, 2023

EUR/USD
The euro did not develop a sideways movement, so as not to delay the breakthrough under the technical support level of 1.0804. Trading volumes were average, which means that the systematic buying of the dollar is underway, and the nearest big accumulation of orders is in the range of 0.0680-0.0730. Near this area is our target level of 1.0736. Consolidating below it will pave the way for 1.0636 - the underlying embedded line of the price channel, coinciding with the March 2020 low.

https://forex-images.ifxdb.com/userfiles/20230519/analytics6466dec88d556.jpg

At the moment, a potential for a correction has emerged again, its goal is the level of 1.0804. There is one reason why the euro could fall without going through a correction - increased optimism regarding the resolution of the problem with the US public debt. There is a probability that the dispute in the US government on this issue will end this weekend.

A renewed convergence was formed on the four-hour chart. Since yesterday's low coincided with the point of intersection of price channel lines of two time scales (on 4H linear regression channel), the probability of a correction has increased. This probability may significantly go down once the price settles below yesterday's low.

https://forex-images.ifxdb.com/userfiles/20230519/analytics6466debe98e5d.jpg

Analysis are provided by InstaForex.

Read More

Best regards, PR Manager / Learn more about InstaForex Company at http://instaforex.com

Re: InstaForex Analysis

EUR/USD. Week Preview. Buckle up, price turbulence expected

The EUR/USD pair failed to consolidate within the 7th figure by the end of the past week: at the end of Friday's trading, EUR/USD bulls organized a small but swift counter-attack, which led the price to rise to the level of 1.0804. The corrective pullback was due to a weakening of the US currency, which came under pressure against the backdrop of Jerome Powell's cautious rhetoric.

The Chairman of the Federal Reserve suggested that the May rate hike could be the last in the current monetary policy tightening cycle. This unexpected plot twist unpleasantly surprised dollar bulls, after which the greenback fell across the market. Under other circumstances, this fundamental factor would have had a strong impact on the dollar for a quite long time. But under current conditions, Powell's "dovish" comments may take a back seat. The focus is on the political confrontation between Republicans and Democrats, whose inability to reach an agreement could lead to a default on the US national debt.

https://forex-images.ifxdb.com/userfiles/20230521/analytics646a2000a6818.jpg

There is no doubt that this topic will be the "number 1 issue" for all dollar pairs. All other fundamental factors will take a back seat - including Powell.

Biden raises the stakes
Exactly one week ago - May 14 - the President of the United States announced that negotiations with Congress on raising the debt ceiling are "progressing," and more about their progress will be known literally "in the next two days". At the same time, he emphasized that he is optimistic about the prospects of reaching a compromise. In anticipation of the next round of negotiations, assistants to the President of the United States and the Speaker of the lower house of Congress, Kevin McCarthy, began to form a "road map" to curb federal spending in order to resume negotiations on raising the debt ceiling.

The negotiations indeed took place - but ended in failure. The parties just "agreed to agree", but no more. Now the situation is up in the air. Another round of negotiations should take place after Biden completes his visit to Japan, where the G7 summit is being held. At the same time, the head of the White House canceled his planned visit to Australia, which speaks to the seriousness of the situation.

Important point: if the US President previously assessed the prospects of the negotiation process optimistically, today he has changed the tone of his rhetoric. For example, today he stated that declaring a default is "personally out of the question for him", but at the same time, he cannot guarantee that Republicans will not push the country into default by "doing something outrageous" (originally by Reuters agency - "Biden said he still believed he could reach a deal with Republicans, but could not guarantee that Republicans would not force a default by 'doing something outrageous'").

In this context, Biden called on Congress to work on the issue of raising the debt ceiling. He also emphasized that he would not agree to a bipartisan debt ceiling deal "exclusively on the terms of the Republicans". The head of the White House expressed readiness to cut spending, but stated that he does not intend to fulfill all the demands of Republican congressmen.

The terrifying word "default"

Judging by the escalation of the situation, a default no longer seems unthinkable. One can assume that Biden has decided to raise the stakes with his rhetoric before decisive negotiations, shifting the responsibility for possible default consequences onto the Republican party. However, in the context of currency traders' reaction, it doesn't really matter - whether it's a bluff or a real threat. Such statements from the President of the United States are capable of significantly shaking the markets. Considering that the aforementioned comments were made on a non-working day, dollar pair traders should prepare for a significant gap (in the case of the EUR/USD pair - a downward gap).

Overall, the upcoming week is packed with events. For example, on Monday, three representatives of the Federal Reserve (Bullard, Barkin, Bostic) will speak; on Tuesday, PMI indices will be published in Europe, and data on the volume of new home sales will be released in the US; on Wednesday, the minutes of the May meeting of the Federal Reserve are expected to be published along with a speech by ECB President Christine Lagarde; on Thursday, data on the volume of pending home sales will be disclosed in the States; and finally, on Friday, the most important inflation indicator - the core personal consumption expenditures index - will be published in the US.

But all these reports, as well as the speeches of representatives of the Federal Reserve and ECB, will remain in the shadow of the key topic of the upcoming week. The fate of the US national debt is the number 1 issue for dollar pair traders, so all eyes will be on the corresponding negotiations of American politicians. Especially since there is not much time left until the "hour X": as the US Treasury previously warned, on June 1, the country's government may declare a debt default if Congress cannot raise the debt ceiling.

Conclusions
Under such fundamental circumstances, it is extremely difficult to predict the possible trajectory of EUR/USD. It can only be assumed that at the start of the new trading week, risk-off sentiments in the markets will rise again, and this fact will provide significant support to the dollar. In this case, the pair will return to the area of the 7th figure with a target at 1.0700. But everything will depend on the negotiation capabilities of Republicans and Democrats. If they do find common ground and announce an increase in the debt ceiling, the spring will unwind in the opposite direction - against the American currency (especially in light of Jerome Powell's recent statements). If the negotiation saga drags on until next weekend, the dollar will continue to gain momentum, acting as a beneficiary of panic sentiments.

Considering the previous statements of Republicans, Democrats, and Biden himself, the negotiations will be very challenging - therefore, dollar pairs may once again find themselves in the area of price turbulence.

Analysis are provided by InstaForex.

Read More

Best regards, PR Manager / Learn more about InstaForex Company at http://instaforex.com

Re: InstaForex Analysis

Forecast for EUR/USD on May 23, 2023

EUR/USD
Yesterday, the US stock market closed mixed, bond yields slightly increased, and as a result, the euro did not extend the corrective growth that started on Friday.

https://forex-images.ifxdb.com/userfiles/20230523/analytics646c2390adeae.jpg

Nevertheless, the day closed with a white candlestick above the level of 1.0804, and the signal line of the Marlin oscillator continues to rise, suggesting that we might see a bullish correction. For this to happen, the price needs to surpass the previous day's high at 1.0832. The upper limit of the corrective growth is represented by the embedded line of the price channel around the 1.0887 mark. If the price consolidates below 1.0804, it will indicate that the previous breakout above the level was false and will pave the way to the target at 1.0736.

https://forex-images.ifxdb.com/userfiles/20230523/analytics646c2388009ea.jpg

On the four-hour chart, the price is consolidating above the level of 1.0804. The subsequent price movement is more likely to be upward, but not significantly, towards the nearest resistance at 1.0845 - the MACD line. The Marlin oscillator is moving parallel to the zero line in the positive area. The balance indicator line (red) is holding back the growth, but even with moderate price growth, it will adapt and stay above the price. This indicates the corrective nature of the potential growth.

Analysis are provided by InstaForex.

Read More

Best regards, PR Manager / Learn more about InstaForex Company at http://instaforex.com

Re: InstaForex Analysis

Forex Analysis & Reviews: Forecast for EUR/USD on May 24, 2023

EUR/USD:
The euro is falling for significant reasons - the imminent increase in the debt limit (which will lead to a massive influx of dollars from outside to purchase US government bonds) and a more hawkish stance from the Federal Reserve regarding interest rates than what the markets currently expect (yesterday, Neel Kashkari and James Bullard mentioned raising rates above 6% as inflation persists).

https://forex-images.ifxdb.com/userfiles/20230524/analytics646d77b315bbe_source!.jpg

However, from a technical standpoint, the situation is ripe for a correction. On the daily chart, a small weak convergence between price and the Marlin oscillator is forming. The price has not reached the embedded line of the price channel (green line), creating a dual situation: either the inclined support will be tested today, or the price will go up to 1.0804 and only after that will it attack 1.0736, surpassing the price channel line. A drop below 1.0736 opens the target at 1.0625, the lower embedded line of the price channel.

https://forex-images.ifxdb.com/userfiles/20230524/analytics646d77a76f0a4_source!.jpg

On the 4-hour chart, the price is falling below both indicator lines, and the Marlin oscillator is declining in bearish territory. The resistance level at 1.0804 is reinforced by the MACD indicator line here. Yesterday's trading volumes were at average May levels, which does not provide a basis for an immediate breakthrough of support. Perhaps a small correction will allow investors to accumulate short positions.

Analysis are provided by InstaForex.

Read More

Best regards, PR Manager / Learn more about InstaForex Company at http://instaforex.com

Re: InstaForex Analysis

Forecast for EUR/USD on May 25, 2023

EUR/USD:
Yesterday, the EUR/USD pair tested the resistance level of 1.0804 and closed the day on the lower embedded line of the price channel. The convergence between the price and the Marlin oscillator continues to influence the pair on the daily chart, and the pair could enter a correction from the support level of 1.0736 (the high of December 15, 2022).

https://forex-images.ifxdb.com/userfiles/20230525/analytics646ecbeeac7bc.jpg

If the price consolidates below the aforementioned level, the convergence will cease to exist, and the price will continue to move towards the next price channel line around 1.0625. The intermediate support is at the level of 1.0692, the high of March 1.

On the 4-hour chart, the price is falling below both indicator lines. The Marlin oscillator has a small probability of forming a double convergence (exactly when the price tests the level of 1.0736), after which the price may undergo a corrective rise towards the MACD line, which is slightly below the resistance level of 1.0804. In addition, Marlin may easily break its own generating line and continue to fall along with the price.

https://forex-images.ifxdb.com/userfiles/20230525/analytics646ecc0c710ca.jpg

Analysis are provided by InstaForex.

Read More

Best regards, PR Manager / Learn more about InstaForex Company at http://instaforex.com

Re: InstaForex Analysis

Forecast for GBP/USD on May 26, 2023

GBP/USD:
Yesterday, the pound opened and closed below the MACD indicator line. The downward movement may move towards the target range of 1.2125/53.

https://forex-images.ifxdb.com/userfiles/20230526/analytics647018aad6dac.jpg

The Marlin oscillator has slowed down and shows an intention to move up, which may indicate preparation for a correction to the MACD line (1.2400). If the correction does not occur and the support at 1.2273 is breached, we expect the price to reach the specified target range.

https://forex-images.ifxdb.com/userfiles/20230526/analytics647018b7c6ce9.jpg

On the four-hour chart, the Marlin oscillator has a good potential for a decline. The price is below the balance and MACD indicator lines. If a correction does occur (while awaiting agreements on the U.S. debt limit), the upper limit of the correction is also the MACD indicator line at 1.2400.

Analysis are provided by InstaForex.

Read More

Best regards, PR Manager / Learn more about InstaForex Company at http://instaforex.com

Re: InstaForex Analysis

Forex Analysis & Reviews: Forecast for EUR/USD on May 29, 2023

EUR/USD:
Last Friday, the euro traded within a range of 56 pips, closing the day at the opening level. The resistance of the target level at 1.0736 and the embedded line of the price channel were tested. Today, the price is not willing to repeat what it did on Friday, but the small convergence with the Marlin oscillator indicates that the price doesn't intend to enter a correction. Today is a holiday in the US and the UK, so we do not expect any significant or qualitative changes in the technical picture.

https://forex-images.ifxdb.com/userfiles/20230529/analytics64740fc5ad84f.jpg

The threat of a US default (or a budget shutdown) has also passed, as the White House and Republicans have reached an agreement on a 2-year debt limit. The agreement will be passed by the lower chamber tomorrow. If the price consolidates above 1.0736, it may develop a corrective rise towards 1.0804, while falling below 1.0692 would allow the price to target the bearish level of 1.0628.

https://forex-images.ifxdb.com/userfiles/20230529/analytics64740fb7a29a9_source!.jpg

On the four-hour chart, the price failed to consolidate above 1.0736 on Friday, and this morning it has already settled below it, supported by the downward-turning Marlin oscillator. The price is trying to either stay above 1.0692 or remain in a sideways movement. The first strong resistance for the corrective movement is represented by the MACD line at 1.0756.

Analysis are provided by InstaForex.

Read More

Best regards, PR Manager / Learn more about InstaForex Company at http://instaforex.com

Re: InstaForex Analysis

Forex Analysis & Reviews: Forecast for EUR/USD on May 30, 2023

EUR/USD: Yesterday, when the US and UK had a holiday, the euro cautiously tested the resistance of the nearest descending price channel line and ended the day lower. It appears that the bears are struggling to maintain pressure on the quotes. According to our main scenario, when the US government makes the final decision to raise the debt ceiling (tomorrow, as the lower house of Congress approves it today), the dollar will advance against all global currencies. However, this scenario has a visible pitfall - the desire of major players to eliminate premature dollar bulls. In this case, the euro may rise to the target level of 1.0804.

https://forex-images.ifxdb.com/userfiles/20230530/analytics647562d479d93_source!.jpg

On the other hand, if investors expect long-term strengthening of the dollar, initiating a move with a preliminary upward price spike of just one figure may not be a very effective endeavor. Historically, false movements of the euro against news of debt limit increases have occurred intermittently. It is difficult to predict how things will unfold today. Even from a technical perspective, the small convergence on the daily chart indicates both a potential minor correction and its possible breakdown due to strong news.

https://forex-images.ifxdb.com/userfiles/20230530/analytics647562c976ee9_source!.jpg

On the four-hour chart, the price is getting closer to the MACD indicator line, from which a downward reversal may occur, or with the assistance of the Marlin oscillator, which is ready to enter the positive territory, the price could climb to the target level of 1.0804 (February 14 and May 24 highs). The MAcD line (1.0738) coincides with the price channel line on the daily chart, making it a strong level. There is a certain probability that the euro will decline without a preliminary corrective rally.

Analysis are provided by InstaForex.

Read More

Best regards, PR Manager / Learn more about InstaForex Company at http://instaforex.com

Re: InstaForex Analysis

Forecast for EUR/USD on May 31, 2023

EUR/USD
On Tuesday, the euro went through a correction, defined by the convergence with the Marlin oscillator. The price once again tested the target level of 1.0738 and the embedded line of the descending channel. The signal line of the oscillator has entered its own descending channel.

https://forex-images.ifxdb.com/userfiles/20230531/analytics6476b29f187f4.jpg

According to the main scenario, the price can now consolidate below the support level of 1.0692 and continue moving towards 1.0620, which is the lower embedded line of the price channel. The alternative scenario is simple - after settling above 1.0738, a test of the target resistance at 1.0804 is possible. This would extend the correction.

https://forex-images.ifxdb.com/userfiles/20230531/analytics6476b29118d47.jpg

On the four-hour chart, the price has returned below the MACD indicator line after a false breakout above it. The Marlin oscillator has moved into the negative territory after briefly staying in the positive area. The trend is bearish

Analysis are provided by InstaForex.

Read More

Best regards, PR Manager / Learn more about InstaForex Company at http://instaforex.com

Re: InstaForex Analysis

Forecast for EUR/USD on June 1, 2023

EUR/USD:
The euro closed yesterday with a black candle. The lower shadow almost reached the target line of the descending price channel. Surprisingly, such a strong movement from the technical side did not improve the bears' position. A convergence between the price and the Marlin oscillator has only intensified, and the oscillator's signal line has not reversed from the upper limit of its own channel. In addition, the price did not consolidate below the target level of 1.0692.

https://forex-images.ifxdb.com/userfiles/20230601/analytics6478066104ffc.jpg

As a result, we return to yesterday's state: a breakout above 1.0738 opens the target of 1.0804, while a consolidation below 1.0692 allows the price to once again attack 1.0620. Breaking through this level opens the path to 1.0497.

https://forex-images.ifxdb.com/userfiles/20230601/analytics6478064e10652.jpg

On the 4-hour chart, the price is still below the balance and MACD indicator lines, and the Marlin oscillator is in negative territory. Therefore, the bears have a chance to prevail.

Analysis are provided by InstaForex.

Read More

Best regards, PR Manager / Learn more about InstaForex Company at http://instaforex.com

Re: InstaForex Analysis

Technical analysis of GBP/USD for June 01, 2023

https://forex-images.ifxdb.com/userfiles/20230601/analytics647907028b9b1.jpg

Overview :
The GBP/USD pair faced resistance at the level of 1.2545, while minor resistance is seen at 1.2545. Support levels found at the levels of 1.2493 and 1.2454.

Yesterday, the GBP/USD pair continued to move upwards from the levels of 1.2493 and 1.2454. The pair rose from the levels of 1.2493 or 1.2454 to the top around 1.2523.

In consequence, the GBP/USD pair broke resistance, which turned strong support at the level of 1.2545.

Moreover, the RSI starts signaling an upward trend, and the trend is still showing strength above the moving average (100). Hence, the market is indicating a bullish opportunity above the area of 1.2493 - 1.2454. So, the market is likely to show signs of a bullish trend around 1.2493 and 1.2454.

Today, the level of 1.2493 is expected to act as major support. Hence, we expect the GBP/USD pair to continue moving in the bullish trend from the support level of 1.2493 towards the target level of 1.2545.

If the pair succeeds in passing through the level of 1.2545, the market will indicate the bullish opportunity above the level of 1.2545 in order to reach the second target at 1.0002 to test the double top in the H1 time frame.

However, the price spot of 1.2593 remains a significant resistance zone. Thus, the trend will probably be rebounded again from the double top as long as the level of 1.2454 is not breached.

Analysis are provided by InstaForex.

Read More

Best regards, PR Manager / Learn more about InstaForex Company at http://instaforex.com

Re: InstaForex Analysis

Forecast for GBP/USD on June 5, 2023

GBP/USD: On Friday, the pound fell by 75 pips amid mixed but not exactly weak US employment data. This morning, upon the news of President Biden signing a bill to lift the debt ceiling on Saturday, the pound lost another 20 pips, entering the range of the May 31 candle.

https://forex-images.ifxdb.com/userfiles/20230605/analytics647d4a2ef264a.jpg

The nearest target at 1.2403, the MACD daily line, is now open. Breaking below this line opens up the target of 1.2273, which is both the April 3 low and the February 14 high. The Marlin oscillator is moving deeper into the downtrend area, and it may reach the oversold zone when the price approaches the target range of 1.2125/53.

https://forex-images.ifxdb.com/userfiles/20230605/analytics647d4a1cb9f44.jpg

On the four-hour chart, the price is moving between two target levels while the Marlin oscillator remains negative. It is likely that the price will attempt to break 1.2403. If successful, the pound will aim for the MACD line on the four-hour chart around 1.2370. Breaking below this support, the British pound will be aiming for 1.2273.

Analysis are provided by InstaForex.

Read More

Best regards, PR Manager / Learn more about InstaForex Company at http://instaforex.com

Re: InstaForex Analysis

Technical Analysis of GBP/USD for June 6, 2023

Technical Market Outlook:
The GBP/USD pair had reversed sharply lower after the technical resistance level seen at 1.2550 was too strong to be broken. The bears moved below all of the MA levels, but eventually the market bounced from the short-term trend line support seen at the level of 1.2367. The momentum reversed sharply from the extremely overbought conditions on the H4 time frame as well and is currently moving testing the level of fifty. There is still a room for a momentum and price to move lower, so the short-term outlook remains bearish.

https://forex-images.ifxdb.com/userfiles/20230606/analytics647edb7f19978.jpg

Weekly Pivot Points:
WR3 - 1.25080
WR2 - 1.24565
WR1 - 1.24223
Weekly Pivot - 1.24050
WS1 - 1.23708
WS2 - 1.23535
WS3 - 1.23020

Trading Outlook:
A Bearish Engulfing candlestick pattern on the Weekly time frame chart 100 pips away from the 61% Fibonacci retracement located at the level of 1.2778 might indicate the corrective cycle to the upside had been terminated. Any sustained breakout below the technical support at 1.2444 will be the first indication of stronger bearish pressure.

Analysis are provided by InstaForex.

Read More

Best regards, PR Manager / Learn more about InstaForex Company at http://instaforex.com

Posts: 1,326 to 1,350 of 1,547

Pages Previous 1 52 53 54 55 56 62 Next

You must login or register to post a reply

Forex Software → Market Analysis → InstaForex Analysis

Similar topics in this forum