forex software

Create and Test Forex Strategies

forex software

Skip to forum content

Forex Software

Create and Test Forex Strategies

You are not logged in. Please login or register.


(Page 53 of 62)

Forex Software → Market Analysis → InstaForex Analysis

Pages Previous 1 51 52 53 54 55 62 Next

You must login or register to post a reply

RSS topic feed

Posts: 1,301 to 1,325 of 1,547

Re: InstaForex Analysis

TECHNICAL ANALYSIS OF DAILY PRICE MOVEMENT OF NATURAL GAS COMMODITY ASSET, WEDNESDAY MARCH 29 2023.

https://forex-images.ifxdb.com/userfiles/20230329/analytics6423b7fb9fcfa.jpg

If we look on the daily chart of Natural Gas commodity asset then it will seen that both of Moving Average is on Death Cross condition as well as supported by the appearance of Bearish 123 pattern follow by Ross Hook (RH) also Awesome Oscillator indicator was on negative area so in a few days ahead, Natural Gas has the potential to depreciated down below where the level of 1,967 will try to tested to break below, as long as there is no upward correction movement which is quite significant until it breaks above the level of 2,427, Natural Gas has the potential to continue its decline to the level of 1,785.

Analysis are provided by InstaForex.

Read More

Best regards, PR Manager / Learn more about InstaForex Company at http://instaforex.com

Re: InstaForex Analysis

FORECAST FOR GBP/USD ON MARCH 30, 2023

Yesterday, the pound, as well as other world currencies (especially the yen), refused to reach technical levels and turned down instead. The pound lost 27 pips, giving up the 1.2420 target. However, this level is very strong, and testing it while the market is neutral is unlikely to provide the pound with more prospects.

https://forex-images.ifxdb.com/userfiles/20230330/analytics6424f20f8242c.jpg

Now, the price can overcome the support level at 1.2278 and go down to 1.2155 to assess the new balance of power, as it is the middle of the range since mid-December 2022.

https://forex-images.ifxdb.com/userfiles/20230330/analytics6424f1ebe6ac1.jpg

On the four-hour chart, the Marlin oscillator signal line is entering the downtrend area. The price is approaching the support level at 1.2278. The MACD line reached this support level, i.e. these lines coincide on different scales. And if so, a breakthrough of the support will have a strong subsequent impact on the price.

Analysis are provided by InstaForex.

Read More

Best regards, PR Manager / Learn more about InstaForex Company at http://instaforex.com

Re: InstaForex Analysis

FORECAST FOR AUD/USD ON MARCH 31, 2023

The Australian dollar broke through the upper limit of the neutral range that started back on March 17. AUD climbed out of this range this morning.

https://forex-images.ifxdb.com/userfiles/20230331/analytics6426490393e2c.jpg

It could fall to the lower limit of the range, like it did on the 23rd, but the ascending Marlin oscillator creates an advantage for the growth option, at first to 0.6790 and then, under the favorable circumstances, to 0.6873.

https://forex-images.ifxdb.com/userfiles/20230331/analytics642648470aedd.jpg

On the four-hour chart, the price is in an active position to rise above the indicator lines, the Marlin is growing at an even angle, with an optimal speed to enter the overbought zone. After consolidating above 0.6730, we can expect the price to rise further. However, this plan can potentially be hindered by the price breaking through the MACD line, below the 0.6693 mark.

Analysis are provided by InstaForex.

Read More

Best regards, PR Manager / Learn more about InstaForex Company at http://instaforex.com

Re: InstaForex Analysis

XAUUSD, DAY | POTENTIAL BREAKOUT 1ST SUPPORTL?

https://forex-images.ifxdb.com/userfiles/20230403/analytics642a58a82c4d1.jpg

Gold (XAU/USD) has been exhibiting a bullish trend, with an overall momentum that is also bullish. Based on the chart, the price has the potential to make a bullish rebound off the first support level and then move towards the first resistance.

The first support level, which is at 1948.51, is a strong overlap support level that has been tested multiple times and has acted as a support level in the past. Therefore, it is a good level for a potential bounce.

Another support level is located at 1881.07, which is also an overlap support level. It has been tested several times and has held as a support level, making it another level for a potential bounce.

Meanwhile, the first resistance level at 2000.00 is a multi-swing high resistance level that has been significant in the past. Additionally, it is located at the 127.20% Fibonacci Extension level, which provides additional confluence to the level.

Another resistance level is at 2070.00, which is a swing high resistance level. This level has also been important in the past, making it another level for traders to observe.

Analysis are provided by InstaForex.

Read More

Best regards, PR Manager / Learn more about InstaForex Company at http://instaforex.com

Re: InstaForex Analysis

FORECAST FOR EUR/USD ON APRIL 4, 2023

The euro changed its bearish mood on Friday, and jumped by 120 pips on Monday from the low of the day, from the support of the target level, or more precisely, the upper limit of the target range of 1.0758/87. The price is consolidating above the MACD indicator line below the upper limit of the green price channel. Climbing above the 1.0930 reference level will make 1.0990 the next target.

https://forex-images.ifxdb.com/userfiles/20230404/analytics642b8cca9b0ab.jpg

Bears, if they don't want to give up easily and have control of the situation, must consolidate under the MACD line on the daily chart, below 1.0867. In this case, a divergence with the Marlin oscillator will unfold, and simultaneously, the signal line of the oscillator will leave the wedge and move down. The price will move towards the range of 1.0758/87.

On the four-hour chart, a double divergence of the price with the oscillator has already been formed. This is an effective sign of a reversal, but it's not enough. In the current conditions, the price needs to cross the support of the MACD line, around 1.0857, which is 10 pips below the MACD line on the daily chart. We have to wait what scenario the market will choose in the near future.

https://forex-images.ifxdb.com/userfiles/20230404/analytics642b8cb5a3828.jpg

Analysis are provided by InstaForex.

Read More

Best regards, PR Manager / Learn more about InstaForex Company at http://instaforex.com

Re: InstaForex Analysis

FORECAST FOR EUR/USD ON APRIL 5, 2023

The euro has chosen growth, at least soon. The EUR/USD exchange rate increased by 56 points yesterday. The price maintains its pursuit of the target level of 1.1033 – reaching its peak on February 2. Consolidation above the level will enable the target of 1.1185 — the maximum for March 2022 and the same minimum for November 2021 — to be reached.

https://forex-images.ifxdb.com/userfiles/20230405/analytics642cdd19e1274.jpg

Today, the United States will release March data on private, non-agricultural employment and the ISM Services PMI. ADP Non-Farm and ISM Services PMI are anticipated to decrease: ADP Non-Farm from 242 thousand to 200/208 thousand and ISM Services PMI from 55.1 to 54.5/3.

https://forex-images.ifxdb.com/userfiles/20230405/analytics642cdd00595d9.jpg

On the four-hour chart, the price is rising above the indicator lines, the Marlin oscillator is in the rising trend zone, and there are no indications of a price reversal.

Analysis are provided by InstaForex.

Read More

Best regards, PR Manager / Learn more about InstaForex Company at http://instaforex.com

Re: InstaForex Analysis

FORECAST FOR EUR/USD ON APRIL 6, 2023

On Wednesday, the euro fell by 49 points, showing an intention to turn down in the short or medium term. However, this behavior has signs of a false movement.

https://forex-images.ifxdb.com/userfiles/20230406/analytics642e33f6907a0.jpg

There is no price divergence with the Marlin oscillator on the daily chart, which is rare for the saw-toothed movement of the oscillator signal line. There may be another final surge of the oscillator and the price, even if it doesn't reach the target level of 1.1033. At least (while there is no divergence), the price should settle below the MACD indicator line to create a sign of reversal, and that will take at least a day. If the bears succeed, the price will move to the target range of 1.0758/87. Meanwhile, the price can still try to overcome the April 4 high.

https://forex-images.ifxdb.com/userfiles/20230406/analytics642e33ebccb8c.jpg

On the four-hour chart, the price falls below the MACD line, but the main support is the line of the higher chart (1.0872). The Marlin oscillator is already in the area of the downtrend, but there can also be a breakthrough.

Analysis are provided by InstaForex.

Read More

Best regards, PR Manager / Learn more about InstaForex Company at http://instaforex.com

Re: InstaForex Analysis

FORECAST FOR GBP/USD ON APRIL 7, 2023

Yesterday, the pound reached a strong support level at 1.2422, which turned out to be an insurmountable resistance for the price in the second half of January. Now, if the pair crosses this level, the first target will be the MACD line at 1.2298, and after correcting the price may fall to 1.2155.

https://forex-images.ifxdb.com/userfiles/20230407/analytics642f80c130442.jpg

If the 1.2422 level is so strong that even good U.S. jobs data, if it is available today, will not be able to help the price to overcome it, the pair is likely to reverse to the target level of 1.2598. In this case, the signal line of the Marlin oscillator will climb from its own consolidation.

https://forex-images.ifxdb.com/userfiles/20230407/analytics642f80ac7b4e7.jpg

On the four-hour chart, the 1.2422 level is reinforced by the MACD indicator line. And even though the Marlin oscillator is already in negative territory, it can reluctantly follow the price in case it rises. It is a holiday in Europe, and the only driver may be the U.S. employment data. Let's wait for the report and see how things unfold.

Analysis are provided by InstaForex.

Read More

Best regards, PR Manager / Learn more about InstaForex Company at http://instaforex.com

Re: InstaForex Analysis

BTCUSD, Daily | Potential reversal from 1st resistance?

https://forex-images.ifxdb.com/userfiles/20230410/analytics64339371095d0.jpg

The BTC/USD chart currently reflects a bearish momentum in the cryptocurrency market, and Bitcoin seems to be following the trend. The chart suggests that the price of Bitcoin could face resistance at the 1st resistance level of 28343, which has previously been an important level as an overlap resistance. If Bitcoin fails to break through this level, it may result in a bearish reaction causing the price to drop towards the 1st support level of 25249. This level, being a pullback support, could act as a strong support for the price of Bitcoin.

In the event that the price of Bitcoin breaks through the 1st resistance level, the next resistance level it could face is the 2nd resistance level of 32843, which is a pullback resistance. Conversely, if Bitcoin breaks below the 1st support level, the next support level it could drop to is the 2nd support level of 23925. This level, also being a pullback support, could potentially act as a strong support for the price of Bitcoin.

Additionally, there is an intermediate support level at 26598, which is a swing low support and is accompanied by a 23.60% Fibonacci retracement. This level could potentially provide support to the price of Bitcoin if it drops towards the 1st support level. Overall, the BTC/USD chart's momentum is bearish, indicating that the price is expected to continue falling in the near term.

Analysis are provided by InstaForex.

Read More

Best regards, PR Manager / Learn more about InstaForex Company at http://instaforex.com

Re: InstaForex Analysis

USDJPY, H4 | Potential reversal from 1st resistance?

https://forex-images.ifxdb.com/userfiles/20230411/analytics6434ee2108b82.jpg

The current momentum of the USD/JPY chart is bearish, indicating a potential price drop in the near future. A significant resistance level to watch is at 133.76, which is a strong pullback resistance level and coincides with the 78.60% Fibonacci projection. If the price reacts bearishly at this level, it may potentially fall towards the first support at 131.81. This support level is an overlap support and also lines up with the 61.80% Fibonacci retracement level, making it a significant level for a potential price rebound.

If the price breaks below the first support, it may fall towards the second support at 130.53, which is also an overlap support level. However, if the price breaks above the first resistance, it may potentially rise towards the second resistance at 134.08. This is an overlap resistance level and also has the 61.80% Fibonacci retracement level lining up with it, making it a significant level to watch.

Analysis are provided by InstaForex.

Read More

Best regards, PR Manager / Learn more about InstaForex Company at http://instaforex.com

Re: InstaForex Analysis

Technical Analysis of Intraday Price Movement of Nasdaq 100 Index, Wednesday April 12, 2023

https://forex-images.ifxdb.com/userfiles/20230412/analytics643607eeaaa58.jpg

With the appearance of deviation between Nasdaq 100 index price movement with Stochastic Oscillator indicator on the 4 hour chart then it is high likely for #NDX will depreciated for some time in the future up to the area level of 12705,8-12617,7 however during the decline not exceed below the level of 12517,9 then #NDX still has the potential to back to rallying upwards up to the level of 13238,0.

Analysis are provided by InstaForex.

Read More

Best regards, PR Manager / Learn more about InstaForex Company at http://instaforex.com

Re: InstaForex Analysis

Forecast for GBP/USD on April 13, 2023

As a result of yesterday, the pound rose by 60 points, trying to move faster and further away from the 1.2422 level. The nearest target will be 1.2598 – the peak of June 7, 2022. At the same time, there is a high probability of forming a reversal divergence with the Marlin oscillator.

https://forex-images.ifxdb.com/userfiles/20230413/analytics64376f027c973.jpg

On the four-hour chart, the price is climbing above the balance and MACD indicator lines, and the Marlin oscillator is growing in the "green zone". We have an uptrend.

https://forex-images.ifxdb.com/userfiles/20230413/analytics64376f0d45a5b.jpg

The primary signal of a reversal is when the price falls below the MACD indicator line (1.2460), and the signal will be confirmed once the price settles below the 1.2422 level. The pound's final decision to take a course for a medium-term decline is when it moves below the MACD line, in the area of the 1.2320 mark.

Analysis are provided by InstaForex.

Read More

Best regards, PR Manager / Learn more about InstaForex Company at http://instaforex.com

Re: InstaForex Analysis

Forecast for EUR/USD on April 14, 2023

Yesterday's rise in the dollar index by 0.57% and the euro's rise by 0.49% were largely based on expectations for today's quarterly reports from the biggest US banks. As expected, JPMorgan Chase, Wells Fargo, Citigroup, and PNC Financial Services will show good profits, which is important for demonstrating the resilience of the banking sector. Meanwhile, there may be some difficulties with the world's largest asset management company, BlackRock, which is also set to report today, since its in a haste to get rid of bad Credit Suisse assets.

https://forex-images.ifxdb.com/userfiles/20230414/analytics6438bae175008.jpg

Overall, investors have an appetite for risk, and the euro may reach the target level of 1.1185 – which is the peak of March 31, 2022, and the low of November 24, 2021. Yesterday, the price overcame the first resistance at 1.1033, and the Marlin oscillator slightly turned downward. EUR may take a quick break and consolidate at this level as it braces to rise further.

On the four-hour chart, the price is vigorously growing above the rising indicator lines, the Marlin oscillator has slowed down and is ready to edge down, discharging before further growth.

https://forex-images.ifxdb.com/userfiles/20230414/analytics6438bb3886e5a.jpg

Analysis are provided by InstaForex.

Read More

Best regards, PR Manager / Learn more about InstaForex Company at http://instaforex.com

Re: InstaForex Analysis

EURUSD, Day | Continue to 1st Support?

https://forex-images.ifxdb.com/userfiles/20230417/analytics643cd6fc3438b.jpg

The EUR/USD chart currently displays an overall bearish momentum, indicating a potential continuation of bearish movements towards the 1st support level. The 1st support level at 1.0806 is an overlap support that has previously demonstrated its strength. However, should the price break through this level, it could potentially drop further towards the 2nd support at 1.0516, which is a multi-swing low support.

Resistance levels for the EUR/USD can be found at 1.1184 and 1.1035. The 1st resistance level is an overlap resistance that is crucial in monitoring for any potential bearish movements. Meanwhile, the intermediate resistance at 1.1035 is a multi-swing high resistance that could potentially trigger a stronger bearish trend towards the 1st support level if the price breaks through it. It's important to note that there is also an intermediate support level at 1.0974, which is a pullback support. Should the price bounce from this level, it could potentially rise towards the intermediate resistance at 1.1035

Analysis are provided by InstaForex.

Read More

Best regards, PR Manager / Learn more about InstaForex Company at http://instaforex.com

Re: InstaForex Analysis

Forecast for GBP/USD on April 18, 2023

Yesterday, the British pound showed strong volatility, closing the day with a loss of 38 points. On the daily chart, the signal line of the Marlin oscillator has approached the limit of the downtrend, so to break through it, the price should settle below the MACD indicator line (1.2322). Consolidating below support will open the next target at 1.2155 - the peak of November 2022.

https://forex-images.ifxdb.com/userfiles/20230418/analytics643dff1ddce6a.jpg

On the four-hour chart, we can see that yesterday's trading range was formed below the target level of 1.2422. The balance indicator line in red also helped the level.

https://forex-images.ifxdb.com/userfiles/20230418/analytics643dff304a842.jpg

This is a sign of strong resistance, so in the near future, I expect the price to cross the support level of 1.2322. The Marlin oscillator is also set to fall further.

Analysis are provided by InstaForex.

Read More

Best regards, PR Manager / Learn more about InstaForex Company at http://instaforex.com

Re: InstaForex Analysis

Forecast for USD/JPY on April 19, 2023

Yesterday, the US dollar lost 35 points against the Japanese yen, coinciding with the dollar weakening throughout the market and the price's struggle with the technical resistance of the strong price channel line (134.30, daily).

https://forex-images.ifxdb.com/userfiles/20230419/analytics643f4ffd108da.jpg

The signal line of the Marlin oscillator is pointing upward in the area of the uptrend. The bullish target is 135.40 - the low on March 6th. Consolidating above this level will allow the price to rise to the next embedded price channel line around 138.34.

https://forex-images.ifxdb.com/userfiles/20230419/analytics643f4ff3344bf.jpg

On the four-hour chart, the Marlin oscillator resumed growth after the signal line rebounded from the limit of the area of the downtrend (arrow). The price is rising above the balance and MACD lines, with the main trend being upward. To guarantee it, the price needs to consolidate above 134.30.

Analysis are provided by InstaForex.

Read More

Best regards, PR Manager / Learn more about InstaForex Company at http://instaforex.com

Re: InstaForex Analysis

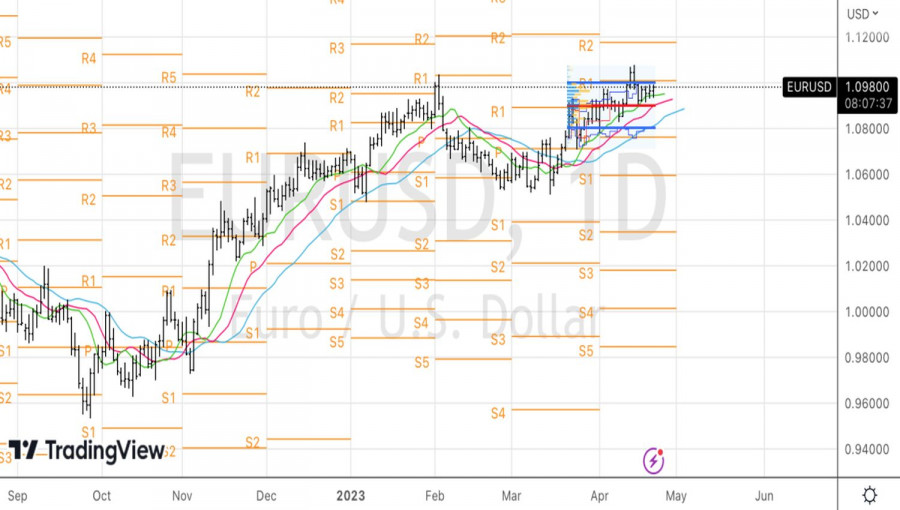
EUR/USD. Trapped in a wide-ranging flat: traders are stuck within the range of the 9th figure

The euro-dollar pair is trading in a broad price range, but at the same time, it is effectively stagnating, reflecting the indecisiveness of both buyers and sellers. Despite the fairly strong volatility, traders are unable to leave the area of the 9-figure range to develop either an upward or downward movement. This price dynamic is due to the contradictory fundamental background that has emerged for the EUR/USD pair.

Initiative changes hands

Overall, the pair this week mirrors the trajectory of the US dollar index: on Monday, the greenback strengthened its positions across the market, causing the EUR/USD price to "visit" the 8-figure area. On Tuesday, the dollar was under pressure, which the pair's buyers took advantage of. Dollar bulls are again dictating their rules of the game, pulling the pair towards the base of the 9th price level. These "roller coaster" fluctuations are primarily related to the strengthening/weakening of risk-off sentiments in the markets. In addition, traders are quite sensitive to the strengthening/weakening of hawkish expectations regarding the further actions of the Fed/ECB. All other fundamental factors play a more supporting role.

https://forex-images.ifxdb.com/userfiles/20230419/analytics643ff66885e84.jpg

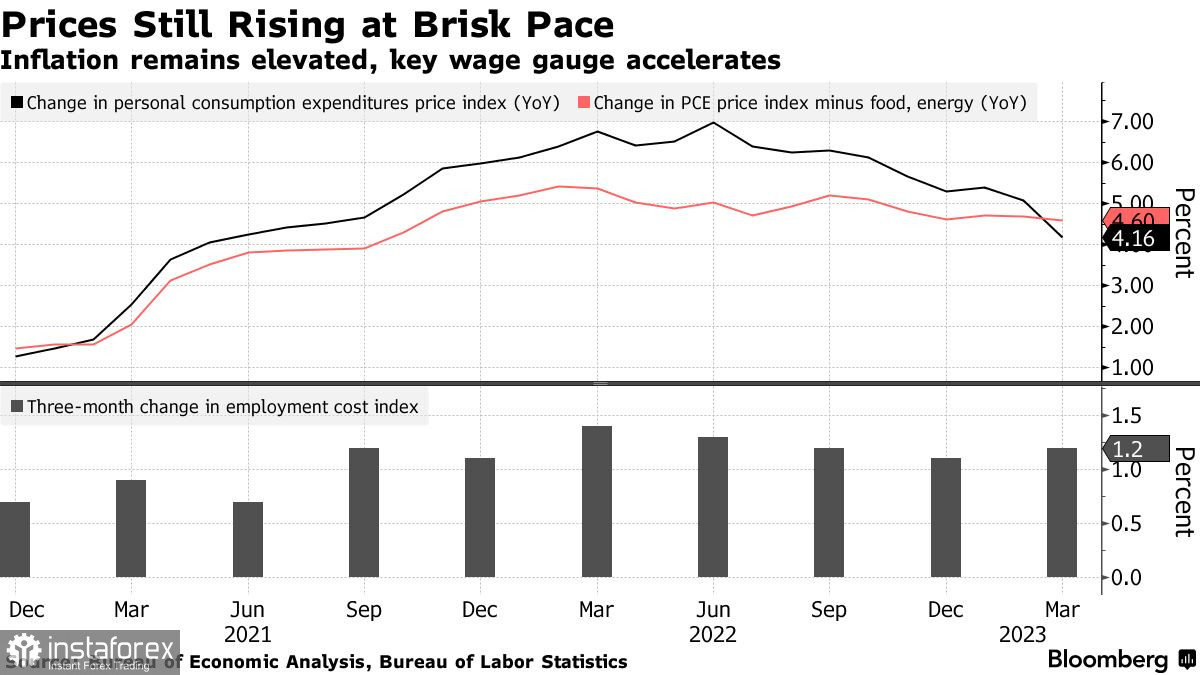
I would like to remind you that initially, the greenback's position was strengthened by Fed representative Christopher Waller, who during his Friday speech, allowed for several interest rate hikes this year. Considering the fact that the market had "come to terms" with one final increase in May, this remark triggered strong volatility among dollar pairs. The hawkish signal came against the backdrop of a decline in overall inflation in the US, a slowdown in the producer price index and the core PCE index. The only concern is the core consumer price index, which accelerated to 5.6% in March (previously, the indicator had been declining consecutively for three months).

The Fed's median forecast, updated at the March meeting, assumes one more rate hike by the end of this year. The probability of a 25 basis point increase following the May meeting is now at 89%. However, the market is doubtful that the Federal Reserve will take further steps in this direction. Most Fed representatives are in favor of tightening monetary policy but only in the context of the May increase. Further decisions will depend on incoming data, primarily in the area of inflation.

For example, Federal Reserve Bank President Raphael Bostic recently stated that his baseline forecast assumes that rates will remain unchanged after the next (May) increase. The head of the St. Louis Fed, who is a consistent "hawk," allowed for a rate increase to 5.75%. However, he called for avoiding broad forward guidance at the May meeting. Federal Reserve Bank of San Francisco President Mary Daly voiced a rather vague formulation, the essence of which is that subsequent decisions will depend on the dynamics of inflation. According to her, the tightening of monetary policy is now at the stage where "the central bank does not expect further rate hikes at every meeting." Richmond Fed President Thomas Barkin expressed confidence that inflation had already peaked, but he wants to see more evidence that it is returning to the target level. Several other Fed representatives also spoke in the same vein. Notably, New York Fed President John Williams even allowed for a rate cut at the end of the year, "if inflation slows down sufficiently."

As we can see, at the moment, we can only speak with some certainty about the May rate hike (as eloquently evidenced by the CME FedWatch Tool). The further prospects for tightening monetary policy look uncertain, considering the side effects of measures already taken and the decline in key inflation indicators.

Taking into account such uncertainty, EUR/USD traders should be very cautious about hawkish statements from Federal Reserve representatives, as the influence of their messages is short-term in nature. Moreover, the European Central Bank also demonstrates a hawkish stance, discussing whether to raise rates in May by 25 or 50 basis points.

Don't trust price fluctuations

It's worth noting that the US dollar index reacts not only to the statements of Fed members. The agenda is also determined by the overall market sentiment, which reflects the degree of interest in risk assets or defensive instruments. These are quite shaky, unreliable, and highly variable fundamental arguments.

For example, yesterday the dollar was under pressure due to the release of strong GDP growth data from China. Macroeconomic reports, which were almost all in the "green," confirmed the recovery of the Chinese economy after the lifting of quarantine restrictions and the abandonment of the zero-tolerance policy towards COVID-19. This fact returned optimism to the market and contributed to the overall improvement of market sentiment. The safe-haven greenback was, as they say, "out of the picture" – the dollar index lost its gained positions.

But now the US currency has regained strength, as traders' risk appetite began to weaken amid caution due to the quarterly earnings season in the US economy. In addition, the dollar is strengthening against the backdrop of rising Treasury yields (in particular, the yield on 10-year bonds was around 3.63% - the highest level since March 22).

As a rule, such fundamental factors "flare up brightly but quickly fade." During one trading day, interest in risk can increase or decrease, providing support or pressure on the EUR/USD pair. Conclusions

The euro-dollar pair demonstrates increased volatility, but traders cannot determine the direction of the price movement. Therefore, any trading decisions (both towards the south and the north) are inherently risky, as the pair traces a wave-like trajectory.

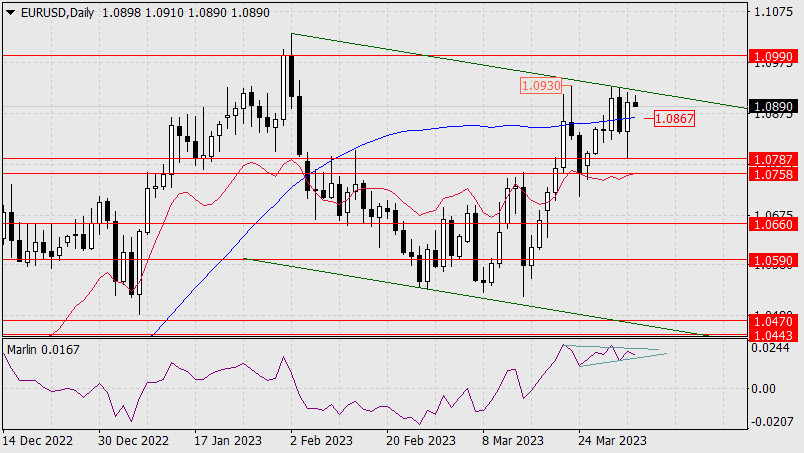
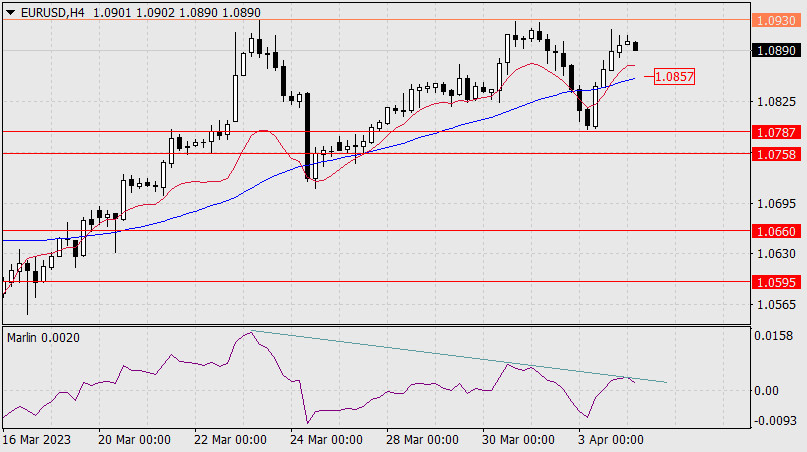
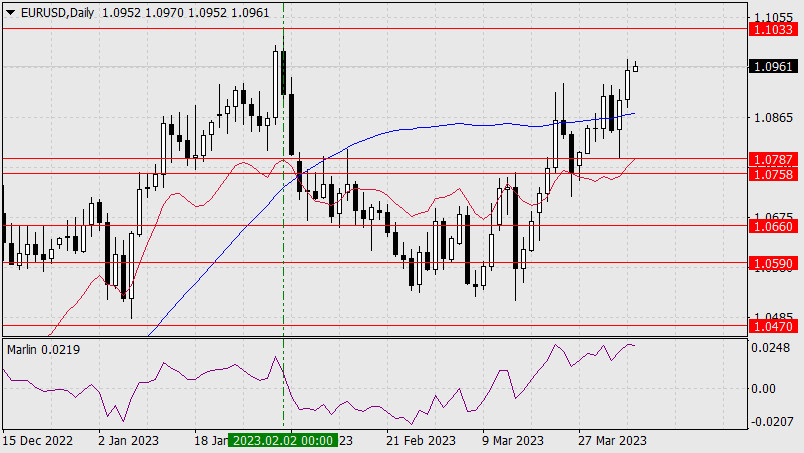
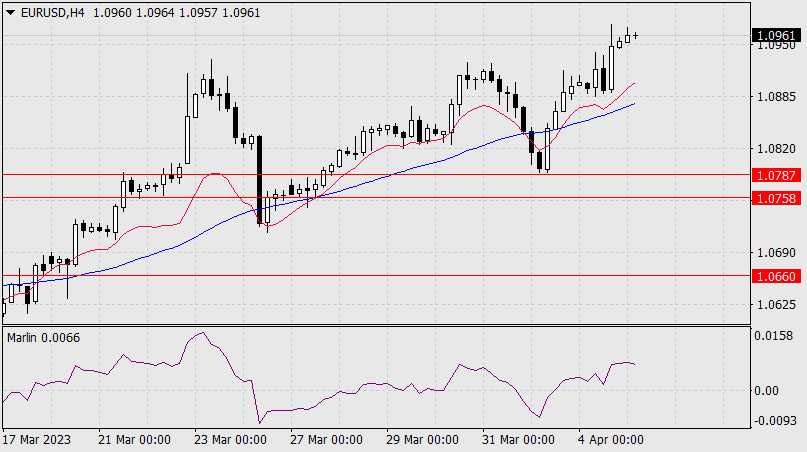
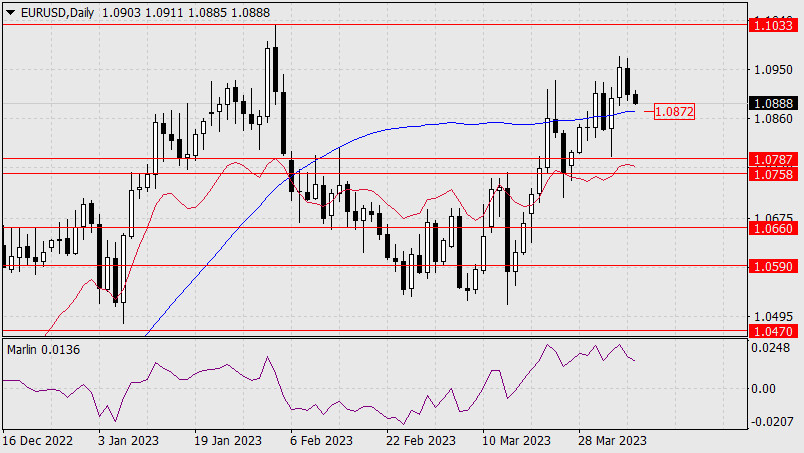
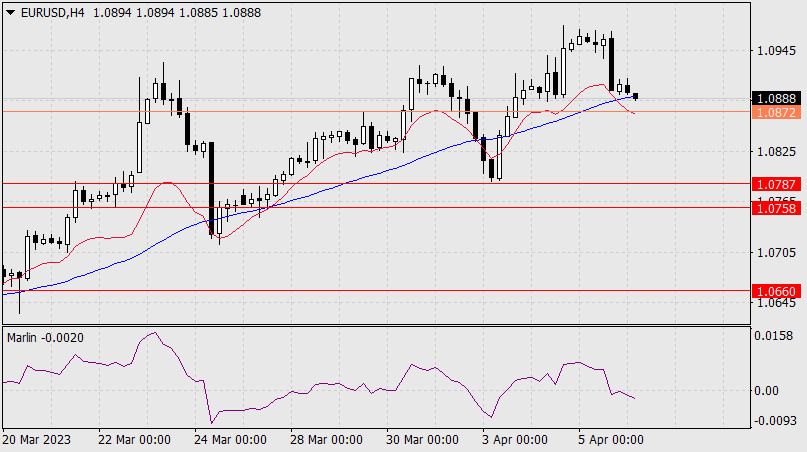
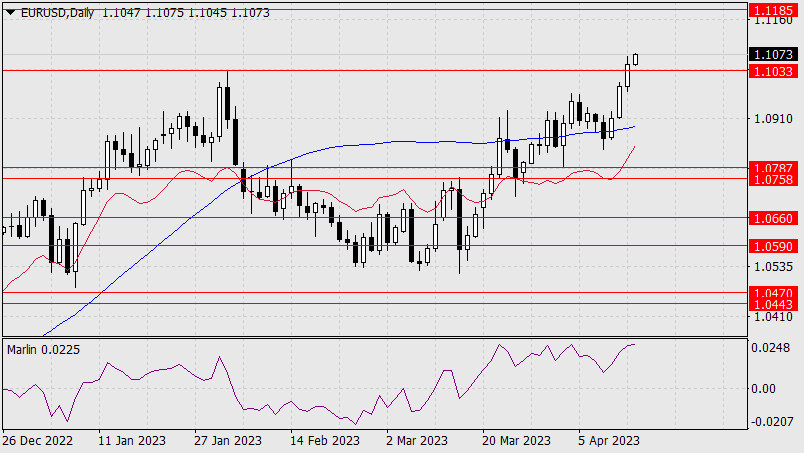
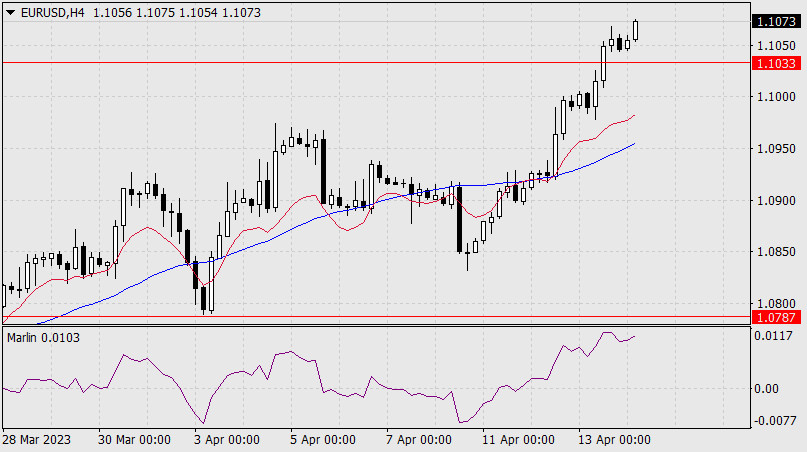
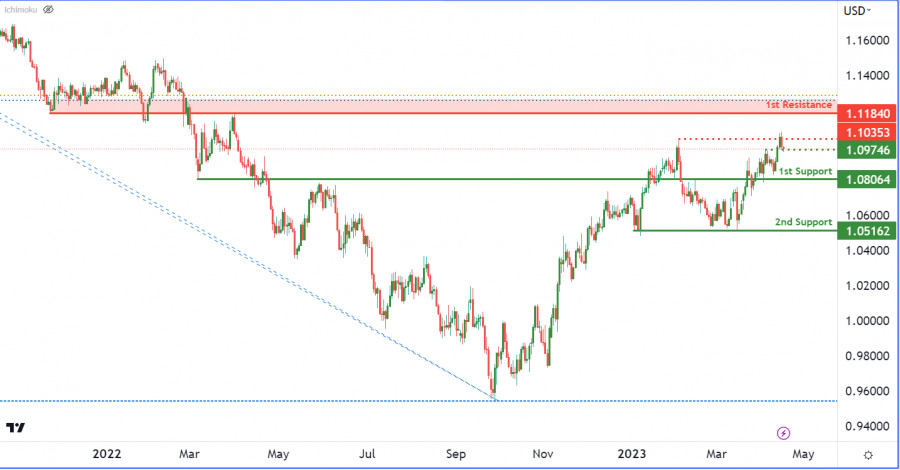
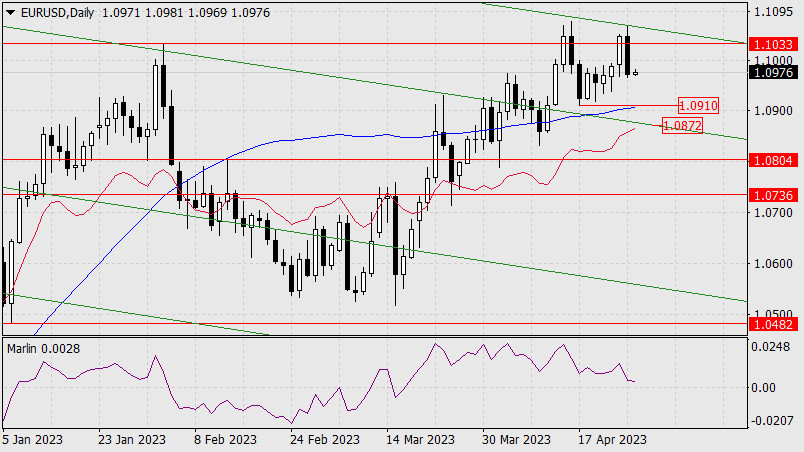
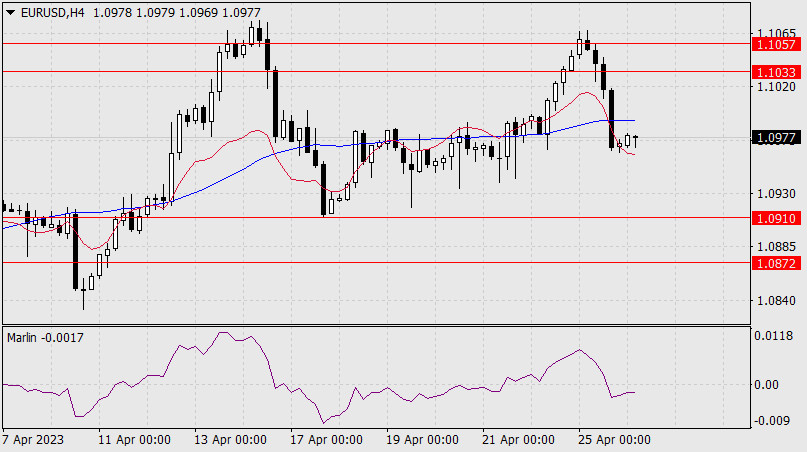
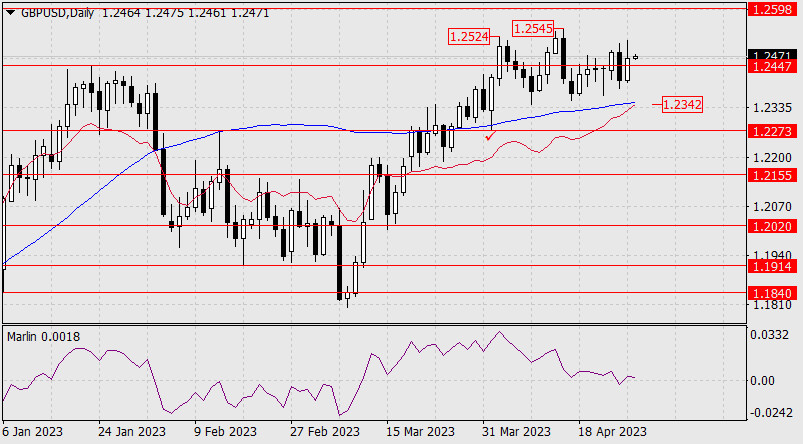
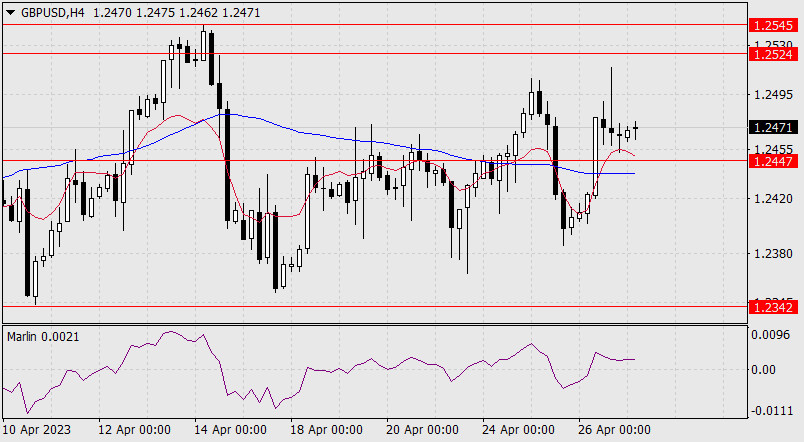
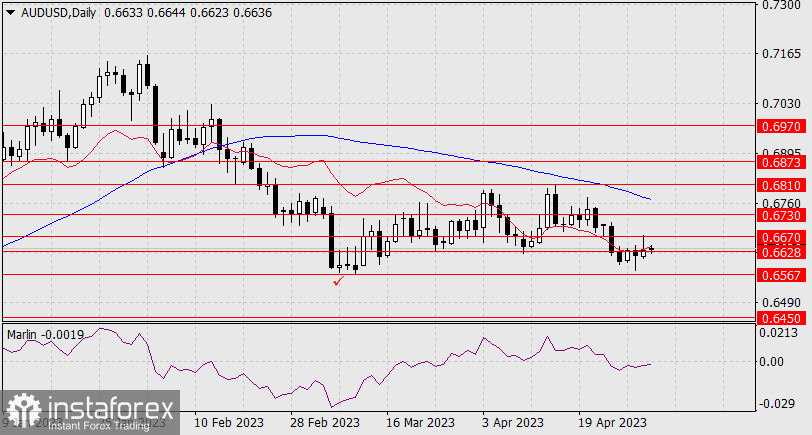
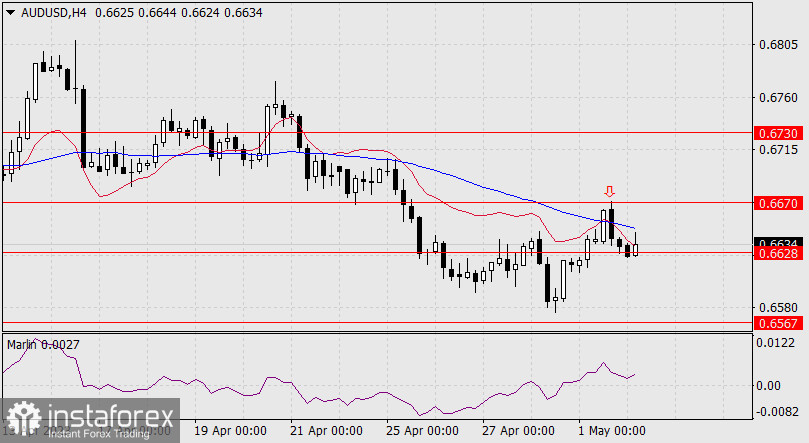
In my opinion, the pair has not exhausted its growth potential, so long positions remain a priority: the dollar temporarily strengthens its positions on shaky foundations and cannot break the northern trend. However, considering long positions is advisable only after EUR/USD buyers consolidate above the 1.1000 mark (Kijun-sen line on the four-hour chart). The next (main) target of the northern movement in this case will be the 1.1100 mark – this is the upper line of the Bollinger Bands indicator on the daily chart.

Analysis are provided by InstaForex.

Read More

Best regards, PR Manager / Learn more about InstaForex Company at http://instaforex.com

Re: InstaForex Analysis

USDJPY, H4 | Bounce off 1st support?

https://forex-images.ifxdb.com/userfiles/20230421/analytics644220307a965.jpg

The USD/JPY chart currently exhibits strong bullish momentum, with potential for prices to bounce off the 1st support level at 133.72 and advance towards the 1st resistance level at 134.73.

The 1st support level, coinciding with current price, is an overlap support that signals a robust buying interest. Additionally, the 2nd support level, aligned with the 61.80% Fibonacci projection, reinforces its importance as a significant support level.

As for resistance levels, the 1st resistance level is a multi-swing high resistance that corresponds with the 61.80% Fibonacci retracement, and is expected to present a significant challenge for upward price movements. Similarly, the 2nd resistance level, a pullback resistance, may also impede bullish momentum.

Analysis are provided by InstaForex.

Read More

Best regards, PR Manager / Learn more about InstaForex Company at http://instaforex.com

Re: InstaForex Analysis

Euro has proven everything to everyone

A strong economy means a strong currency. The soar of the composite business activity index in the Eurozone in April to an 11-month high has become further proof of the accelerating economy of the currency bloc. It doesn't matter that it entirely relies on the service sector, with the gap between its PMI and the manufacturing sector becoming the largest since 2009. What's important is that the region will avoid a recession, and its resilience opens the door for the ECB to further raise interest rates, which positively reflects on EURUSD.

Dynamics of European business activity

https://forex-images.ifxdb.com/userfiles/20230421/analytics644287c3b77df.jpg

Germany is once again becoming the locomotive of European economic growth: the Purchasing Managers' Indices for both Germany and France have exceeded forecasts. At the same time, ECB Vice President Luis de Guindos noted that core inflation in the Eurozone turned out to be persistently high, even more persistent than the market expected. For the European Central Bank not to lose confidence, the indicator should decrease. Such rhetoric implies that the regulator does not intend to rest on its laurels. Most likely, market forecasts about raising borrowing costs to 3.75% are accurate or slightly underestimated.

Bank of Ireland Governor Gabriel Makhlouf also argued that it was too early for the ECB to pause the monetary policy tightening process. He referred to the data available to the European Central Bank, based on which the pause seems premature. It seems that Christine Lagarde's opinion that the European Central Bank has little way ahead is at odds with the views of the Governing Council members. The ECB will undoubtedly raise the deposit rate at the May meeting. The question is by how much, 25 or 50 basis points?

Meanwhile, in the US, the situation is unfolding like a textbook: after rapid GDP growth, the Fed's monetary policy tightens, and then the American economy starts to wobble. Disappointing statistics on existing home sales, manufacturing activity from the Philadelphia Fed, and unemployment benefit claims suggest that a recession is near. If the US faces a downturn and the Eurozone avoids it, why sell EURUSD?

https://forex-images.ifxdb.com/userfiles/20230421/analytics644287cdebb15.jpg

For the week leading up to April 21, the economic calendar will present investors with another puzzle. The key events will be the releases of German and European GDP data for the first quarter, the flash estimate of April inflation in Germany, and statistics on the Personal Consumption Expenditures Index – the Fed's preferred inflation indicator. Almost all important figures will be released at the end of the five-day period, so most of it will involve buying on the facts. The question is, what will be purchased: the US dollar or the euro? Technically, the EURUSD pair has approached the upper limit of the fair value range of 1.08-1.101 at arm's length. A successful assault will open the way for the "bulls" to restore the upward trend towards 1.12 and will form the basis for establishing long positions.

Analysis are provided by InstaForex.

Read More

Best regards, PR Manager / Learn more about InstaForex Company at http://instaforex.com

Re: InstaForex Analysis

EUR/USD. IFO report, weakening of the greenback, strengthening of the euro

The euro-dollar pair returned to the area of the 10th figure today, after a brief southern correction. At the beginning of last week, sellers tried to launch a counteroffensive but stopped at the base of the 9th figure. Then, buyers regained the initiative but failed to overcome the psychologically important price barrier of 1.1000. At the start of the new trading week, the EUR/USD bulls are once again entering the battle, despite an almost empty economic calendar.

https://forex-images.ifxdb.com/userfiles/20230424/analytics6446946881480.jpg

However, the only significant release on Monday (the IFO index) turned out to be on the side of the euro - almost all components of the release were in the "green zone", reflecting an improvement in the situation. But overall, the northern trend of the EUR/USD is primarily due to the weakening of the US currency: the US dollar index is under pressure today, amid increased interest in risk assets.

The "green hue" of the IFO report

According to data published today, the German IFO Business Climate Index in April slightly improved - to 93.6 points with a forecast of growth to 93.4. On the one hand, the indicator has grown minimally compared to the March values. On the other hand, the index demonstrates a consistent upward trend for the seventh month in a row. For comparison, it is worth noting that in September last year, it was at the level of 84.4 points. Another component of the release also came out in the "green zone": the IFO Economic Expectations indicator, which has also been consistently growing for seven months in a row.

Commenting on the published report, IFO Institute economist Klaus Wohlrabe said that, on the one hand, the German economy is far from a significant recovery. On the other hand, there are positive trends - for example, Wohlrabe noted that recent shocks in the banking sector (SVB, Credit Suisse) did not have a strong impact on the sentiment of German companies. He also pointed out that the economies of China and the United States are supporting German industry: manufacturers' expectations regarding exports have "noticeably increased." In addition, the IFO representative reported that the share of German companies that want to increase prices "has declined again."

The euro received additional support from the Bundesbank report published today, according to which the German economy in the first quarter of this year "turned out to be stronger than expected", and business activity has grown again. However, the prospects for further recovery "remain ambiguous" – due to inflation, which is still putting pressure on consumption.

Nevertheless, today's growth of the EUR/USD pair is primarily due to the weakening of the US currency. The euro received minor support from the IFO Institute, but this release only complemented the already established fundamental picture.

The dollar is losing its grip

Recall that last week the dollar strengthened its position due to two factors: an increase in hawkish expectations regarding the further actions of the Federal Reserve (against the background of statements by Waller and Bullard) and an increase in risk-averse sentiment. This week, these fundamental factors have weakened their influence. The market has crystallized the opinion that the Federal Reserve will raise the rate by 25 basis points at the May meeting, while further steps will depend on the incoming data (in the field of inflation). Waller's statement about "several increases" is rather hypothetical: at present, traders are confident only in the May increase. According to the data from the CME FedWatch Tool, the probability of implementing a 25-point scenario in May is now almost 90%. At the same time, the probability of maintaining the status quo at the June meeting is almost 70%.

At the same time, hawkish expectations regarding the further actions of the European Central Bank continue to strengthen. For example, according to experts from the investment bank Brown Brothers Harriman, there is currently about a 30% probability of a 50 basis point rate hike at the May meeting. Further in the prices, another 25-point increase is expected in June and another 25-point increase in July.

Moving forward, the ECB may take a break, but the probability of a "final chord" – another rate hike in the fall (at the September or October meeting) – is currently almost 50%. Consequently, the final rate level is now considered in the range of 3.75%-4.0%. For comparison, it is worth noting that at the beginning of last week, BBH's expectations for the peak rate were at 3.75%, and the week before that – 3.50%. Hawkish expectations have increased due to corresponding statements from ECB representatives, who, in the majority, continue to insist on maintaining a hawkish course.

Conclusions

The euro-dollar pair has resumed its upward trend after a brief pause and a southern correction. Looking at the weekly chart of EUR/USD, we can see that the pair has been within an upward trend since the end of February. The southern price pullback that we observed last week was a correction against the temporary strengthening of the greenback.

At the end of this week, crucial macroeconomic reports for EUR/USD will be published: US GDP, core PCE index, and German CPI. These releases can "redraw" the fundamental picture for the pair. But for today, the established information background contributes to the strengthening of the upward movement.

From a technical point of view, the pair on the daily chart is between the middle and upper lines of the Bollinger Bands indicator, as well as above all the lines of the Ichimoku indicator, which has formed a bullish signal "Parade of Lines". The first intermediate target is 1.1050 (the upper line of the Bollinger Bands indicator on the D1 timeframe). After overcoming it, the next target of the upward trend will be the 1.1100 mark.

Analysis are provided by InstaForex.

Read More

Best regards, PR Manager / Learn more about InstaForex Company at http://instaforex.com

Re: InstaForex Analysis

Forecast for EUR/USD on April 26, 2023

EUR/USD
The euro did not take the chance to overcome the nearest peak of April 14 at 1.1076, and so its high was 1.1068. Thus, there will be no divergence. In this case, the growth of the last five days takes on the role of correction from the fall of April 14-17. The price clearly shows the intention to reach the support of the MACD line, coinciding with the low of April 17 at 1.0910. When the price reaches this target, the Marlin oscillator will already be in negative territory, which will help in overcoming this level to attack the lower support of 1.0872 - on the embedded line of the green downtrend channel.

https://forex-images.ifxdb.com/userfiles/20230426/analytics64488bf4f0b89.jpg

The First Republic Bank reported a loss of 102 billion in client funds. The bank's shares collapsed by 49.38%, pulling the S&P 500 down by 1.58%. Yields on US government bonds fell, and the market probability of the Federal Reserve raising the rate by 0.25% next week also decreased (76.2% vs. 88.1% the day before), but markets are already preparing for a new wave of crisis (in the US), which is expected to start this summer. The dollar will strengthen in this crisis, as demonstrated yesterday, in the role of a protective asset.

On the four-hour chart, the price has consolidated below the MACD indicator line, and the Marlin oscillator has moved towards the decline. I expect the price to fall to the nearest target of 1.0910. However, market participants are waiting for comments from the Fed representatives regarding the current situation, so despite the technical prerequisites, we do not expect a significant decline until May 3rd.

https://forex-images.ifxdb.com/userfiles/20230426/analytics64488bea330d5.jpg

Analysis are provided by InstaForex.

Read More

Best regards, PR Manager / Learn more about InstaForex Company at http://instaforex.com

Re: InstaForex Analysis

Forecast for GBP/USD on April 27, 2023

GBP/USD
The British pound continues its sideways movement in anticipation of the FOMC meeting next week. The upper limit of the range is the April 14th peak at 1.2545. Breaking through it will extend growth to 1.2598. Slightly higher is the second target level of 1.2666 – the peak of May 2022.

https://forex-images.ifxdb.com/userfiles/20230427/analytics6449e25e96e89.jpg

A sign of further price growth is the Marlin oscillator, turning upwards from the zero line – from the limit of the area of the downtrend.

If the price falls, the range will end with overcoming the MACD line (1.2342).

https://forex-images.ifxdb.com/userfiles/20230427/analytics6449e241a93d3.jpg

On the four-hour chart, the price has consolidated above the indicator lines, and the signal line of the Marlin oscillator is in the positive area. The pound has a good chance of surpassing yesterday's peak. Especially if today's US GDP data turns out to be lower than forecasted.

Analysis are provided by InstaForex.

Read More

Best regards, PR Manager / Learn more about InstaForex Company at http://instaforex.com

Re: InstaForex Analysis

EUR/USD. "The specter of stagflation": the US economy weakens, inflation grows

The American economy in the first quarter disappointed, but the dollar is strengthening its positions across the market, including the euro pair. After impulsive growth to the middle of the 10th figure, the EUR/USD pair turned 180 degrees and headed south. At the moment, bears are testing the nearest support level of 1.1000, corresponding to the Tenkan-sen line on the daily chart. Such an anomalous, at first glance, reaction of the greenback is due primarily to the strengthening of hawkish expectations regarding the Fed's further actions. The dollar is growing amid the threat of stagflation in the US, as today's release shows that consumer spending is still strong, and inflationary pressure remains at an unacceptably high level.

In the language of dry numbers

US GDP growth in the first quarter of this year was almost twice as bad as expected. According to forecasts, the US economy was supposed to grow by 2.0%, reflecting a downward trend (in the fourth quarter of 2022, growth was recorded at 2.6%). However, GDP volume increased by only 1.1%, which is much lower than economists' expectations.

Notably, after the publication, the likelihood of a 25-point increase in the Fed's interest rate at the May meeting rose to 82%. That is, the market is virtually confident that the regulator will increase the rate to 5.25% next week, despite the "red hue" of the headline indicator in today's report.

https://forex-images.ifxdb.com/userfiles/20230427/analytics644a998724bc0.jpg


As they say, the devil is in the details. The release structure shows that the US economy is slowing down amid high inflation. For example, the GDP price deflator in the first quarter increased by 4.0% YoY, while economists expected this component to grow by 3.7% YoY (I recall that in the fourth quarter, the indicator grew by 3.9% YoY). The core GDP price deflator in the first quarter was also in the "green zone," rising by 4.9% YoY, with a forecast of 4.7% YoY growth (fourth quarter result – 4.4% YoY). That is, consumer spending, which accounts for a large part of GDP, grew at the highest rate since the second quarter of 2021; the volume of government spending increased at the highest rate since the beginning of the year before last.

What the release says

It should be recalled that the core consumer price index excluding food and energy prices in March started to gain momentum again. In annual terms, the indicator rose to 5.6% in March. Over the previous five months, the core CPI had been declining – from 6.6% (in September 2022) to 5.5% (in February 2023). For the first time in the last six months, the growth rates of the core index accelerated. At the same time, overall inflation, the producer price index, the import price index – all these inflation indicators came out in the "red zone," reflecting active downward dynamics.

In other words, all conditions for another round of the Fed's interest rate hike have been met today. The "last puzzle" will be the publication of core PCE inflation indicators (the release is scheduled for tomorrow, April 28). If Friday's numbers also come out in the green zone, the results of the May meeting will be virtually predetermined.

Indirect support for the greenback was provided by the US labor market data released today. It turned out that the number of initial jobless claims increased by 230,000 last week. The indicator showed an upward trend for two weeks in a row (+240, +246 thousand), but a decline was recorded today.

However, the US housing market continues to disappoint dollar bulls. It became known today that the volume of pending home sales in the US in March fell by 5.2% (in monthly terms), with a forecast of 0.8% growth. In annual terms, transactions fell by 23.2%, compared to analysts' forecast of a 22.8% decline. I recall that earlier released reports in this area also reflected negative dynamics. In particular, the volume of home sales in the secondary market in March decreased by 2.4% (the weakest result since November 2022). The indicator of building permits issued in the States in March fell by 8.8%, indicating that the high cost of borrowing is putting pressure on this sector of the economy.

Conclusions

The GDP growth report published today reflects the threat of stagflation in the US: the country's economy is growing at a weak pace, while inflationary components are gaining momentum. Therefore, today's release de facto ended up on the side of the dollar, as it strengthened investors' confidence that the Federal Reserve will indeed decide on another rate hike.

At the same time, this fact is already largely priced in, so the current strengthening of the greenback is likely to be temporary.

It should also be recalled that on the eve of the May meeting, another bank in the US (with a market capitalization of $1.06 billion) was on the verge of collapse. First Republic, whose securities fell by almost 50%, risks repeating the fate of Silicon Valley, Signature Bank, and Silvergate. The bank reported that clients withdrew $100 billion from accounts, and deposits decreased by more than 40%. In light of such news, the Federal Reserve is unlikely to be aggressive next week, so as a result of the May meeting, the dollar may come under strong pressure, even despite the fact of a 25 basis point rate hike.

Thus, in my opinion, it is advisable to use southern price pullbacks on the EUR/USD pair to open long positions with the first target at 1.1050 (upper Bollinger Bands line on the daily chart) and the main target at 1.1100.

Analysis are provided by InstaForex.

Read More

Best regards, PR Manager / Learn more about InstaForex Company at http://instaforex.com

Re: InstaForex Analysis

Forex Analysis & Reviews: High inflationary pressure forces the Fed to continue raising rates

Euro and pound decline on news that two key inflation indicators showed sustained pressure in the US in recent months, supporting the case for a new interest rate hike by the Federal Reserve System next week.

The Personal Consumption Expenditures (PCE) price index, excluding food and energy, the Fed's preferred core inflation measure, rose 0.3% in March compared to the previous month and 4.6% compared to a year earlier. The Commerce Department report also said that the employment cost index, which the Fed also closely monitors, rose 1.2% in the first quarter compared to the previous period, exceeding economists' forecasts.

https://forex-images.ifxdb.com/userfiles/20230429/analytics644cc8fb14ee1_source!.jpg

I would like to remind you that the main goal of the Fed is a 2% level, which is measured by a broader indicator, but the regulator considers the core indicator as a better indicator of the trend.

Price data, especially in combination with rising labor costs, confirm expectations that Fed policymakers will continue to raise interest rates, raising them by another quarter of a percentage point at next week's meeting.

A positive aspect in the PCE report was the slowdown in the growth of service costs. Thus, service prices, excluding housing, rose only 0.2% in March. However, in annual terms, the indicator remains elevated at 4.5%.

Despite this, there are concerns that persistent inflation in the service sector, partly driven by strong wage growth in these industries, risks keeping price growth above the Fed's target indicator in the foreseeable future.

As for further benchmarks, since it is obvious that the Fed will raise rates at the May 2-3 meeting, many expect the regulator to then take a long pause, but the latest data allow for a more aggressive approach that the committee could use as early as next week.

Personal consumption expenditures, adjusted for prices, remained unchanged last month, reflecting reduced spending on goods and moderate spending on services after a revised 0.2% decrease in February. The decline in consumer spending indicates that households are becoming more cautious and cutting purchases.

https://forex-images.ifxdb.com/userfiles/20230429/analytics644cc903893e0_source!.jpg

As for income, it grew by 0.3%. Real wages also grew by 0.3% for the month. The saving rate jumped to 5.1% - the highest level since the end of 2021. Regarding the technical picture of EURUSD, the bulls still have a chance to continue the growth. To do this, they need to stay above 1.1000 and take control of 1.1030. This will allow them to move beyond 1.1060. From this level, it is possible to climb to 1.1100. In case of a decline in the trading instrument, only around 1.1000 do I expect any actions from major buyers. If there is no one there, it would be good to wait for the minimum of 1.0960 to be updated, or to open long positions from 1.0940.

Risk Warning: CFDs are complex instruments and come with a high risk of losing money rapidly due to leverage. 77.95% of retail investor accounts lose money when trading CFDs with this provider. You should consider whether you understand how CFDs work and whether you can afford to take the high risk of losing your money.

Analysis are provided by InstaForex.

Read More

Best regards, PR Manager / Learn more about InstaForex Company at http://instaforex.com

Re: InstaForex Analysis

Forex Analysis & Reviews: Forecast for AUD/USD on May 2, 2023

AUD/USD
On Monday, the Australian dollar tested the resistance level of 0.6670, and under pressure due to the US dollar (#USDX 0.43%), returned to the support of 0.6628. On the daily chart, the Marlin oscillator did not react to the asset's growth. Marlin remains in the area of the downtrend.

https://forex-images.ifxdb.com/userfiles/20230502/analytics645073e2b5d67_source!.jpg

At the moment, the price is trying to overcome this support; in a few hours, the Reserve Bank of Australia will make a decision on monetary policy, with the rate expected to be at 3.60%. Such a decision is unlikely to contribute to the strengthening of the Australian currency, even if the rhetoric is moderately aggressive, as tomorrow, the Federal Reserve Is almost guaranteed to raise the rate by at least 0.25%. The nearest target is 0.6567 – the low of March 8, then we expect movement to 0.6450.

https://forex-images.ifxdb.com/userfiles/20230502/analytics645073d107a71_source!.jpg

On the four-hour chart , yesterday's movement above the MACD indicator line (blue) and a quick return below it indicates the falsity of yesterday's surge. The price has already consolidated below the line. We are waiting for the RBA's decision and expect the price to fall further.

If the price climbs above 0.6670 and consolidates, it will open an alternative scenario with growth to 0.6730.

Analysis are provided by InstaForex.

Read More

Best regards, PR Manager / Learn more about InstaForex Company at http://instaforex.com

Posts: 1,301 to 1,325 of 1,547

Pages Previous 1 51 52 53 54 55 62 Next

You must login or register to post a reply

Forex Software → Market Analysis → InstaForex Analysis

Similar topics in this forum