forex software

Create and Test Forex Strategies

forex software

Skip to forum content

Forex Software

Create and Test Forex Strategies

You are not logged in. Please login or register.


(Page 50 of 62)

Forex Software → Market Analysis → InstaForex Analysis

Pages Previous 1 48 49 50 51 52 62 Next

You must login or register to post a reply

RSS topic feed

Posts: 1,226 to 1,250 of 1,547

Re: InstaForex Analysis

Forex Analysis & Reviews: Technical Analysis of Daily Price Movement of Major Currency Pairs GBP/USD, Monday, December 12 2022.

https://forex-images.ifxdb.com/userfiles/20221212/analytics63968f273e17b.jpg

On the daily chart the main GBP/USD currency pair is starting to show signs of saturation over the rally that occurred over the previous few days, as reflected in several things:

1. 1.2296 is difficult to break upwards
2. The appearance of the Bearish = Rising Wedge pattern.
3. Formation of a Bearish pattern 123.
4. The appearance of Bearish Wiseman 1 & 2 signals.

Therefore, in the next few days, as long as Cable does not reverse its rally up above the 1.2344 level, this major currency pair still has the potential to depreciate to the 1.2045 level as its main target and if the decline has quite high volatility then it is possible that the 1.1777 level will become next target to go to.

*The market analysis posted here is meant to increase your awareness, but not to give instructions to make a trade.

Analysis are provided by InstaForex.

Read More

Best regards, PR Manager / Learn more about InstaForex Company at http://instaforex.com

Re: InstaForex Analysis

Forex Analysis & Reviews: Forecast for EUR/USD on December 13, 2022

Investors raise their expectations this week, in which several central banks meetings (Federal Reserve, European Central Bank, Bank of England) are held, given the ongoing divergence between central banks' monetary policies. The Fed will become softer, while the ECB will be more hawkish. Formally, the forecast for a rate hike by all central banks is the same - 0.50%, but there has been so much talk about a surprise from the ECB that a 0.75% hike has become a forecast rather than a surprise. And that's why the euro closed Monday at the opening level despite the decline of other counter-dollar currencies.

https://forex-images.ifxdb.com/userfiles/20221213/analytics6397e44048a99.jpg

This morning, the price is trying to rise. Today's main event will be the US inflation report for November. CPI is expected to decline from 7.7% y/y to 7.3% y/y. The euro has a chance to reach the target range of 1.0615/42. If the divergence in the sentiment of the central banks is really strong, the euro may go higher, to the range of 1.0758/87 (highs in May and June).

On the four-hour chart, the price failed to fall under support of the MACD line. The last reversal from it occurred this morning. The Marlin oscillator is shifting to the upside. We expect the price to reach the first target range of 1.0615/42.

https://forex-images.ifxdb.com/userfiles/20221213/analytics6397e42e5b3cb.jpg

The market analysis posted here is meant to increase your awareness, but not to give instructions to make a trade.

Analysis are provided by InstaForex.

Read More

Best regards, PR Manager / Learn more about InstaForex Company at http://instaforex.com

Re: InstaForex Analysis

Forex Analysis & Reviews: Gold to outperform Bitcoin in the long term

https://forex-images.ifxdb.com/userfiles/20221214/analytics6399919ea5cd9.jpg

Goldman Sachs called gold a "more useful portfolio diversifier" and said it will outperform Bitcoin in the long term. They explained that real demand for the metal is not as affected by tightening financial conditions as the world's largest cryptocurrency, not to mention it has clear non-speculative uses unlike Bitcoin, which traders view as a stock for fast-growing technology companies. Gold is also used as a hedge against dollar devaluation and inflation.

Of course, Bitcoin could still be used as a hedge, especially since its potential comes from future use cases. But this makes it much more volatile and speculative compared to gold. Also, it surged when investors became interested in decentralized currencies, however, tighter financial conditions will not work in favor of cryptocurrency. Bitcoin's downward volatility has also been boosted by systemic concerns as several major players have declared bankruptcy.

Latest data indicates that spot gold is up 0.23% y/y, while Bitcoin is down 63%.

Going forward, gold is likely to get a boost from additional macroeconomic volatility. It could benefit from structurally higher macroeconomic volatility and the need to diversify its equity investments. Tighter liquidity should also have less impact on gold, which is more exposed to real drivers such as demand. These include physical demand, central bank purchases (which have been on record this year), investments in safe-haven assets and industrial applications.

*The market analysis posted here is meant to increase your awareness, but not to give instructions to make a trade.

Analysis are provided by InstaForex.

Read More

Best regards, PR Manager / Learn more about InstaForex Company at http://instaforex.com

Re: InstaForex Analysis

Forex Analysis & Reviews: Technical Analysis of Intraday Price Movement of Nasdaq 100, Thursday December 15, 2022.

https://forex-images.ifxdb.com/userfiles/20221215/analytics639a9bad6f74d.jpg

Although on its 4 hour chart Nasdaq 100 index seems move in a ranging condition but with the appearance of:
1. The deviation between price movement with CCI indicator.
2. The appearance of Bearish 123 pattern.
3. Followed by the appearance of Ross Hook (RH).

Based on three things above then in a nearest term #NDX has a potential to try to go down to test the Bearish Ross Hook level at 11608.9 if this level is successfully broken then the next level to go to is 11410.1 but if on the way to these levels there is a sudden upward correction to pass the 12007.9 level then the scenario of a decline has been described earlier will cancel by itself.

(Disclaimer)
*The market analysis posted here is meant to increase your awareness, but not to give instructions to make a trade.

Analysis are provided by InstaForex.

Read More

Best regards, PR Manager / Learn more about InstaForex Company at http://instaforex.com

Re: InstaForex Analysis

Forex Analysis & Reviews: Trading Signal for GOLD (XAU/USD) on December 16-19, 2022: sell below $1,794 (5/8 Murray - 21 SMA)

https://forex-images.ifxdb.com/userfiles/20221216/analytics639bff337eae2.jpg

Early in the European session, gold (XAU/USD) is trading around 1,781, bouncing after hitting the low at 1,773.67.

XAU/USD is trading below the uptrend channel and below the 21 SMA (1.795). The 4-hour chart shows further downside potential. The gold price is trading in the area of strong bearish pressure. If the price consolidates below of 1,790, it could reach the level of 200 EMA around 1,754.

Since its maximum reached at 1,824 on Tuesday, gold has lost more than $50, so this weekly drop could be a sign of a probable change in trend in the short term.

Gold is expected to continue its bounce in the next few hours and can reach the area of 1,790 - 1,795. Around this level, there will be a clear signal to sell with targets at 1,781-1,755.

In case the bearish pressure persists, XAU/USD is expected to trade below the 5/8 Murray located at 1,781 and may continue to decline in the coming days until it reaches the 4/8 Murray area around 1,750. 

Our trading plan is to sell gold below 1,795, targeting 1,780 at 1,754. The eagle indicator is giving a negative signal which supports our bearish strategy.

*The market analysis posted here is meant to increase your awareness, but not to give instructions to make a trade.

Analysis are provided by InstaForex.

Read More

Best regards, PR Manager / Learn more about InstaForex Company at http://instaforex.com

Re: InstaForex Analysis

Forex Analysis & Reviews: Technical Analysis of Daily Price Movement of USD/CAD Commodity Currency Pairs, Monday, December 19 2022.

https://forex-images.ifxdb.com/userfiles/20221219/analytics639fbe176b14e.jpg

If you pay attention to the daily chart, the USD/CAD commodity currency pair appears to be stuck in the weekly Resistance Orderblock area which is quite significant at 1.3702 where at the same time a Double Top pattern (Cyan circle) is formed which is also followed by a deviation between its price movement and the Awesome Oscillator indicator, in addition to the emergence the Ascending Broadening Wedge pattern is also strengthening if in the next few days The Loonie will be brought down to the level of 1.3225 but with a note that during the fall there was no significant upward correction movement that exceeded and penetrated above the 1.3750 level because if this level is successfully broken above, the decline scenario described previously will become invalid and cancel by itself.

*The market analysis posted here is meant to increase your awareness, but not to give instructions to make a trade.

Analysis are provided by InstaForex.

Read More

Best regards, PR Manager / Learn more about InstaForex Company at http://instaforex.com

Re: InstaForex Analysis

Forex Analysis & Reviews: Technical Analysis of Intraday Price Movement of Gold Commodity Asset, Tuesday December 2022

https://forex-images.ifxdb.com/userfiles/20221220/analytics63a118233a9c2.jpg

Since successfully breaking above the 1807.21 level on the 4-hour chart, gold has been pulled down again by market participants which is now that gold has tested the fairly good resistance level at 1796.52, gold is now falling back down to test the 1773.31 level. If this level is successfully broken down, gold will depreciate go down to 1762.44 as the main target and if the momentum and volatility are sufficiently supportive then the next level to aim for is 1733.04 as long as it is on the way to the target level there is no significant correction to break above the 1813.58 level where if this level is successfully penetrated upwards then a decline scenario previously described will be canceled by itself.

*The market analysis posted here is meant to increase your awareness, but not to give instructions to make a trade.

Analysis are provided by InstaForex.

Read More

Best regards, PR Manager / Learn more about InstaForex Company at http://instaforex.com

Re: InstaForex Analysis

Forex Analysis & Reviews: Trading Signal for GOLD (XAU/USD) for December 21 - 22, 2022: sell below $1,821 and $1,809 (21 SMA - 6/8 Murray)

https://forex-images.ifxdb.com/userfiles/20221221/analytics63a282f0b88f2.jpg

Early in the European session, Gold (XAUUSD) is trading around 1,816.14 above the 6/8 Murray and within the downtrend channel formed on December 12.

Yesterday, during the European session and the American session, gold started a strong bullish movement after it had broken the pennant pattern. In view of the fact that this pattern has completed its goal, it is probable that there will be a technical correction in the next few hours and the metal could reach the support of 1,810.

In case the uptrend continues and the price breaks above 1,821, it could accelerate the bullish move towards daily R_1 around 1,830.

Conversely, in case XAU/USD continues trading below 1,821, we could expect a decline and the price may reach the 1,810 zone. A sharp break below this level could trigger a bearish signal and we could expect a fall towards the 200 EMA located at 1,792.

Our trading plan for the next few hours is to sell below 1,821 with targets at 1,810. If gold consolidates above the 21 SMA, we can expect a technical bounce to resume buying with targets at 1,821 and 1,830.

In case gold consolidates below 1,809, it will be a clear signal to sell with targets at 1,800 and 1,793 (200 EMA). The eagle indicator on the 1-hour chart is showing overbought levels, hence, an imminent correction could occur in the next few hours.

*The market analysis posted here is meant to increase your awareness, but not to give instructions to make a trade.

Analysis are provided by InstaForex.

Read More

Best regards, PR Manager / Learn more about InstaForex Company at http://instaforex.com

Re: InstaForex Analysis

Forex Analysis & Reviews: Technical Analysis of Intraday Price Movement of Dow Jones Industrial Average Index, Thursday December 22 , 2022.

https://forex-images.ifxdb.com/userfiles/20221222/analytics63a3d7c745b7b.jpg

If we look at the 4-hour chart, the Dow Jones Industrial Average index seems to be corrected upwards to test the SBR (Support Become Resistance) level which also happens to be the Daily Breaker Block from #INDU, namely level 33415.9 where this level also happens to be in the Bearish Fair Value Gap area. even though the upward correction of the rally has been confirmed by the appearance of deviations between the #INDU price movement and the Stochastic Oscillator indicator, if the Resistance levels previously described are strong enough to withstand the upward correction rally and/or as long as it does not break above the 33756.6 level, then #INDU has the opportunity to fall back down to the level area 32612.4-32241.9 as the first target and the area level 31761.6-31240.1 as the second target.

*The market analysis posted here is meant to increase your awareness, but not to give instructions to make a trade.

Analysis are provided by InstaForex.

Read More

Best regards, PR Manager / Learn more about InstaForex Company at http://instaforex.com

Re: InstaForex Analysis

Forex Analysis & Reviews: Forecast for USD/JPY on December 23, 2022

Yesterday, the yen was calm, its slow growth (growth of the USD/JPY pair which means that the dollar rose) did not face any resistance, so this morning it continues to gradually rise. The price is facing the 133.35 target, the nearest internal resistance line in the price hyperchannel of the monthly chart.

https://forex-images.ifxdb.com/userfiles/20221223/analytics63a517b636731.jpg

The Marlin oscillator can grow without interruptions until it touches the zero line. From 133.35, a synchronous reversal of the price and the oscillator downwards, to the target of 130.58.

Yesterday, the U.S. stock index S&P 500 fell by 1.45%, and if the yen, with the Bank of Japan's help, will push for its role as a safe haven, then the pair could fall further to support around 127.00.

https://forex-images.ifxdb.com/userfiles/20221223/analytics63a517c40f0de.jpg

On the four-hour chart, the Marlin oscillator has already reached the zero line. But the price can still reach 133.35. The main movement is likely to occur after the Christmas holidays.

*The market analysis posted here is meant to increase your awareness, but not to give instructions to make a trade.

Analysis are provided by InstaForex.

Read More

Best regards, PR Manager / Learn more about InstaForex Company at http://instaforex.com

Re: InstaForex Analysis

Forex Analysis & Reviews: GBP/USD. Overview for December 26, 2022

https://forex-images.ifxdb.com/userfiles/20221226/analytics63a8e5dbd5248.jpg

In contrast to the EUR/USD pair, the GBP/USD currency pair is still in motion. Now that the pound is at least moving and not just standing still, we aren't talking about a volatile movement anymore. Although, based on Friday, there were no noteworthy movements, the pound/dollar pair may also experience a flat in the upcoming months. In essence, there were the same reports from the United States on Friday regarding the pound and the euro. And as we can see, they had no impact on the pair's movement. Given that the reports were so brief, this does not surprise us. The month's major events are all over, and now that the holidays have started, there is no doubt that traders are less motivated to engage in active trading.

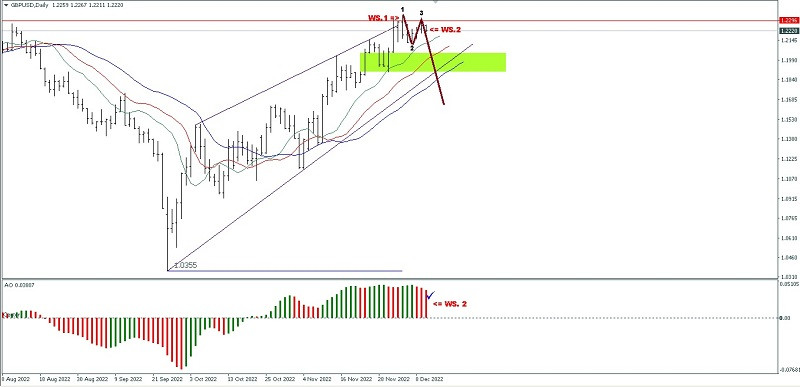
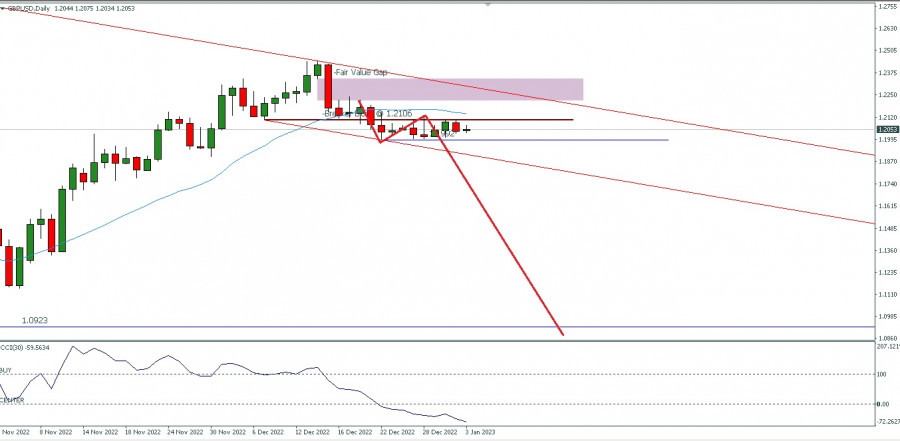
Technically speaking, the price is still below the moving average, and the downward movement is still present. Thus, everything in this situation makes sense. For the past three weeks, we have been anticipating a significant downward correction. It is not yet "strong," but at least it has something. Since the British economy may experience a severe recession and the Bank of England rate will not continue to rise at its current rate indefinitely, we think the pound should continue to decline against the US dollar. However, inflation is still out of control, and we have serious doubts that it will start to slow down soon at a rate comparable to that in the United States. This compels the Bank of England to keep tightening monetary policy, on the one hand. On the other hand, the third quarter saw a decline in the economy, and officials have predicted a two-year recession. Tightening monetary policy inevitably means making the recession worse. As a result, we don't think the British regulator will keep raising the rate by 0.50% every time they meet.

The period of consolidation might start soon.

The absence of trend movement in the overall plan is what we refer to as the consolidation period. Recall that the pair's growth over the past few months, which is a correction in and of itself, followed an approximately two-year downward trend. As a result, the correction against the correction has already started. After that, the pair may enter a long-term "swing" on the senior TF, which would indicate the absence of any new significant factors like a global tightening or loosening of monetary policy or changes in geopolitics. We won't be surprised if 2023 also has surprises because of the trend of recent years (the situation is getting worse and worse every year). The "coronavirus" is raging in China, and it is dispersing at a completely abnormal rate, according to the most recent information. One of the messages mentioned a day-long infection of 37 million people. As a result, COVID still terrorizes humanity and has not disappeared. The world will once more experience economic issues if it spills out of the Celestial Empire. Lockdowns, quarantines, and widespread infections can all begin anew. Then there are the central bank incentive plans and a new rise in inflation. Overall, it is still very early to resolve this problem.

We are also certain that there will be geopolitical news. Many military experts believe that the coming year will be crucial in the military conflict in Ukraine. We cannot define what "decisive" means, but we can only state that neither side in this conflict intends to engage in peace talks. Therefore, in our opinion, it will only get worse and continue. Additionally, the euro and the pound are risky currencies that will happily decline if the global situation deteriorates. It still hasn't even calmed down.

https://forex-images.ifxdb.com/userfiles/20221226/analytics63a8e5eb247f7.jpg

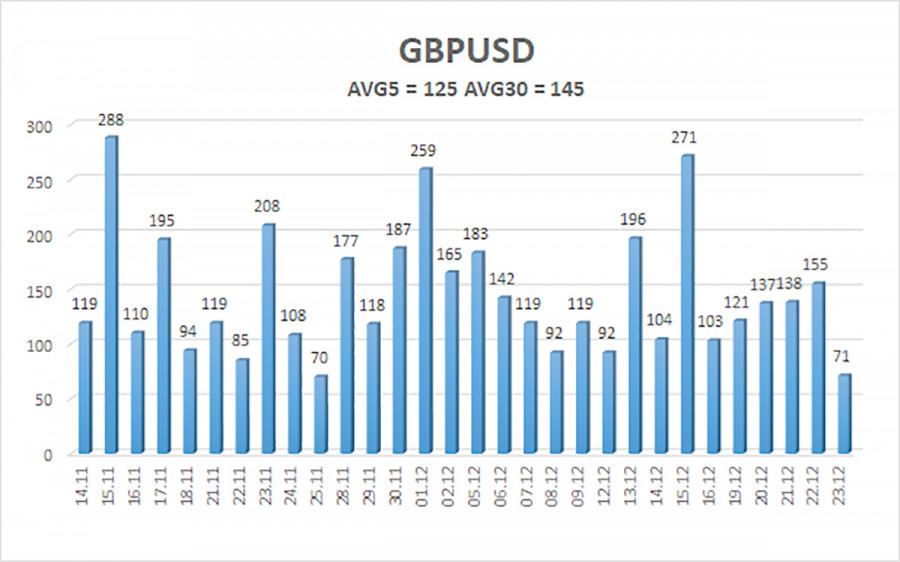
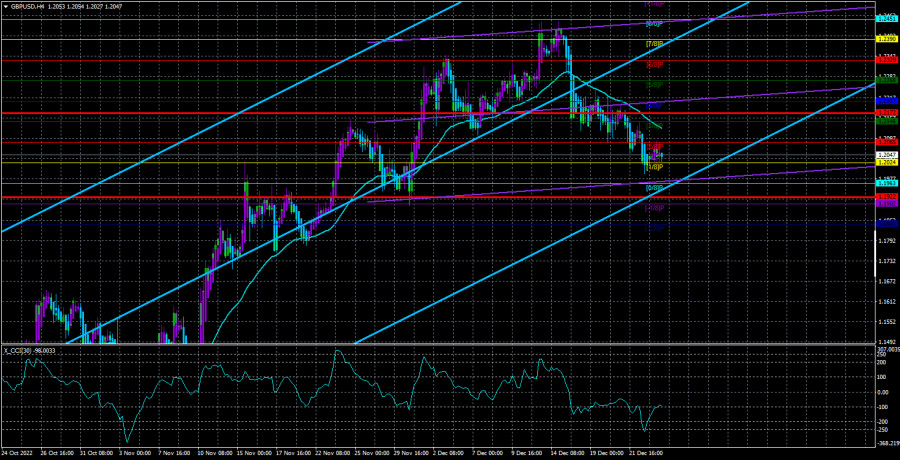
Over the previous five trading days, the GBP/USD pair has averaged 131 points of volatility. This value is "high" for the dollar/pound exchange rate. As a result, on Friday, December 23, we anticipate channel movement that is constrained by levels of 1.1899 and 1.2161. A round of upward correction will begin if the Heiken Ashi indicator reverses direction upward.

Nearest levels of support
S1 – 1.2024
S2 – 1.1963
S3 – 1.1902
Nearest levels of resistance
R1 – 1.2085
R2 – 1.2146
R3 – 1.2207

Trading Suggestions:
On the 4-hour timeframe, the GBP/USD pair is still trending downward. Therefore, until the Heiken Ashi indicator appears, you should maintain sell orders with targets of 1.1963 and 1.1899. When the moving average is fixed above, buy orders should be placed with targets of 1.2207 and 1.2268.

Illustration explanations:

Linear regression channels are used to identify the current trend. The trend is currently strong if they are both moving in the same direction.

Moving average line (settings 20.0, smoothed): This indicator identifies the current short-term trend and the trading direction.

Murray levels serve as the starting point for adjustments and movements.

Based on current volatility indicators, volatility levels (red lines) represent the likely price channel in which the pair will trade the following day.

A trend reversal in the opposite direction is imminent when the CCI indicator

*The market analysis posted here is meant to increase your awareness, but not to give instructions to make a trade.

Analysis are provided by InstaForex.

Read More

Best regards, PR Manager / Learn more about InstaForex Company at http://instaforex.com

Re: InstaForex Analysis

Forex Analysis & Reviews: Analysis of Gold for December 27,.2022 - Potential for the further growth

https://forex-images.ifxdb.com/userfiles/20221227/analytics63aaa386a876a.jpg

Technical analysis:

Gold has been trading upside as I expected and there is potential for the further growth.

Trading recommendation:

Due to the rejection of the rising trend-line and strong upside trend in the background, I see potential for the further growth.

Watch for the potential buying opportunities on the intraday dips with the first upside objective at the price of $1.821

Stochastic oscillator is showing fresh upside momentum, which is strong sign that buyers are in control.

Key support is set at the price of $1.783

*The market analysis posted here is meant to increase your awareness, but not to give instructions to make a trade.

Analysis are provided by InstaForex.

Read More

Best regards, PR Manager / Learn more about InstaForex Company at http://instaforex.com

Re: InstaForex Analysis

Forex Analysis & Reviews: Technical Analysis of Intraday Price Movements of USD Index, Wednesday December 28, 2022

https://forex-images.ifxdb.com/userfiles/20221228/analytics63abc5ab750bb.jpg

The United States Dollar Index on the 4-hour chart seems to be moving in ranging conditions in the range of 103.42-104.90 which has also been confirmed by the movement of the Moving Average which is moving in the range of the body of the Candlestick, this is understandable given that there are not many market participants. which is still in the Christmas and New Year holiday season but based on the CCI indicator which managed to break above the -100 level and above level 0 which indicates that the condition of Buyers is still more dominant than Sellers plus there is a deviation between price movements and the CCI indicator, it seems that in In the near future, USDX will try to test a level above its current price, namely 104.75 as its first target and 104.90 as its second target, but given the low volatility if USDX falls below the 103.72 level, it is very likely that the scenario described earlier will become invalid and cancel itself.

*The market analysis posted here is meant to increase your awareness, but not to give instructions to make a trade.

Analysis are provided by InstaForex.

Read More

Best regards, PR Manager / Learn more about InstaForex Company at http://instaforex.com

Re: InstaForex Analysis

Forex Analysis & Reviews: Technical Analysis of Intraday Price Movements of Nasdaq 100 Index, Thursday December 29 2022.

https://forex-images.ifxdb.com/userfiles/20221229/analytics63acff5751277.jpg

With the appearance of the deviation between Nasdaq 100 index price movements with the indicator as well as the price movement which is below the 100 Moving Average and the appearance of the Bearish 123 pattern which is followed by a break of Ross Hook (RH), it is certain that the #NDX condition is in a bearish situation which in the near future seems to be experiencing a slight upward correction to test the Vaccum Block area level the range 10993.7-11028.6 which happens to be also within the Bearish Fair Value Gap level area if the levels in this area function as resistance quite well and as long as the upward correction does not exceed above the 11233.6 level then #NDX will continue its decline back to the 10616.1 level as the first target and level 10433.8 as the second target.

*The market analysis posted here is meant to increase your awareness, but not to give instructions to make a trade.

Analysis are provided by InstaForex.

Read More

Best regards, PR Manager / Learn more about InstaForex Company at http://instaforex.com

Re: InstaForex Analysis

Forex Analysis & Reviews: Elliott wave analysis of EUR/USD on December 30, 2022

https://forex-images.ifxdb.com/userfiles/20221230/analytics63ae724ab9cbd.jpg

EUR/USD has been locked in a sideways consolidation, but we continue to look for a slightly deeper correction towards 1.0470 to complete wave 4/ and set the stage for wave 5/ higher to 1.0927 as this will complete wave 3.

In the longer term, we are looking for much higher levels for EUR/USD, but we will have to take the ride higher in baby steps as always as most of the time, the pair hovers within sideways consolidations and corrective counter-trends and only 1/3 of the time, it actually moves higher.

*The market analysis posted here is meant to increase your awareness, but not to give instructions to make a trade.

Analysis are provided by InstaForex.

Read More

Best regards, PR Manager / Learn more about InstaForex Company at http://instaforex.com

Re: InstaForex Analysis

Forex Analysis & Reviews: EUR/USD analysis for January 02, 2023 - Rejection of the intraday support

https://forex-images.ifxdb.com/userfiles/20230102/analytics63b29bff80914.jpg

EUR/USD has been trading downside this morning but I found rejection of the key support zone, which is sign that there is chance for the upside movement.

Trading recommendation:

Due to the rejection of the rising trend-line and support zone at the price of 1.0665, I see potential for the upside movement towards upside references...

Watch for the potential buying opportunities on the intraday dips with the upside objectives at the price of 1.0710 and 1.0735

RSI oscillator is showing oversold condition, which is good sign for the further rally...

Key support is set at the price of 1.0665

*The market analysis posted here is meant to increase your awareness, but not to give instructions to make a trade.

Analysis are provided by InstaForex.

Read More

Best regards, PR Manager / Learn more about InstaForex Company at http://instaforex.com

Re: InstaForex Analysis

Forex Analysis & Reviews: Technical Analysis of Daily Price Movement of GBP/USD Main Currency Pair, Tuesday Januari 03 2023

https://forex-images.ifxdb.com/userfiles/20230103/analytics63b390e9d2340.jpg

On the daily chart, the main currency pair GBP/USD appears to be moving in the Bearish channel and below the Moving Average. Just testing the Bearish Breaker Block level at 1.2106, Cable has the potential to depreciate in the next few days to the 1.1992 level and if this level is successfully penetrated by GBP/USD The USD has the potential to fall down to the 1.0923 level as long as it is on its way to the targets. There will be no significant upward correction, especially if it is broken above the 1.2426 level because if this level is successfully broken above, it will make all the scenarios previously described cancel automatically.

*The market analysis posted here is meant to increase your awareness, but not to give instructions to make a trade.

Analysis are provided by InstaForex.

Read More

Best regards, PR Manager / Learn more about InstaForex Company at http://instaforex.com

Re: InstaForex Analysis

Forex Analysis & Reviews: Technical Analysis of Intraday Price Movements of Nasdaq 100 Index, Wednesday January 04 2023.

https://forex-images.ifxdb.com/userfiles/20230104/analytics63b4ce217524c.jpg

Nasdaq 100 Index on its 4 hour chart seems moving harmoniously inside Bearish Pitchfork Channel where this indicates that the Seller is still dominant in EUR/AUD but with the presence of deviations between price movements and the CCI indicator and the appearance of the Bullish 123 pattern followed by the appearance of the Ross Hook (RH) indicates that in the near future EUR/AUD will be corrected upwards where the Ross Hook (RH) level of 11096.4 will be the main target to be tested for this cross currency pair to be penetrated so that if this (RH) level is successfully broken above then the 11285.7 level will be the next target which will be tested by EUR/AUD but by because this upward correction causes an Ascending Broadening Wedge pattern to emerge, so please be careful. There will be a potential for EUR/AUD to continue the previous Bearish bias if suddenly EUR/AUD drops back down to past the 10668.8 level because if this level is successfully broken down, then the upward rally correction scenario described previously will become invalid and cancel by itself.

*The market analysis posted here is meant to increase your awareness, but not to give instructions to make a trade.

Analysis are provided by InstaForex.

Read More

Best regards, PR Manager / Learn more about InstaForex Company at http://instaforex.com

Re: InstaForex Analysis

Forex Analysis & Reviews: EUR/USD analysis for January 05, 2023 - Triangle pattern in creation and potential for the upside continuation

https://forex-images.ifxdb.com/userfiles/20230105/analytics63b6844e7b657.jpg

EUR/USD has been trading sideways at the price of 1.0608 and I see potential for the upside continuation towards upside reference.

Trading recommendation:
Due to the rejection of the key support zone in the background and symmetrical triangle pattern in creation, I see potential for the further growth.

Watch for the buying opportunities on the intraday dips with the upside objective at the price of 1.0675

Stochastic Oscillator is showing fresh bull cross, which is good sign for further rally

Key support zone is set at the price of 1.0520

*The market analysis posted here is meant to increase your awareness, but not to give instructions to make a trade.

Analysis are provided by InstaForex.

Read More

Best regards, PR Manager / Learn more about InstaForex Company at http://instaforex.com

Re: InstaForex Analysis

Forex Analysis & Reviews: ETHUSD Potential For Bearish Drop | 6th January 2023

https://forex-images.ifxdb.com/userfiles/20230106/analytics63b7a5cecbebd.jpg

Looking at the H4 chart, my overall bias for ETHUSD is bullish due to the current price crossing above the Ichimoku cloud, indicating a bullish market. If this bullish momentum continues, expect the price to head towards the 1st resistance at 1308.21, where the 38.2% Fibonacci line is. In an alternative scenario, price could head back down towards the 1st support at 1231.62, where the 50% Fibonacci line is.

Trading Recommendation
Entry: 1308.21
Reason for Entry: Retest 1st resistance line
Take Profit:1231.62
Reason for Take Profit: 1st support line
Stop Loss: 1351.87
Reason for Stop Loss:
Recent swing high

*The market analysis posted here is meant to increase your awareness, but not to give instructions to make a trade.

Analysis are provided by InstaForex.

Read More

Best regards, PR Manager / Learn more about InstaForex Company at http://instaforex.com

Re: InstaForex Analysis

Forex Analysis & Reviews: ECB hopes for strong wage growth as support for rate hikes

https://forex-images.ifxdb.com/userfiles/20230109/analytics63bc15ef29963.jpg

The European Central Bank forecasts wage growth to be very strong in the coming quarters, strengthening the case for further rate hikes. In an Economic Bulletin article published on Monday, the bank said wage growth has been "relatively moderate" since the start of the pandemic, but is now close to its long-term trend. And, over the next few quarters, it is expected to be very strong compared to historical patterns. "This reflects resilient labor markets, which so far have not been significantly affected by the economic slowdown, an increase in the national minimum wage and some lag between wages and the high rate of inflation," the article explained.

https://forex-images.ifxdb.com/userfiles/20230109/analytics63bc163ce9b84.jpg

Over the last 1.5 years, price growth has exceeded the ECB's target of 2%. There is a chance that it will exceed 10% at the end of 2022 as the core inflation indicator, which excludes volatile goods such as food and energy, reached a record high in December. With forecasts showing that 2% inflation will not be achievable before the end of 2025 and unions pushing for generous compensation packages, the ECB conducted an unprecedented series of rate hikes, pushing the deposit rate up to 2% last month. Against this backdrop, EUR/USD continued to rally, approaching the top of May-June last year.

https://forex-images.ifxdb.com/userfiles/20230110/analytics63bcc8a01cc22.jpg

To avoid a wage and price spiral, ECB chief Christine Lagarde flagged another half-point hike at the February meeting. After all, weaker economic growth is unlikely to help in the near term, especially as a shortage of skilled labor encourages businesses to retain workers and pay them well. ECB chief economist Philip Lane noted that it will take several years for wages to fully adjust to the recent shocks, but "there are signs of stronger wage growth in the service sector", primarily in those where there is a shortage of staff. However, the expected slowdown in economic growth in the euro area and uncertainty about the economic outlook are likely to put downward pressure in the near term.

*The market analysis posted here is meant to increase your awareness, but not to give instructions to make a trade.

Analysis are provided by InstaForex.

Read More

Best regards, PR Manager / Learn more about InstaForex Company at http://instaforex.com

Re: InstaForex Analysis

Forex Analysis & Reviews: Technical Analysis of Daily Price Movement of USD/JPY Main Currency Pairs, Wednesday January 11 2023.

https://forex-images.ifxdb.com/userfiles/20230111/analytics63be1990e4e1a.jpg

If we look at 4 hour chart USD/JPY main currency pairs looks like the following facts:

1. There is a deviation between price movements with Awesome Oscillator Indicator.

2. The form of Bullish 123 pattern.

3. The appearance of Wiseman. 1 (Bullish Divergent Bar).

4. The appearance of Wiseman. 2 (SAO).

Based on the four facts above, in the coming days the main currency pair USD/JPY has the potential to appreciate, rally upwards to test the 134.77 level. If it is successfully penetrated, USD/JPY will continue its rally up to the 136.19 level and if momentum and volatility are supportive then USD/JPY will continue its rally up to the level of the 138.03-140.03 area but if on its way to the targets of this area suddenly USD/JPY reverses back to its initial bias (Bearish) to break below the 129.51 level then all the scenarios previously described will become invalid and cancel by itself.

*The market analysis posted here is meant to increase your awareness, but not to give instructions to make a trade.

Analysis are provided by InstaForex.

Read More

Best regards, PR Manager / Learn more about InstaForex Company at http://instaforex.com

Re: InstaForex Analysis

Forex Analysis & Reviews: Technical Analysis of Intraday Movement of USD/MXN Currency Pairs, Thursday January 12, 2023.

https://forex-images.ifxdb.com/userfiles/20230112/analytics63bf8ae50eb13.jpg

The USD/MXN currency pair on the 4-hour chart appears to be trying to correct a rally upwards after successfully breaking below the 19,036 level where this is confirmed by the appearance of deviations between price movements and the Awesome Oscillator indicator. The level to be tested in the near future is the area 18,980-19,039 but if before successfully heading to that area level suddenly USD/MXN moves down again to break below the 18,911 level then it is very likely that the scenario described earlier will become invalid and cancel itself.

*The market analysis posted here is meant to increase your awareness, but not to give instructions to make a trade.

Analysis are provided by InstaForex.

Read More

Best regards, PR Manager / Learn more about InstaForex Company at http://instaforex.com

Re: InstaForex Analysis

Forex Analysis & Reviews: Analysis of Gold for January 13,.2023 - Breakout of the trading range

https://forex-images.ifxdb.com/userfiles/20230113/analytics63c1179b14493.jpg

Gold has been trading upside as I expected and the price has reached the first upside objective at the price of $1.900. Anyway, I see potential for further upside movement due to the strong upside momentum.

Trading recommendation:

Due to the strong upside pressure and the breakout of the resistance zone at $1.900, I see potential for the further upside movement towards next upside reference.

Watch for the potential buying opportunities on the intraday dips with the upside objective at the price of $1.950.

MACD oscillator is showing fresh upside momentum, which is strong sign that buyers are in control. Key support is set at the price of $1.900

*The market analysis posted here is meant to increase your awareness, but not to give instructions to make a trade.

Analysis are provided by InstaForex.

Read More

Best regards, PR Manager / Learn more about InstaForex Company at http://instaforex.com

Re: InstaForex Analysis

Forex Analysis & Reviews: Forecast for USD/JPY on January 16, 2023

The declining trend of the USD/JPY pair and the rising trend of the Marlin oscillator dragged on in a counter move. Taking into consideration the fact that the oscillator is leading, as well as historical data, showing a price reversal following the established trend of the oscillator, I expect the pair to rise, at least a significant correction, from the entire decline since October 21, 2022.

https://forex-images.ifxdb.com/userfiles/20230116/analytics63c4b54a7dea5.jpg

If there are no surprises, the reversal will occur from the nearest support at 127.10, which we can see on the daily chart. The first growth target will be the nearest enclosed line of the price channel around 129.80. Crossing it opens the way to the next line (133.70), which is close to the MACD indicator line. The MACD line acts as an independent level of support and resistance, if it coincides with any other graphic line, reinforcing it.

On the four-hour chart, there is a reversal of the Marlin oscillator. There are no other signs of reversal. But while these signs are forming, the price can still manage to reach the support 127.10.

https://forex-images.ifxdb.com/userfiles/20230116/analytics63c4b53556b9e.jpg

*The market analysis posted here is meant to increase your awareness, but not to give instructions to make a trade.

Analysis are provided by InstaForex.

Read More

Best regards, PR Manager / Learn more about InstaForex Company at http://instaforex.com

Posts: 1,226 to 1,250 of 1,547

Pages Previous 1 48 49 50 51 52 62 Next

You must login or register to post a reply

Forex Software → Market Analysis → InstaForex Analysis

Similar topics in this forum