Re: Forex Technical Analysis & Forecast by RoboForex
Technical Analysis & Forecast 19.04.2023
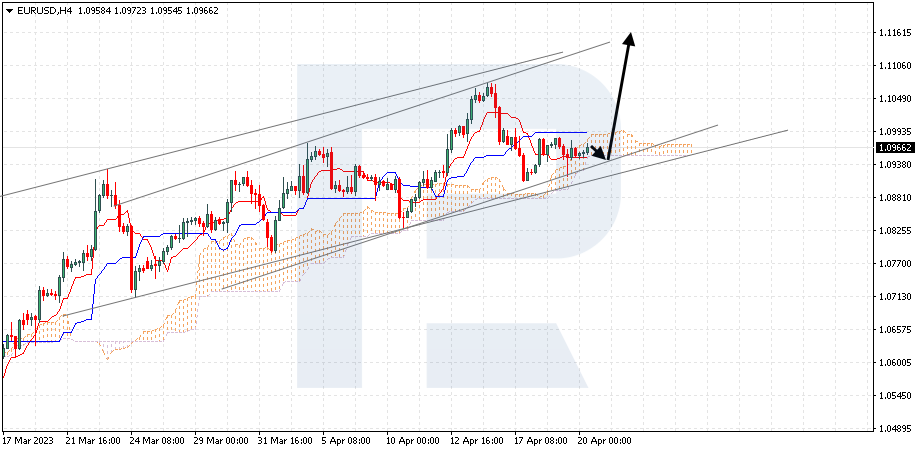
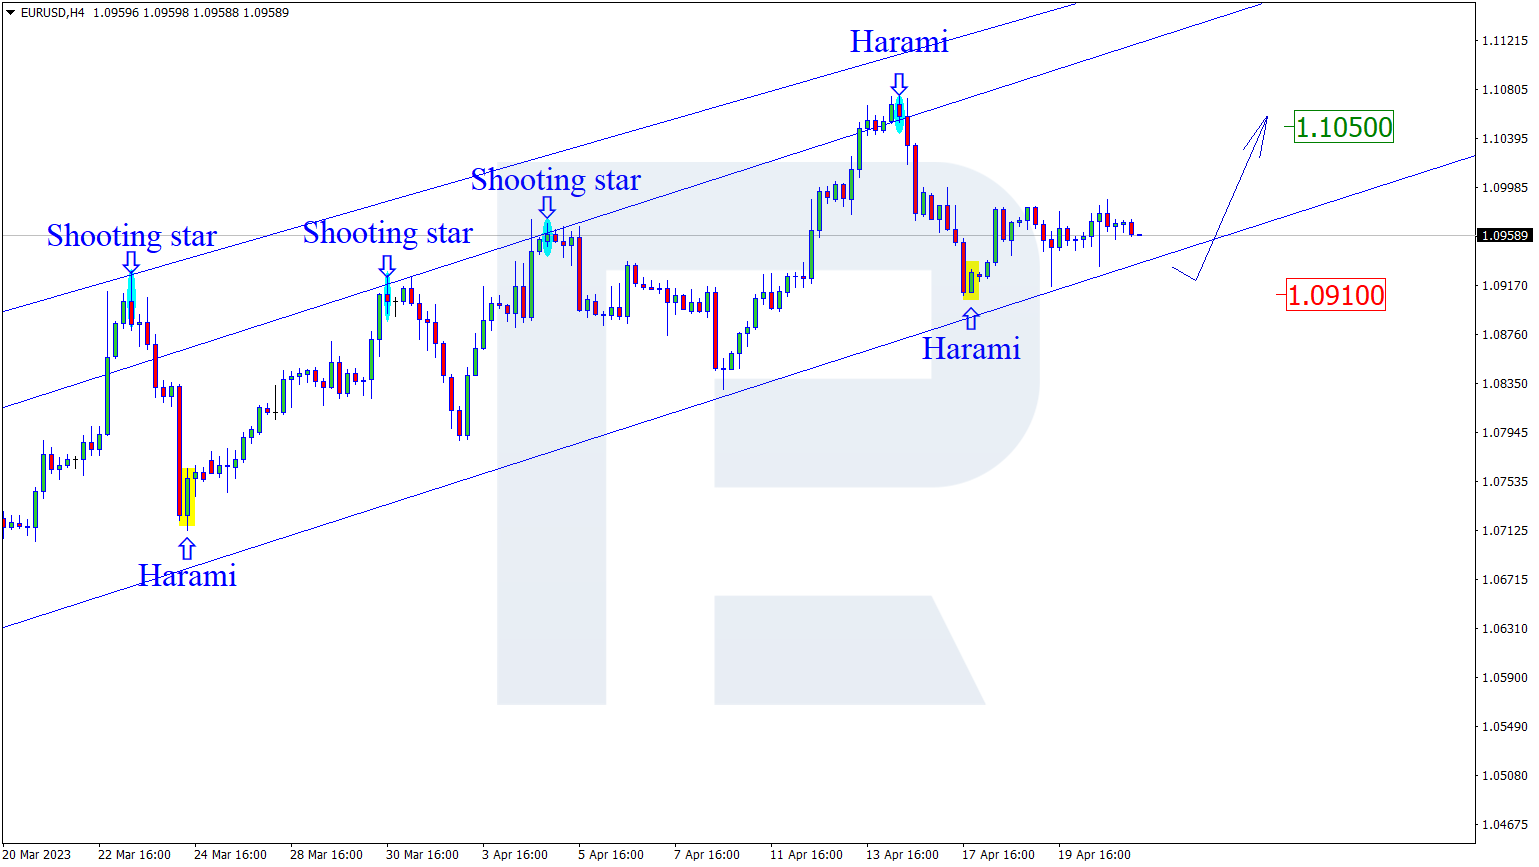
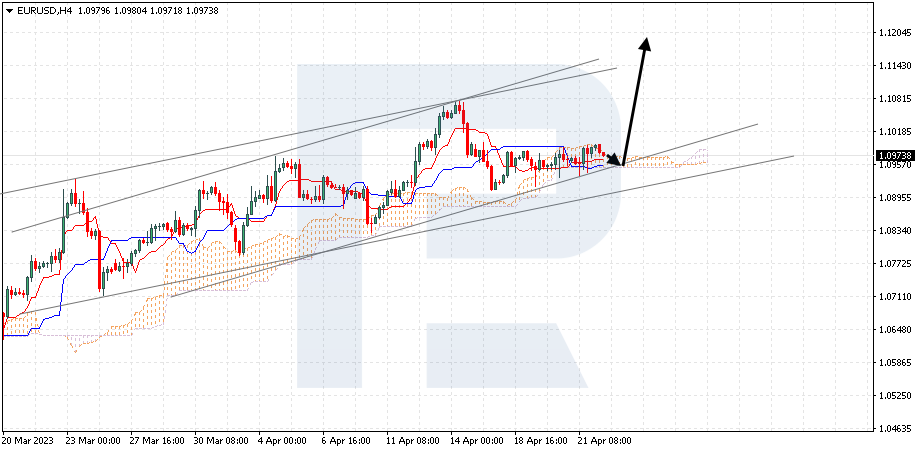
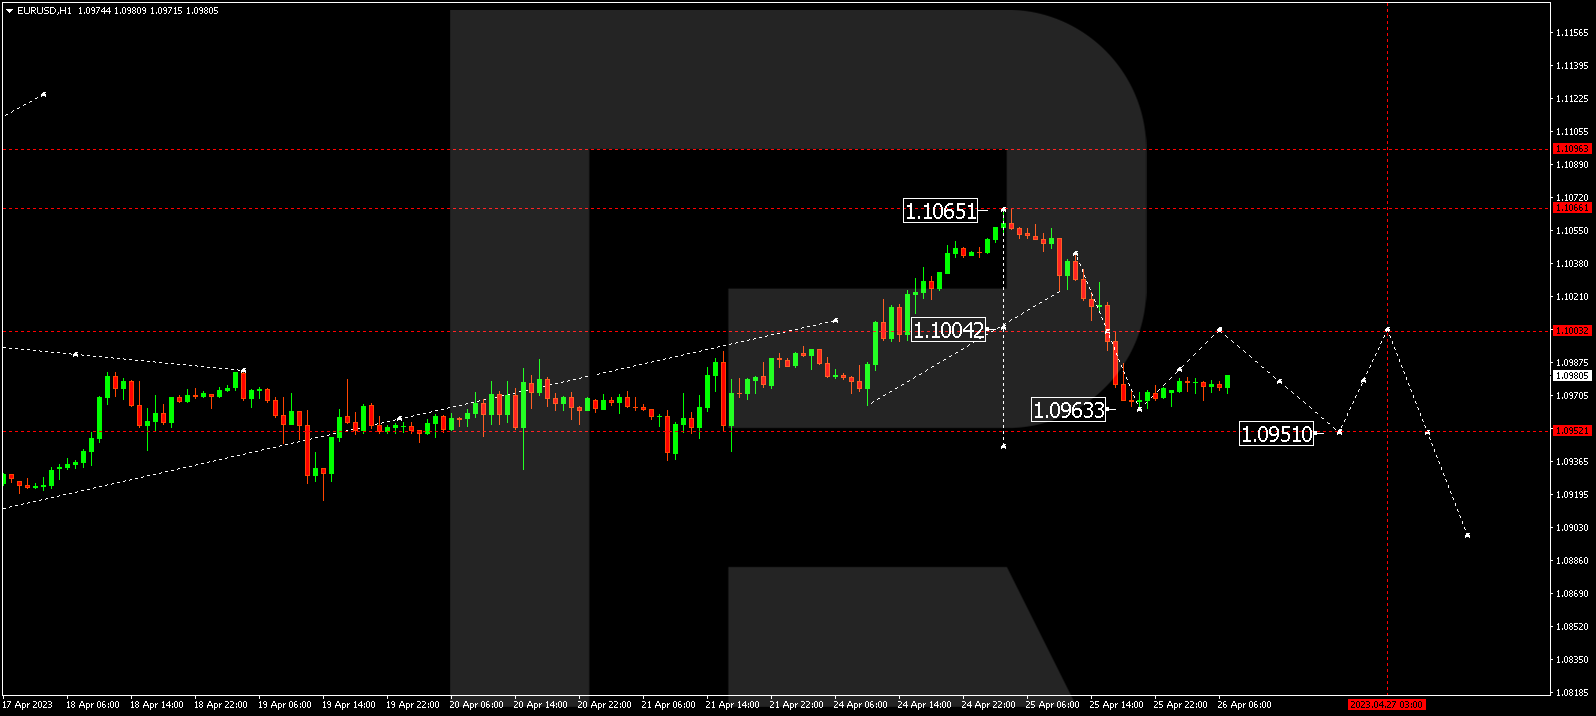
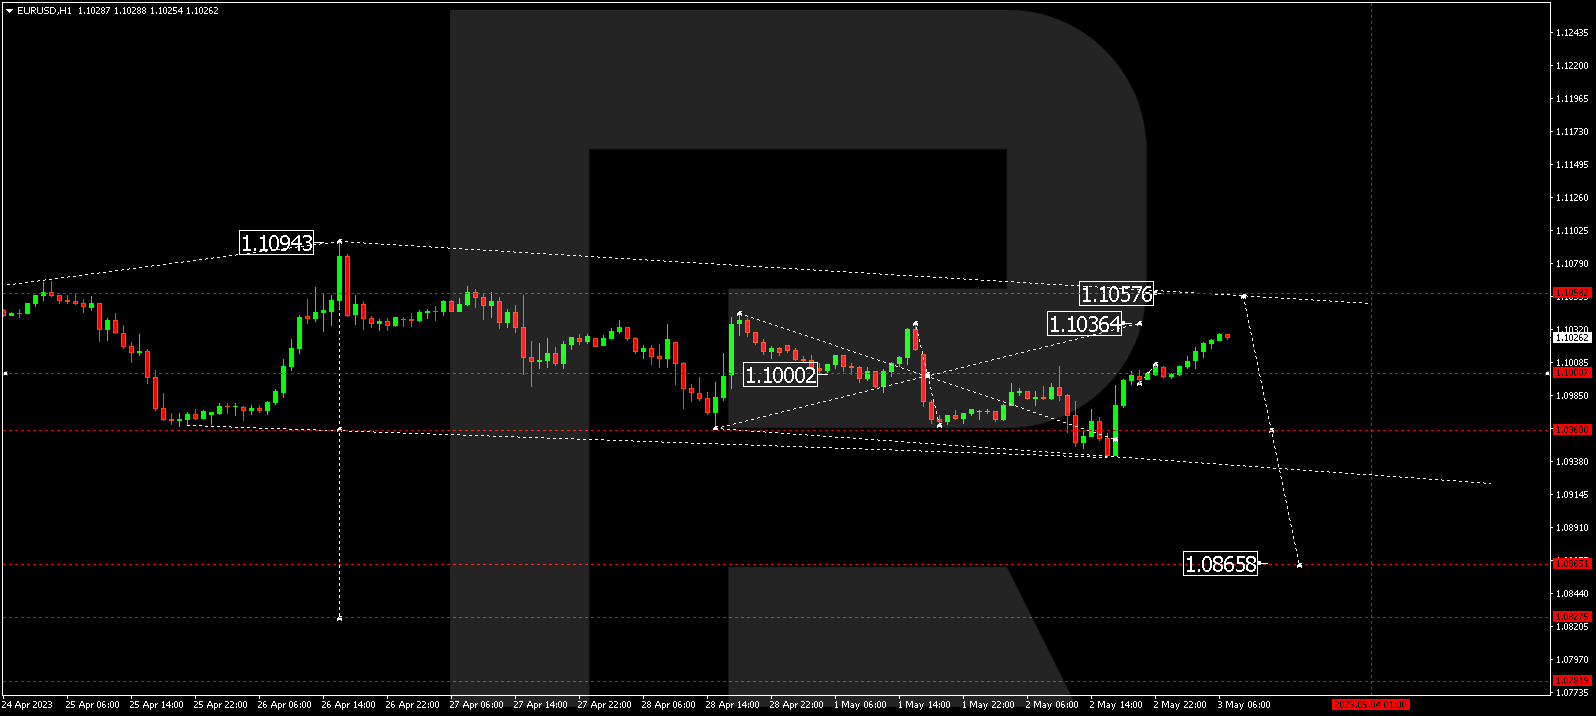
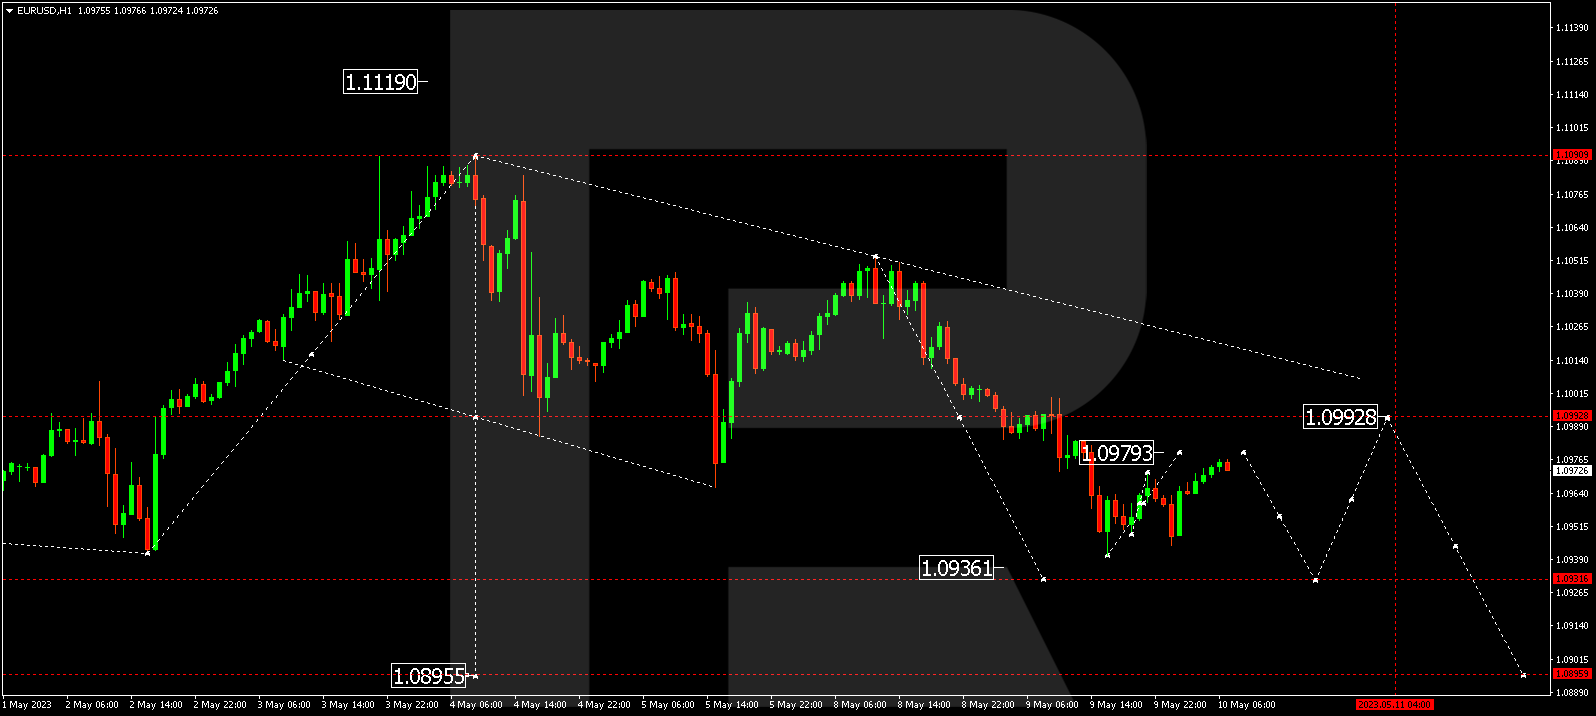
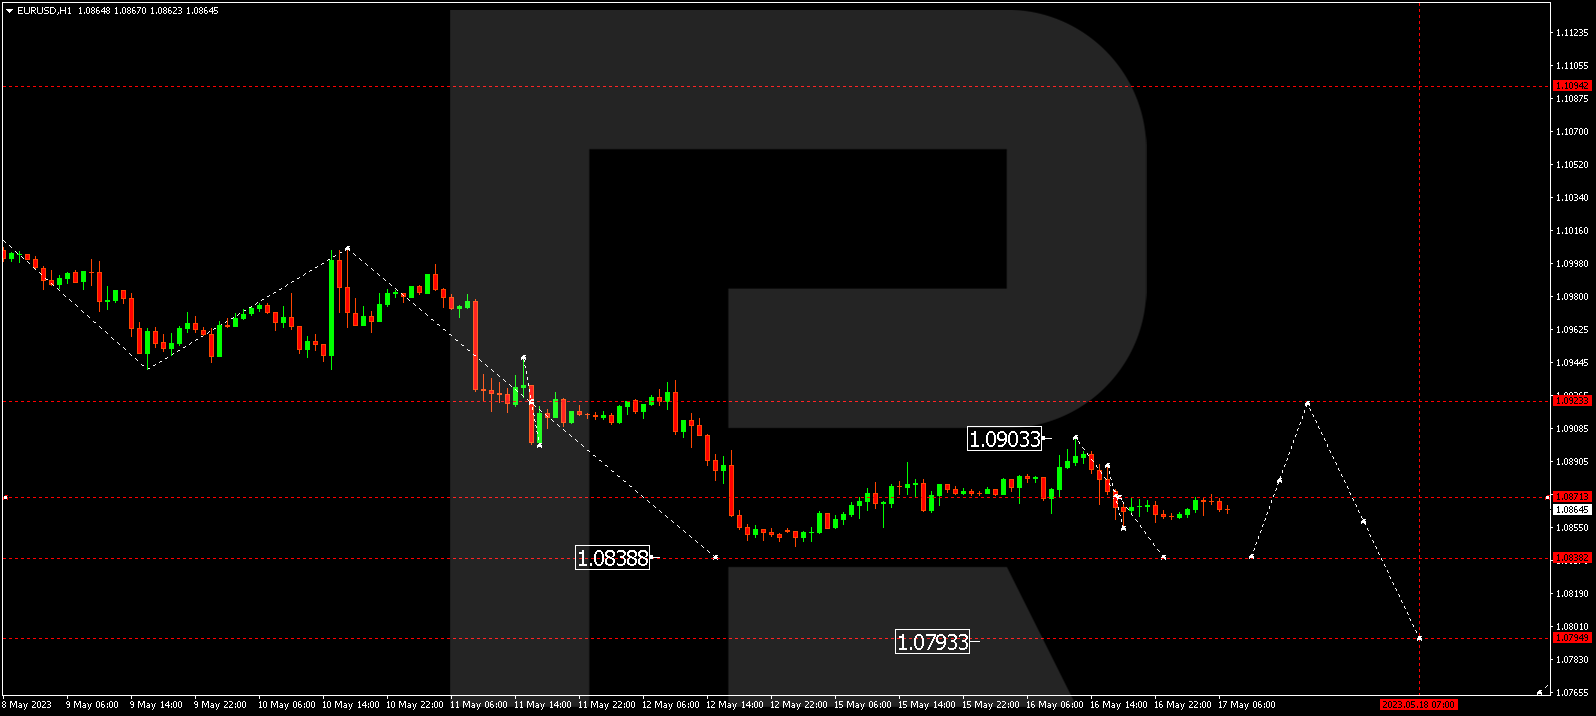
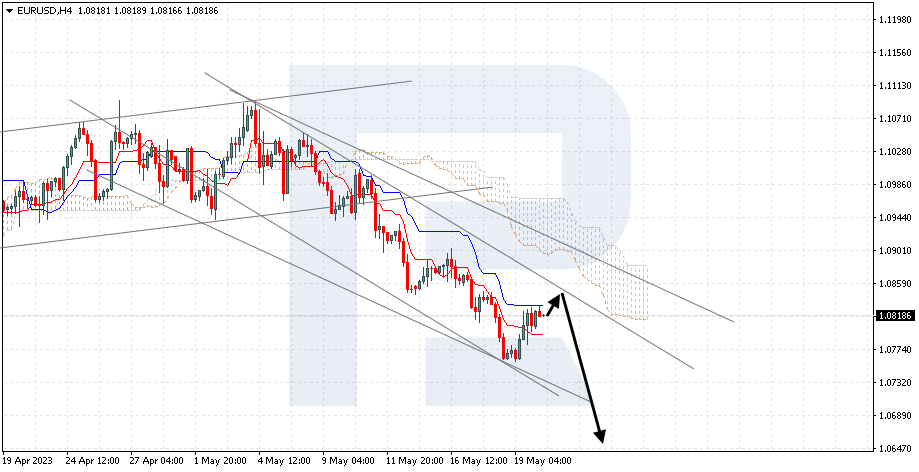
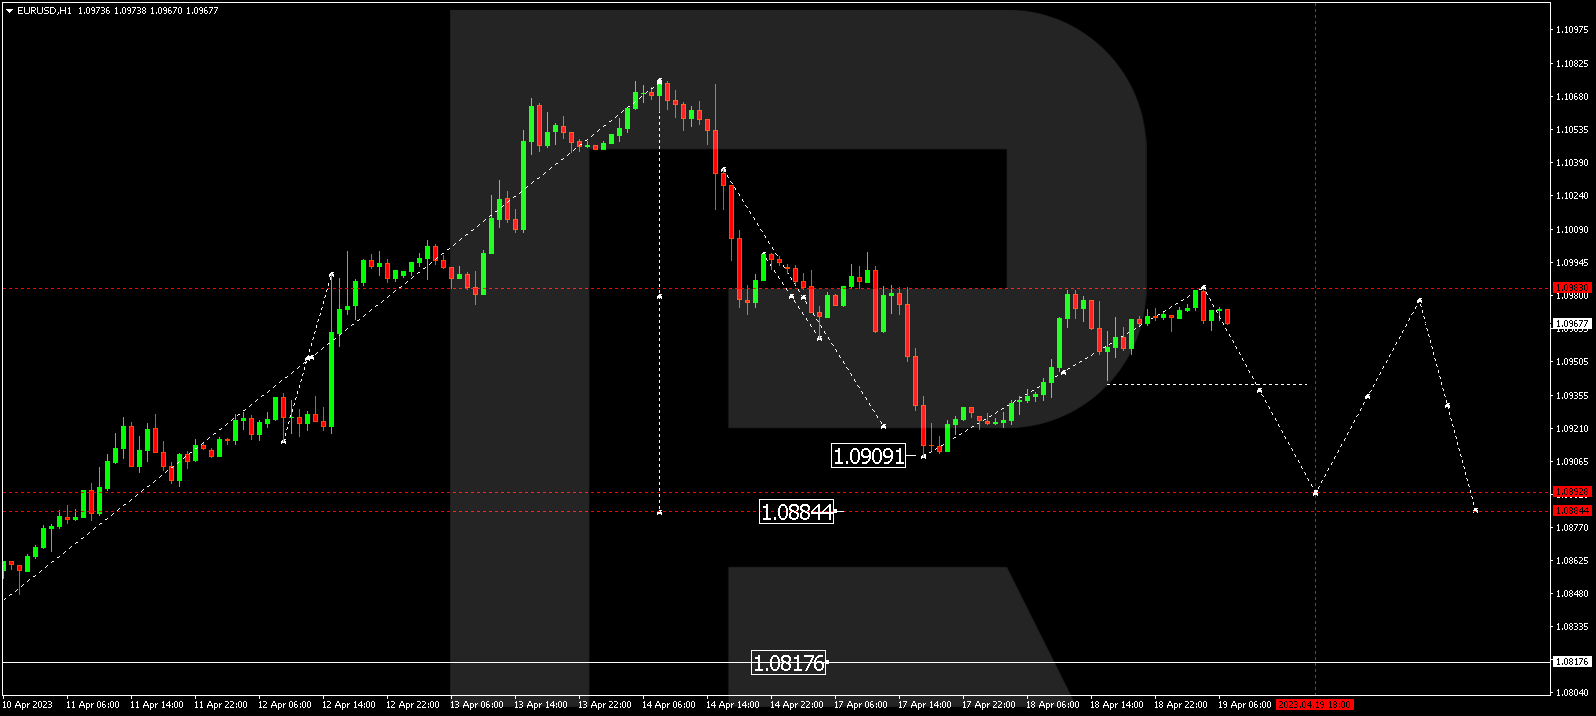
EURUSD, “Euro vs US Dollar”
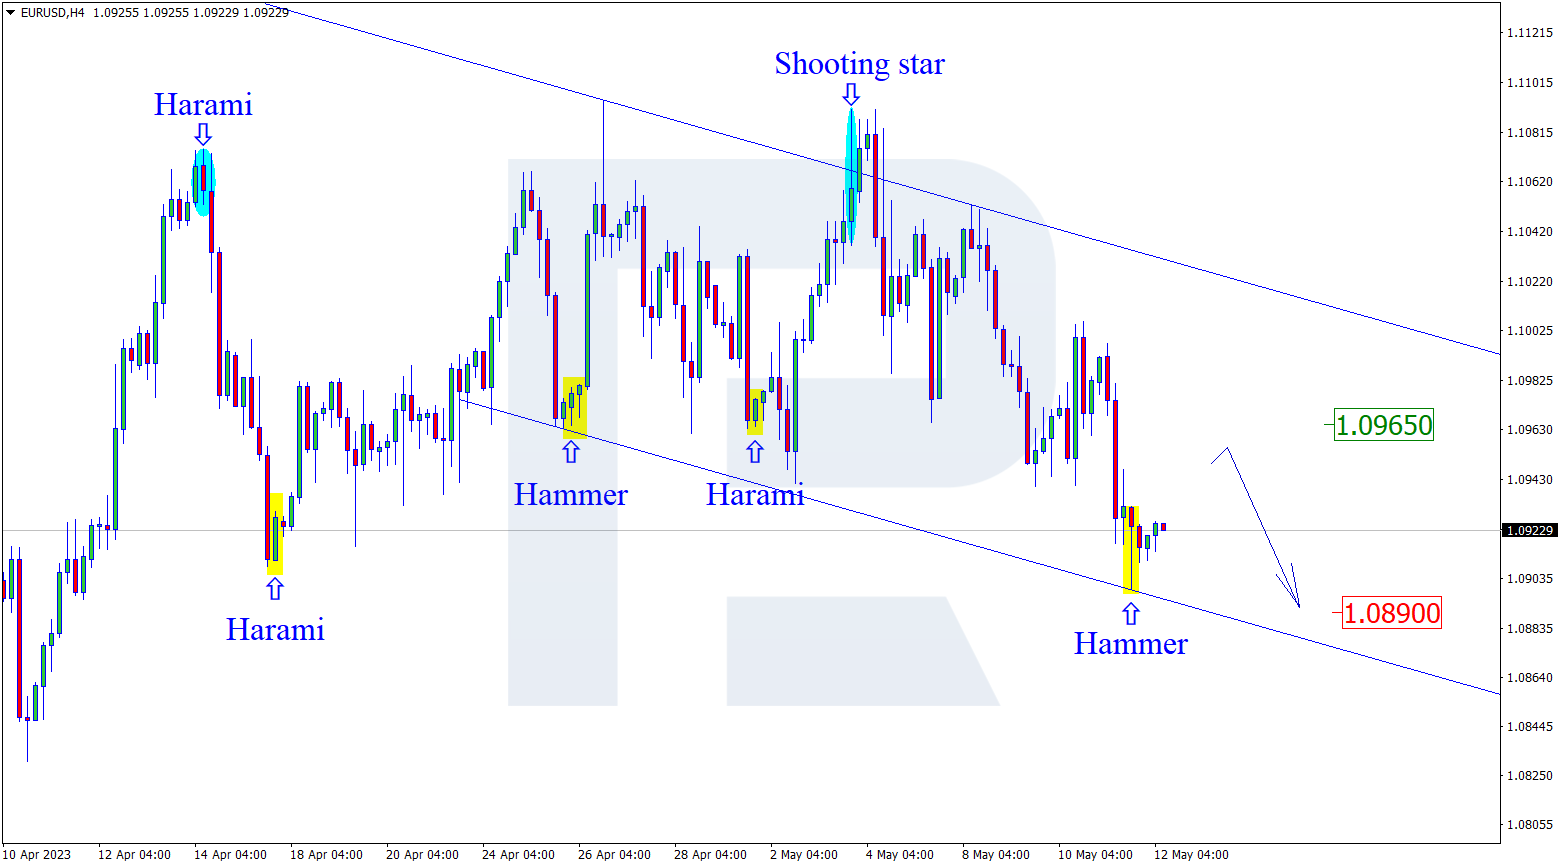
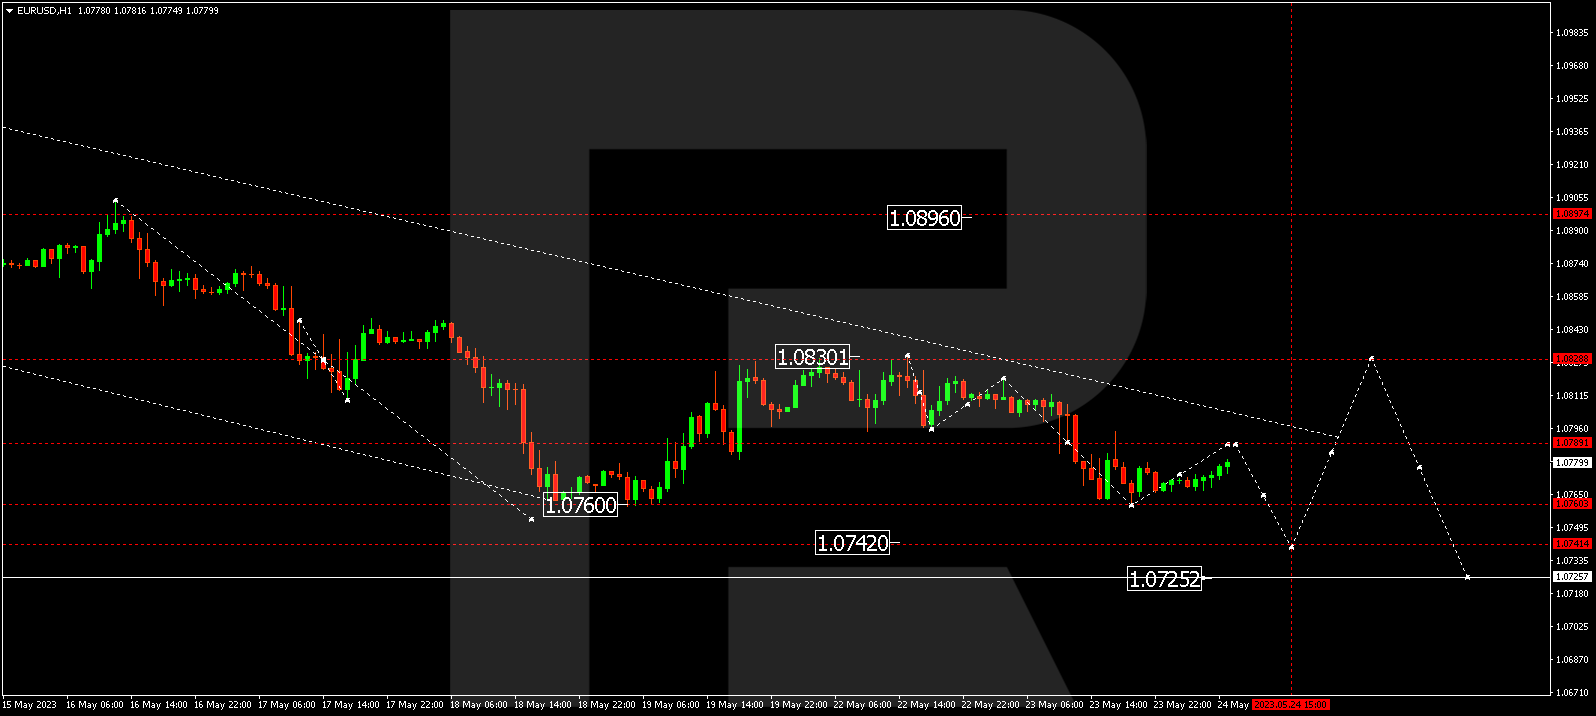
The currency pair has completed a structure of correction to 1.0983. Today the market is forming a link of a new wave of decline to 1.0893. After the price reaches, this level, a link of growth to 1.0930 could form.
Read more - Technical Analysis & Forecast 19.04.2023