Re: Forex Technical Analysis & Forecast by RoboForex
Murrey Math Lines 02.02.2023 (USDCHF, XAUUSD)
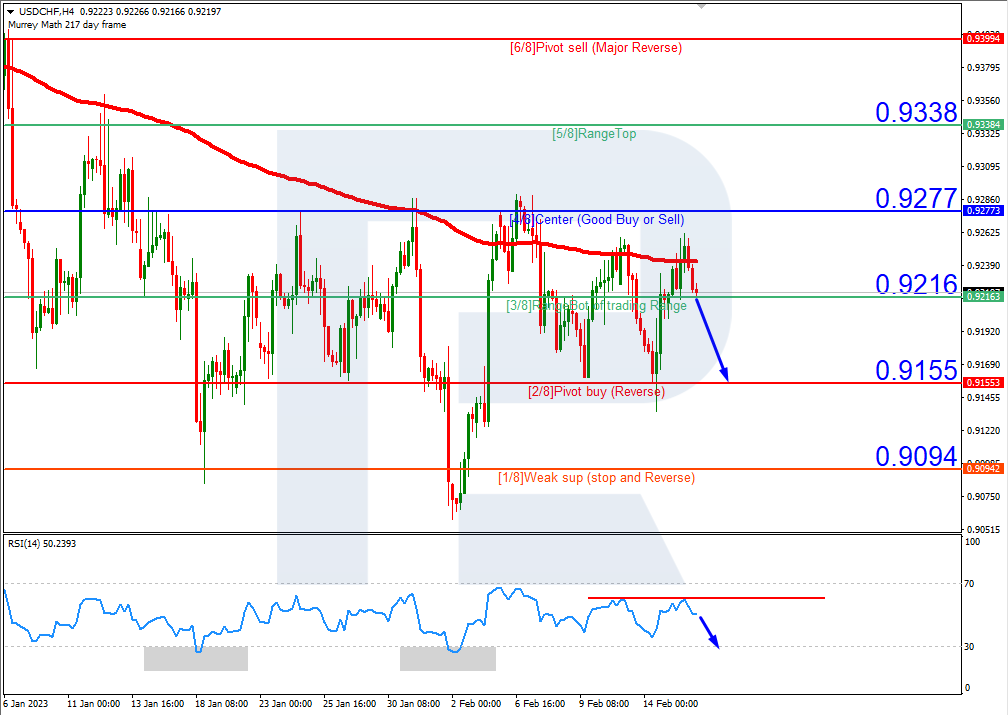
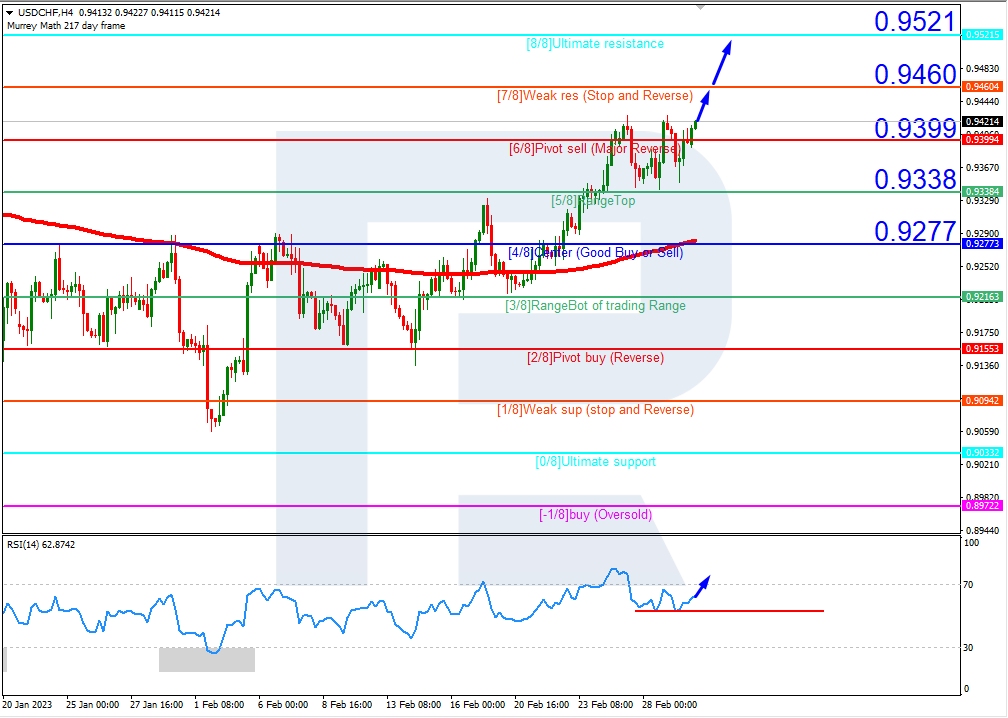
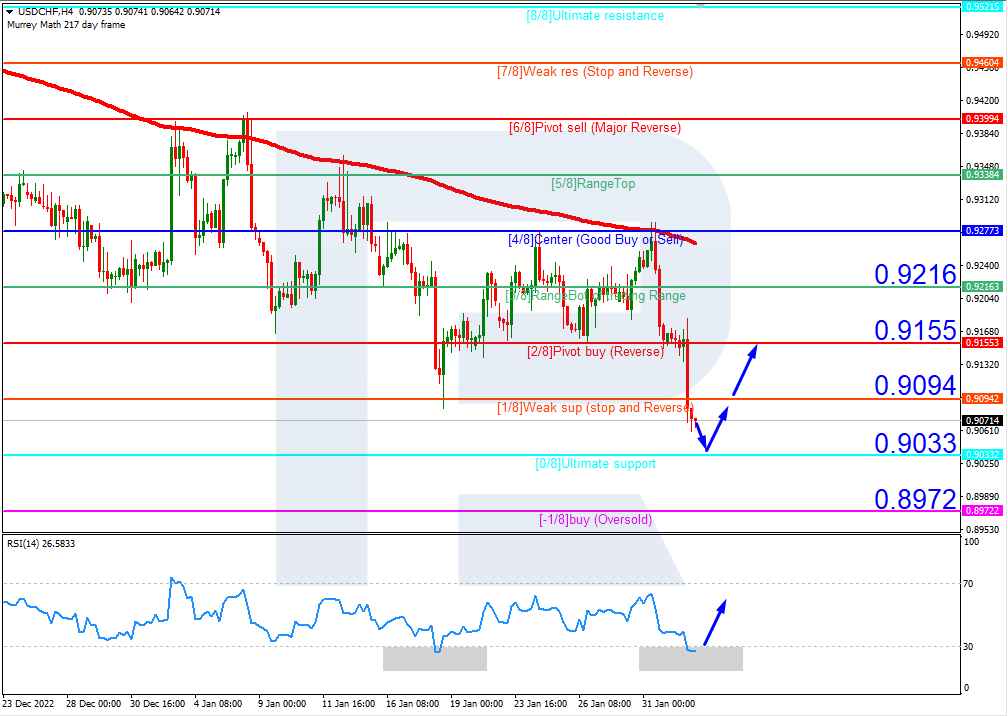
USDCHF, “US Dollar vs Swiss Franc”
On H4, the quotes are nearing the oversold area, while the RSI has already got to its own. As a result, a test of 0/8 (0.9033) is expected, followed by a bounce off it and growth to the resistance level of 2/8 (0.9155). The scenario can be cancelled by a downward breakaway of the support level of 0/8 (0.9033). In this case, the pair may keep falling, and the quotes might drop to -1/8 (0.8972).
Read more - Murrey Math Lines USDCHF, XAUUSD