Re: Forex Technical Analysis & Forecast by RoboForex
Japanese Candlesticks Analysis 05.07.2023 (EURUSD, USDJPY, EURGBP)
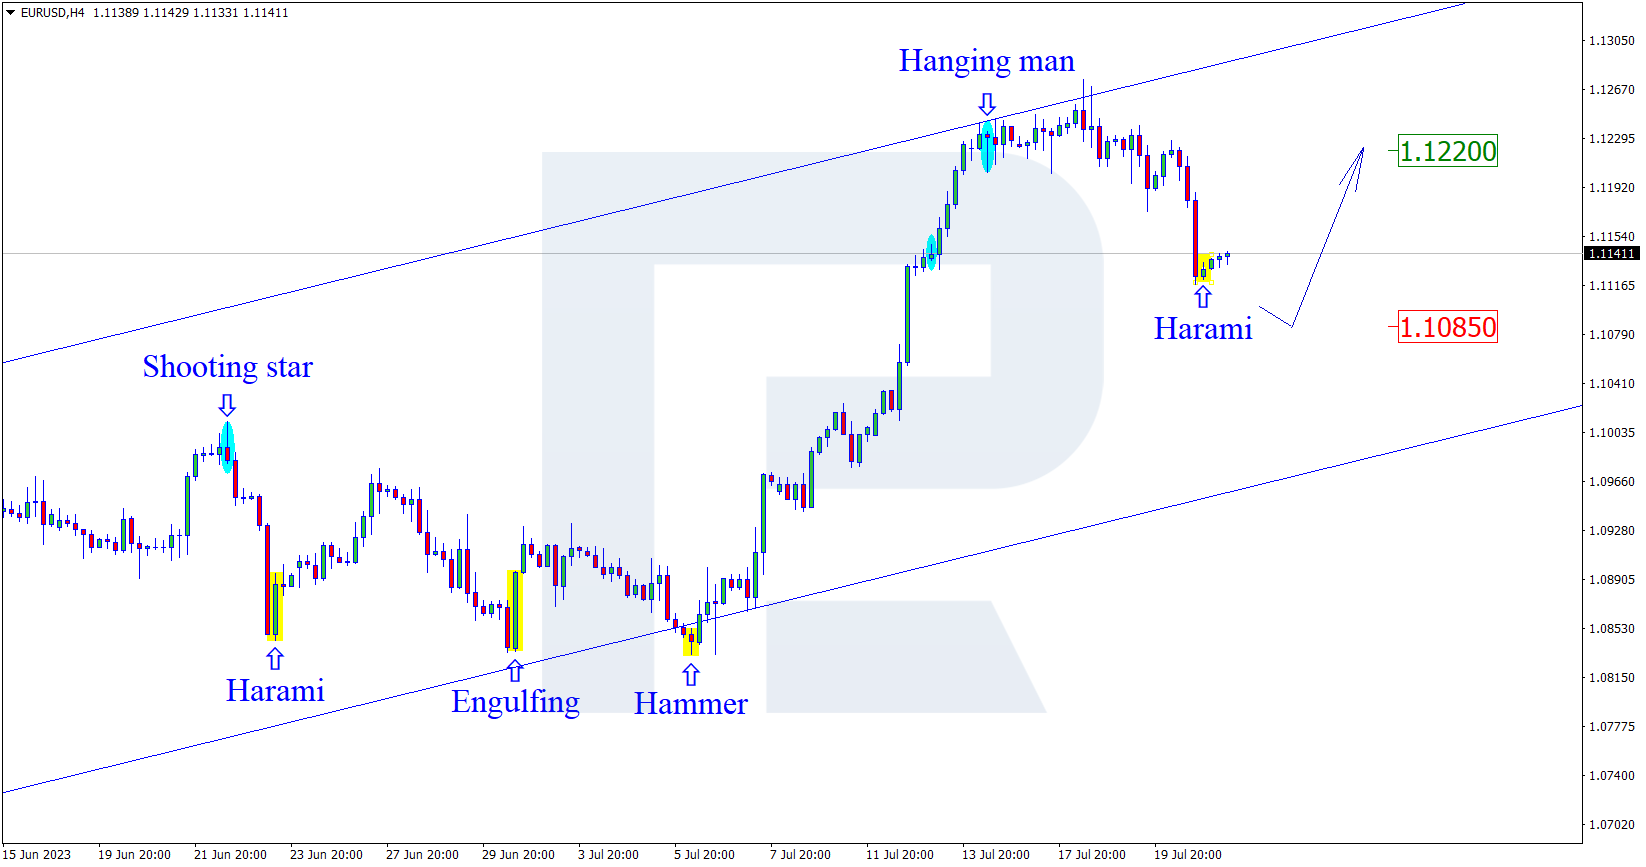
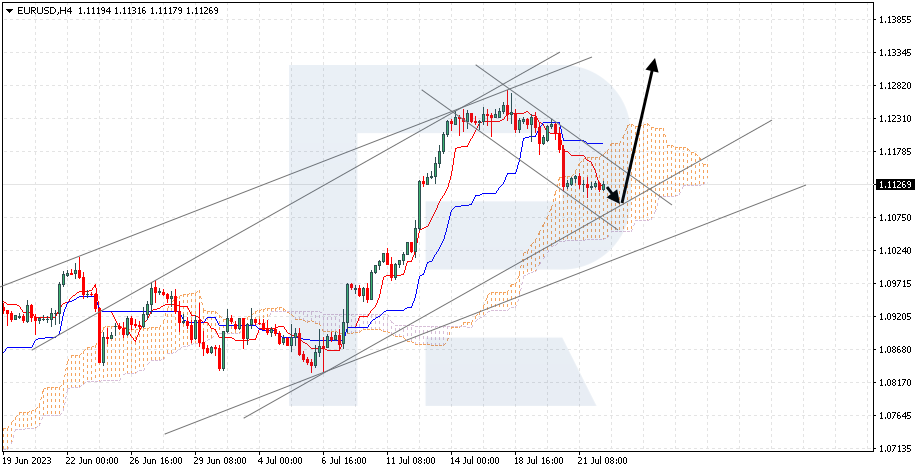
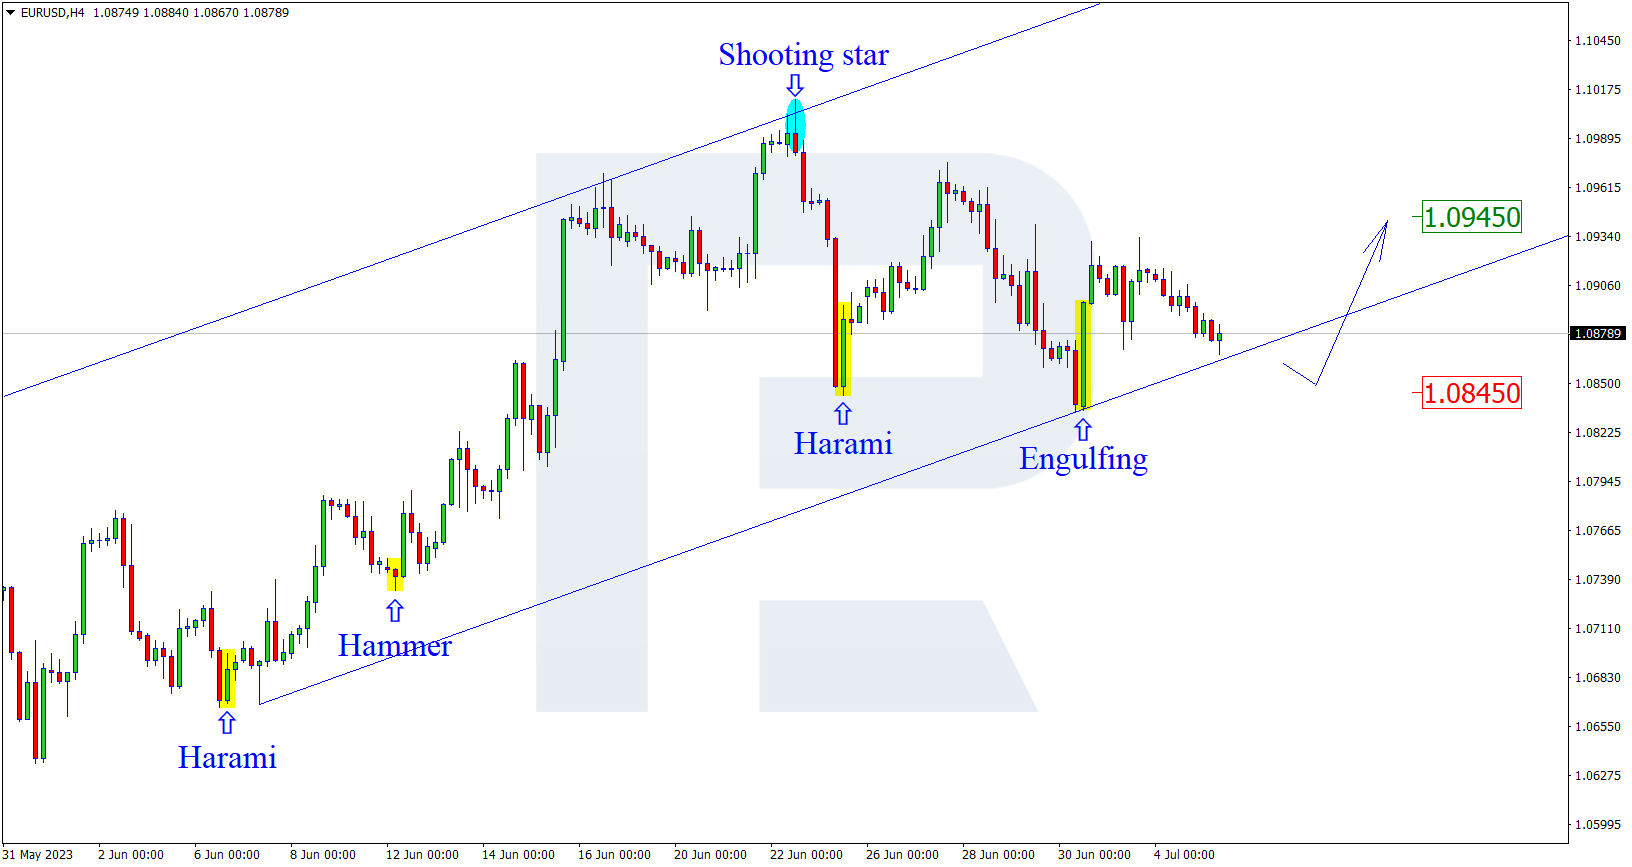
EURUSD, “Euro vs US Dollar”
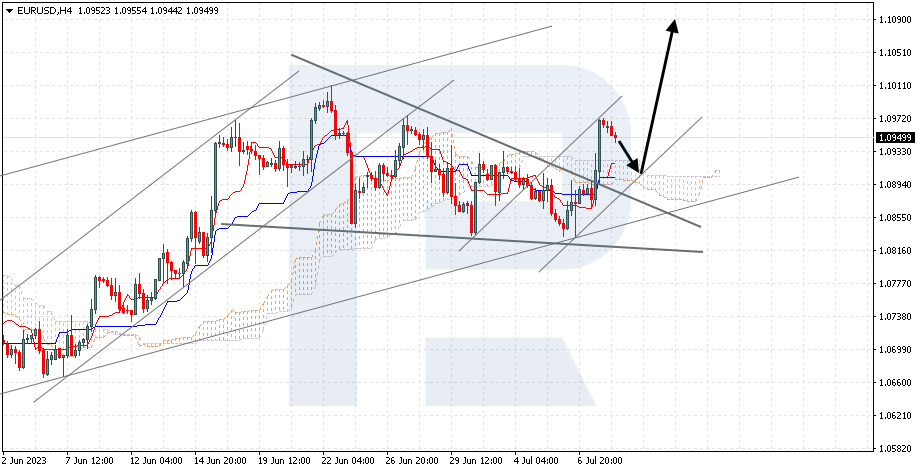
EURUSD has formed an Engulfing reversal pattern by the support level on H4. Currently, the instrument is going by the reversal signal in an ascending wave. The growth target could be 1.0945. However, the price might correct to 1.0845 and continue the uptrend after the test of the support.
Read more - Japanese Candlesticks Analysis EURUSD, USDJPY, EURGBP