Re: Forex Technical Analysis & Forecast by RoboForex
Murrey Math Lines 14.03.2023 (AUDUSD, NZDUSD)
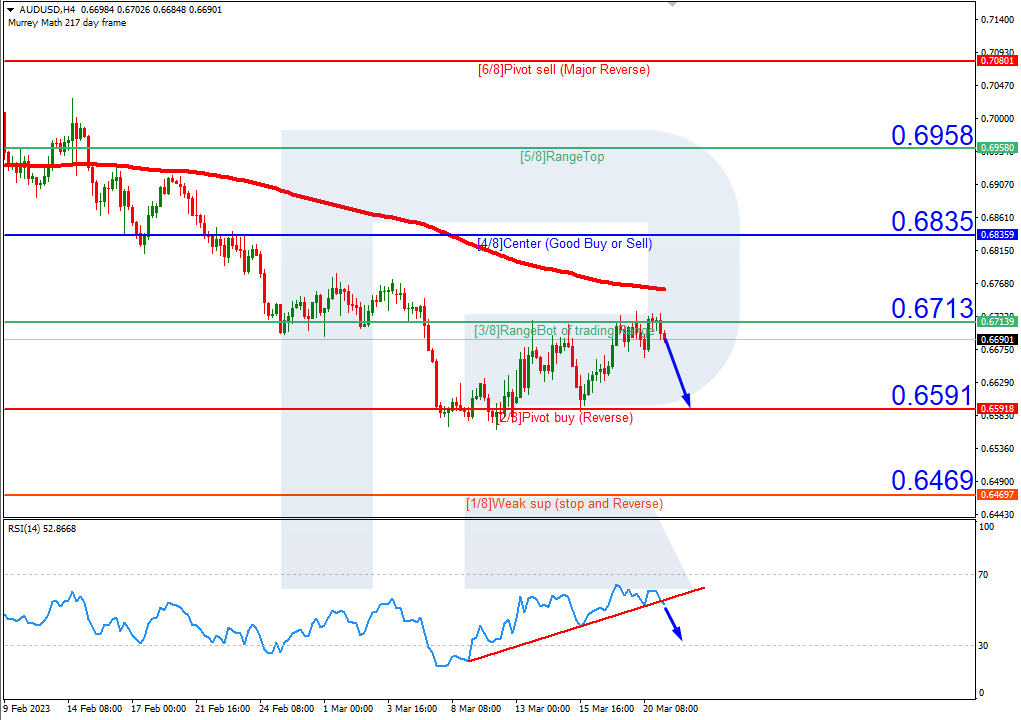
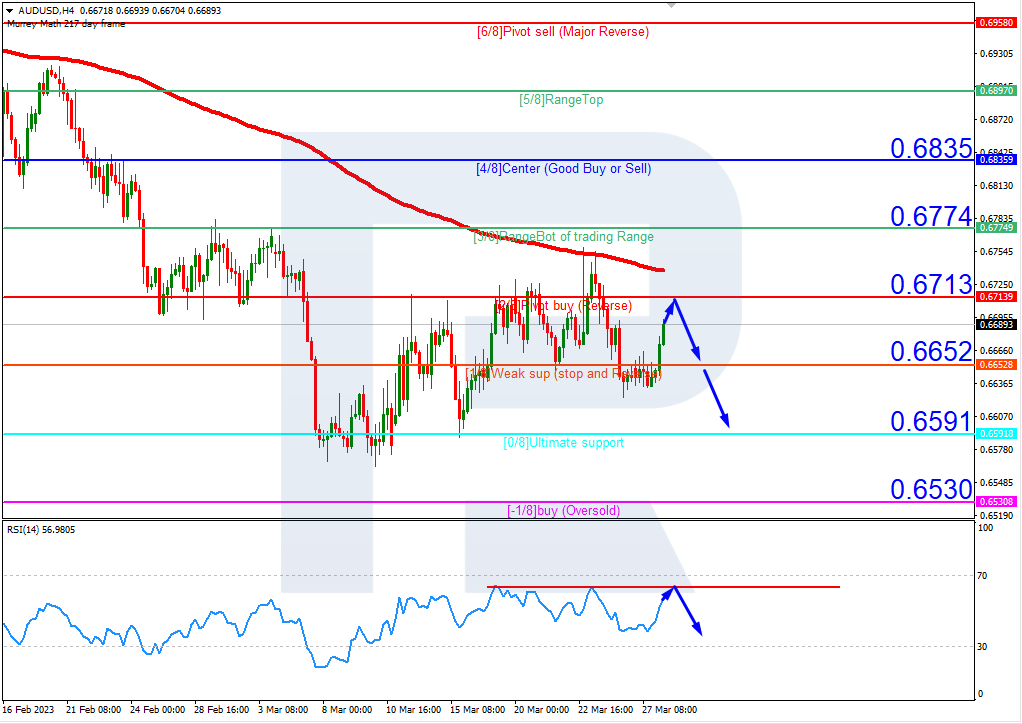
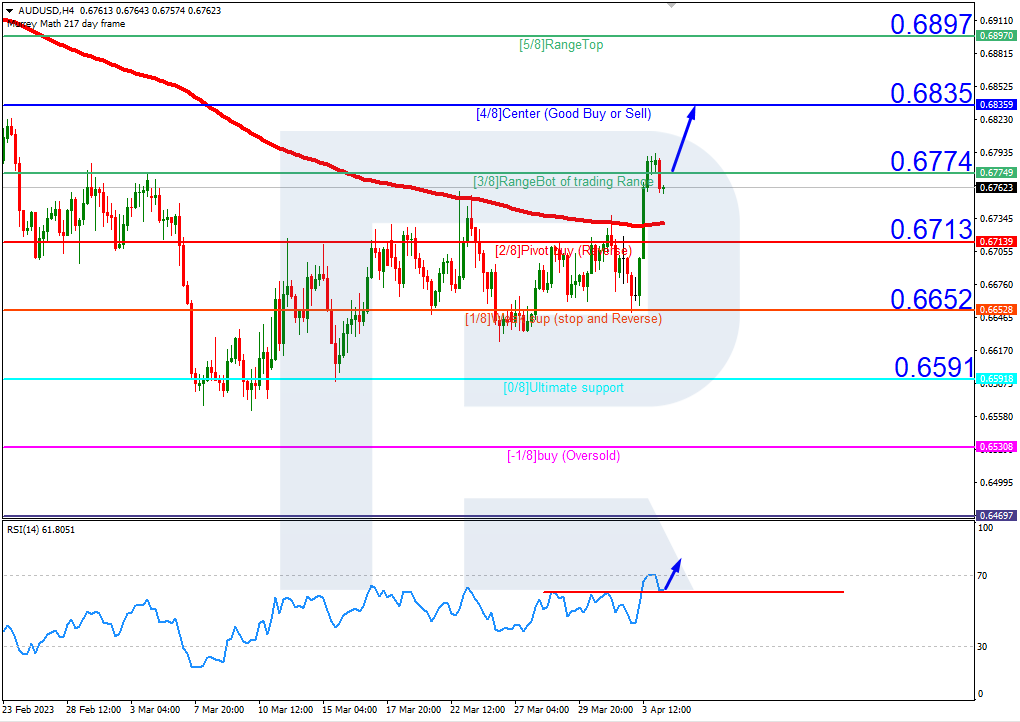
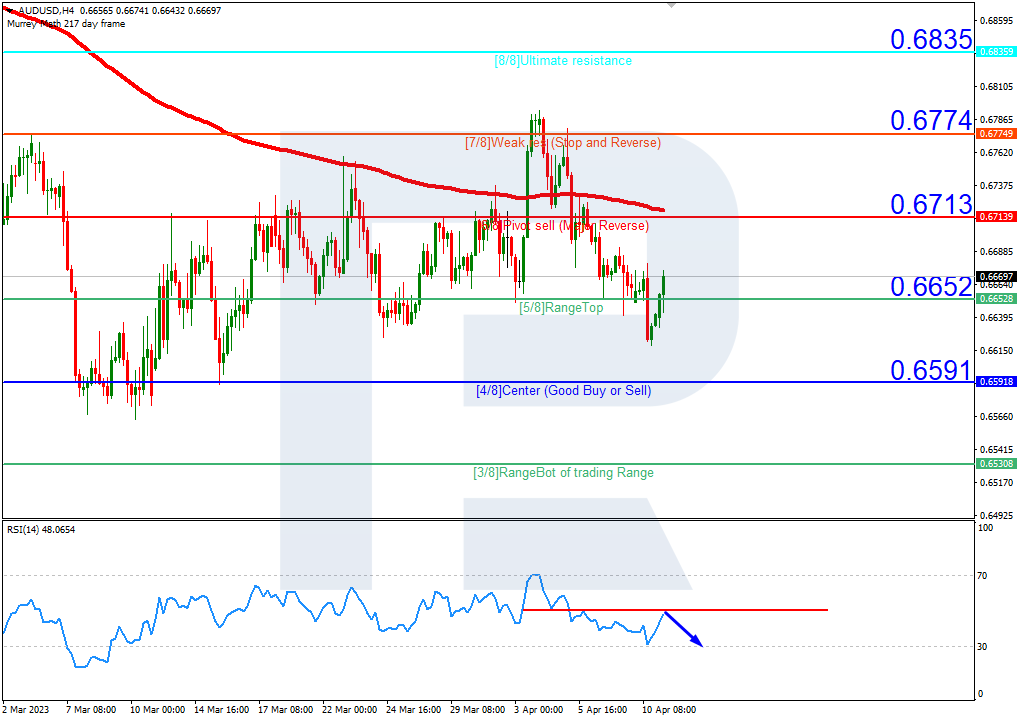
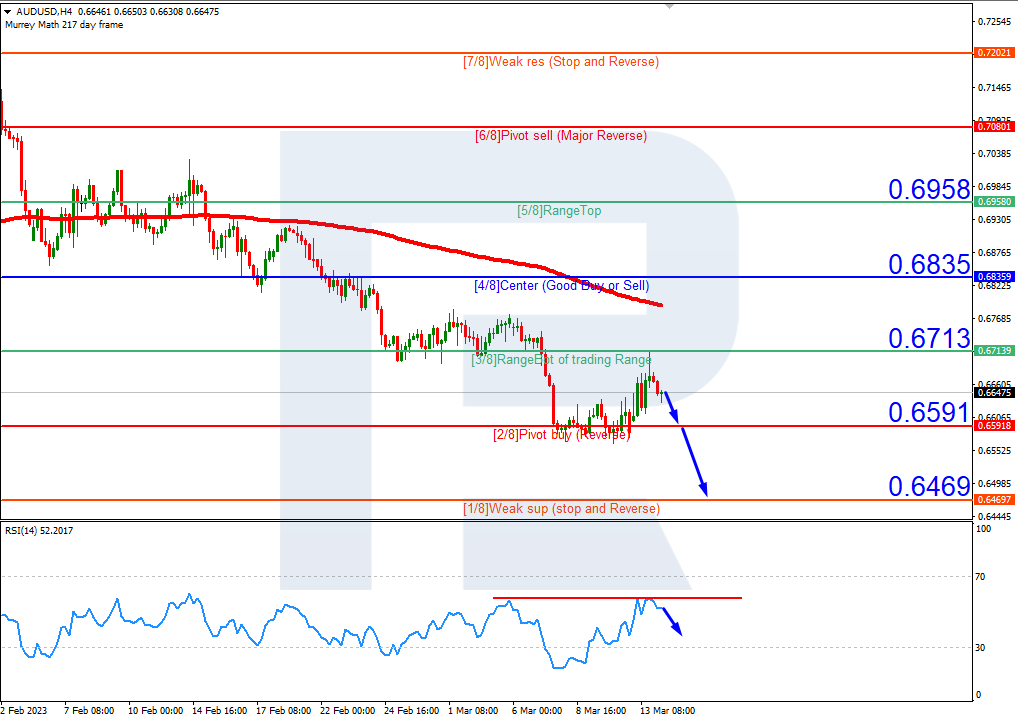
AUDUSD, “Australian Dollar vs US Dollar”
On H4, the AUDUSD is below the 200-day Moving Average, indicating a prevailing downtrend. The RSI is testing the resistance line. In this situation, a break down of the 2/8 level (0.6591) is expected, followed by a fall in price to the 1/8 support (0.6469). The overcoming of the resistance 3/8 (0.6713) will be a cancellation of this scenario. In this case, the price could rise to the 4/8 level (0.6835).
Read more - Murrey Math Lines AUDUSD, NZDUSD