Forex Analysis & Reviews: EUR/USD: bullish counterattack failed
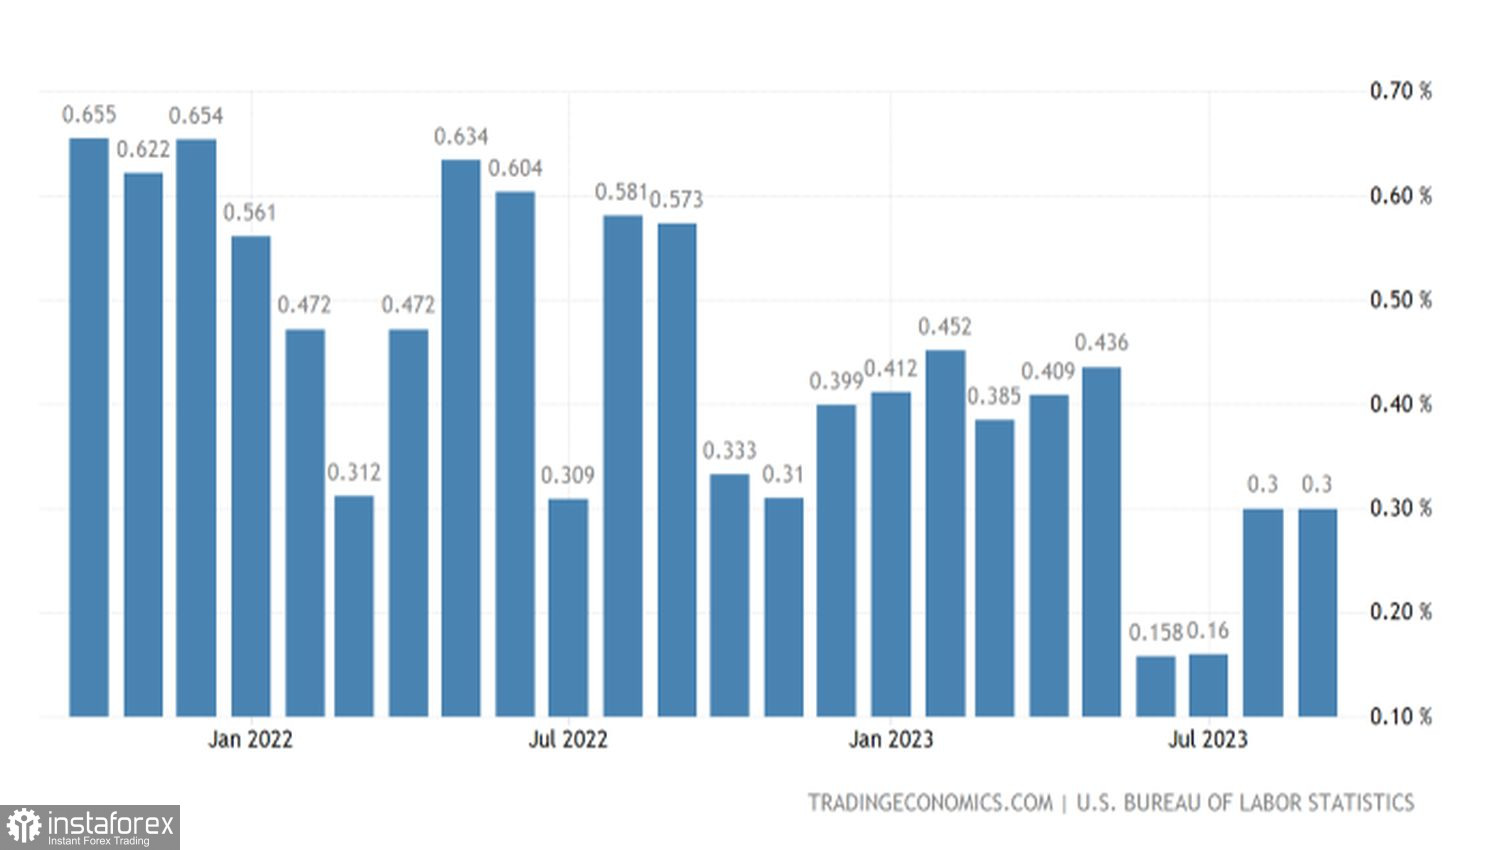
The report on American inflation for September brought the "bulls" on EUR/USD back down to earth. In annual terms, the CPI grew at the same pace as in August, at 3.7%. Core inflation, as expected, slowed down to 4.1%. However, the monthly data convinced investors that it's still too early to close the door to a federal funds rate increase to 5.75%. The likelihood of such an outcome in December jumped from 28% to 40%, and the dollar and Treasury bond yields once again rose in unison. Dynamics of U.S. core inflation
In October, Federal Reserve officials began discussing how the rally in debt rates had tightened financial conditions. In other words, the bond market had done part of the central bank's job. Investors interpreted this rhetoric as a signal that the monetary tightening cycle was coming to an end. CME derivatives implied a 91% probability of maintaining the federal funds rate in November and 72% in December.
Furthermore, discussions about a dovish pivot have resumed in the Forex market. BNP Paribas, in particular, noted that for the federal funds rate to remain at 5.5%, inflation would have to remain flat for a long time. If it slows down as rapidly as it has in the past, the chances of the Fed easing monetary policy in 2024 will increase dramatically.
The U.S. inflation report for September has made significant corrections to this theory. Consumer prices do not necessarily have to slow down; they could accelerate. As a result, the theme of monetary policy divergence, which underpins the downward trend in EUR/USD, has returned to the market.
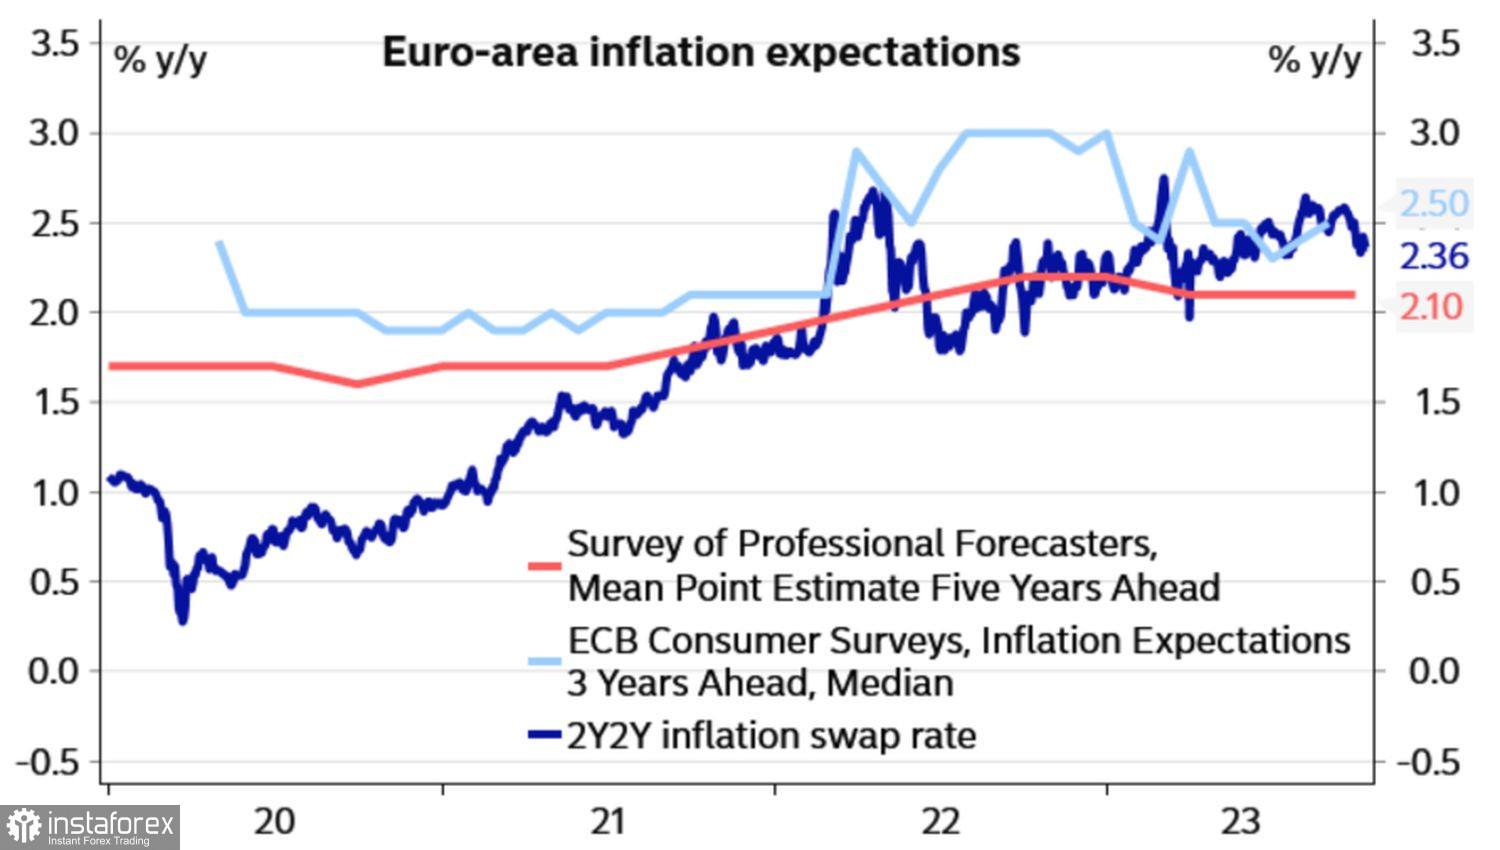
Indeed, the minutes of the latest European Central Bank meeting expressed concerns about the state of the Eurozone's GDP. It is difficult to bring inflation back to the 2% target without causing significant harm to the economy. The ECB now believes that the risks of overdoing monetary policy tightening outweigh the risks of doing too little and letting the inflation genie out of the bottle again. The regulator noted that inflation expectations are anchored. This is another piece of evidence supporting the end of the monetary tightening cycle.
Indeed, the minutes of the latest European Central Bank meeting expressed concerns about the state of the Eurozone's GDP. It is difficult to bring inflation back to the 2% target without causing significant harm to the economy. The ECB now believes that the risks of overdoing monetary policy tightening outweigh the risks of doing too little and letting the inflation genie out of the bottle again. The regulator noted that inflation expectations are anchored. This is another piece of evidence supporting the end of the monetary tightening cycle.
Dynamics of European inflation expectations
Therefore, the bears for EUR/USD have played the old but effective card of divergence in monetary policy. Markets do not rule out the possibility of a federal funds rate hike and are practically certain of a deposit rate ceiling of 4% at the ECB. Along with the divergence in economic growth between the U.S. and the Eurozone, this driver could push the main currency pair towards 1.02, if not parity.
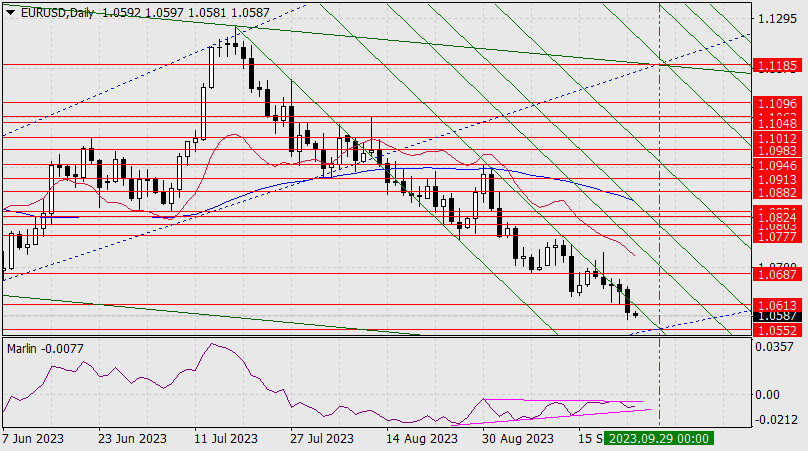
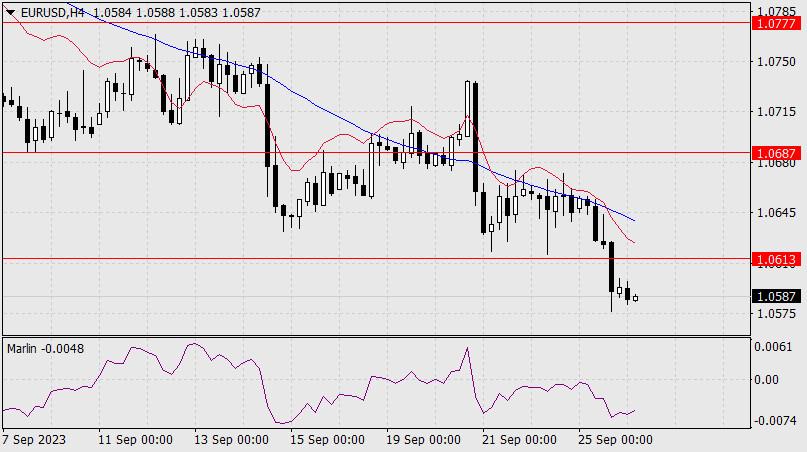
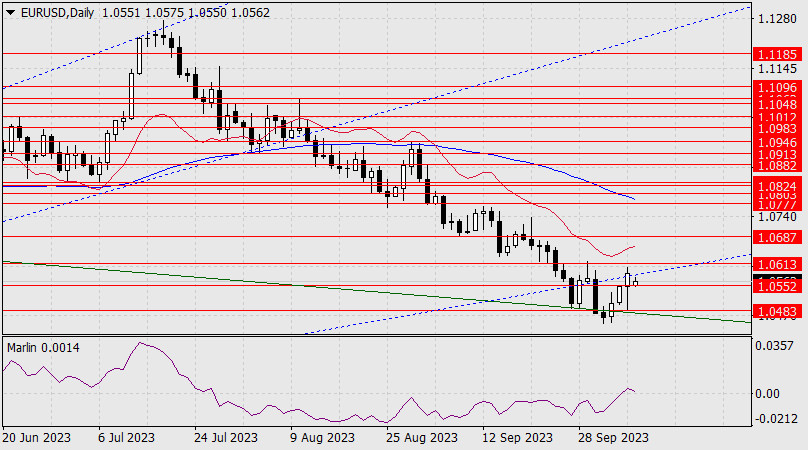
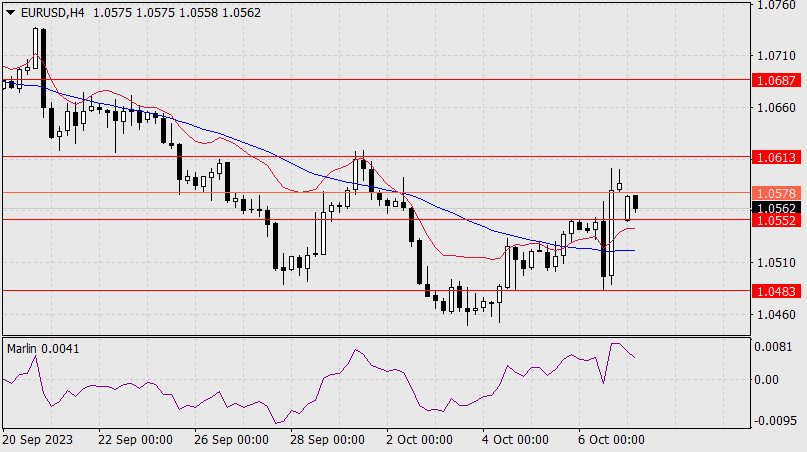
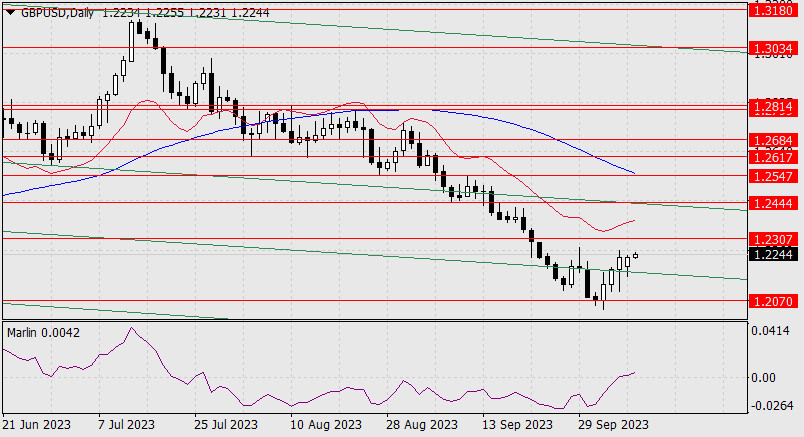
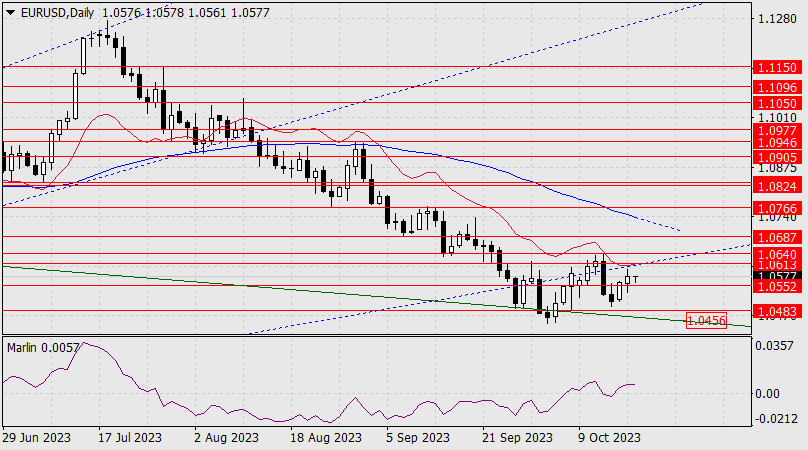
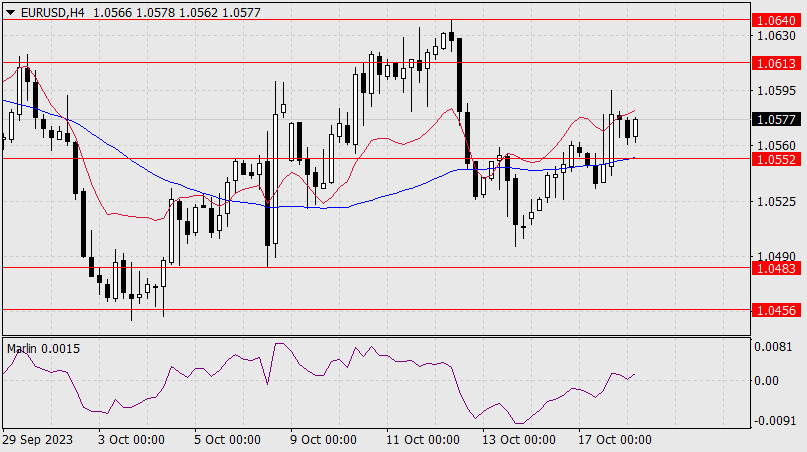
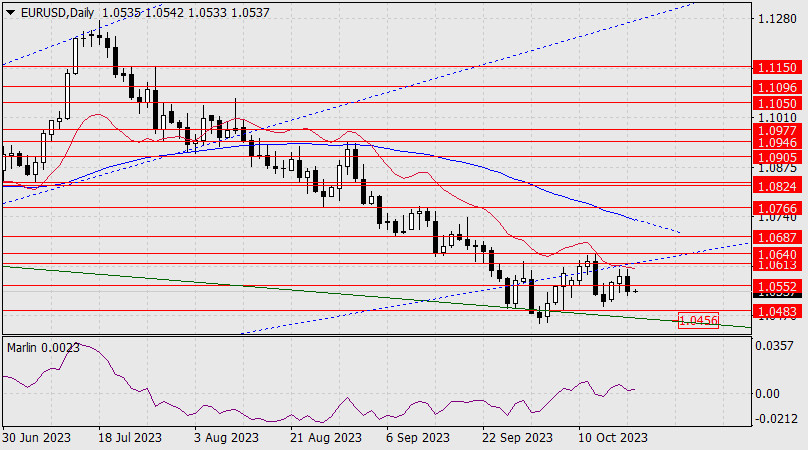
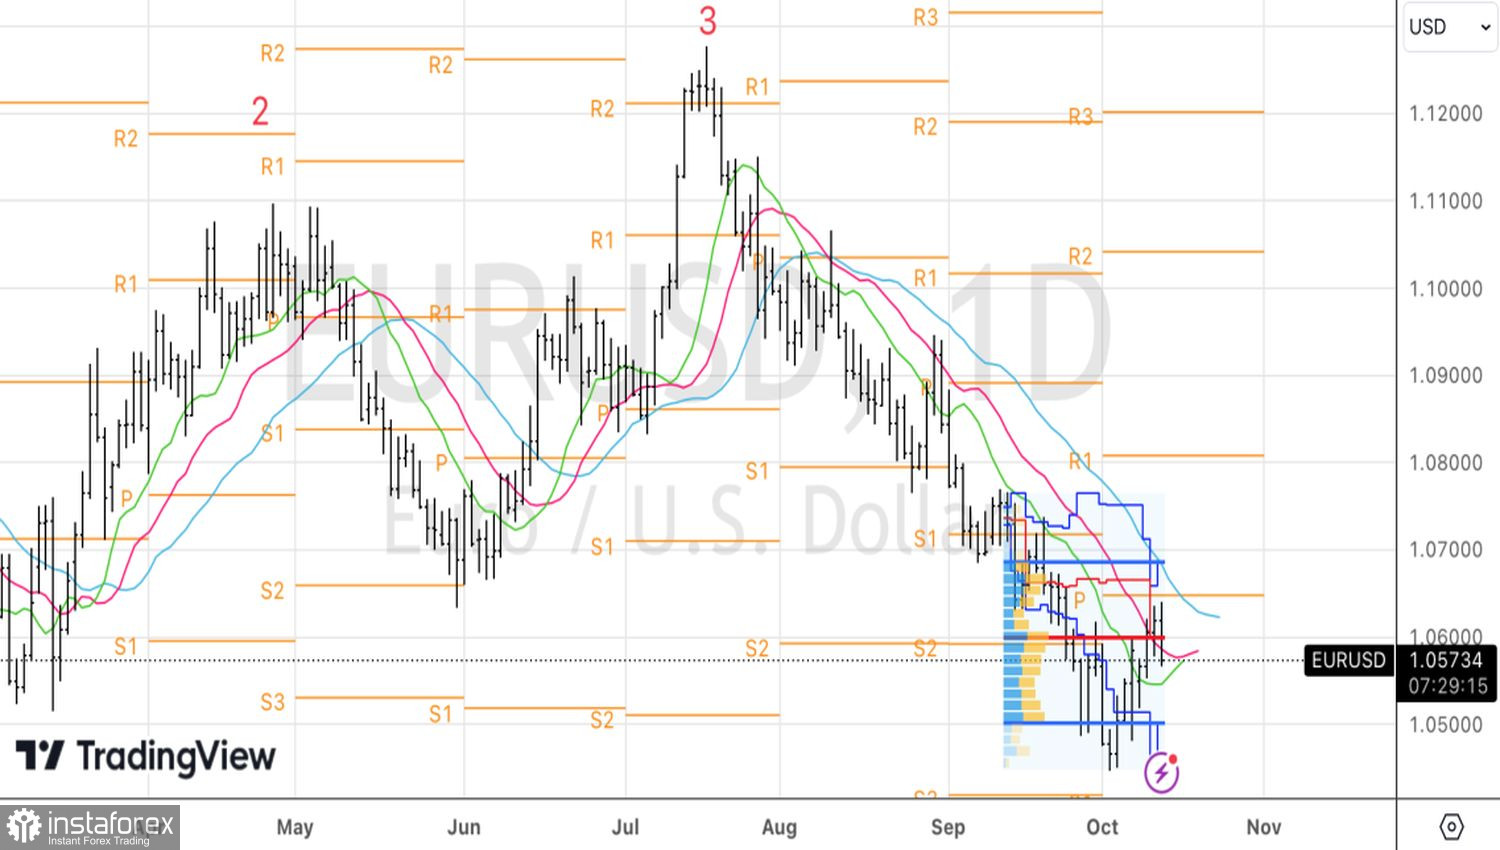
From a technical perspective, the EUR/USD daily chart is currently implementing the Holy Grail strategy. Unsuccessful attempts by the bulls to establish themselves above the red EMA and the fair value indicate their weakness. A return to the breakout bar's low near the 1.0575 level is usually used for forming short positions. As long as the pair trades below this level, the focus is on selling.
Analysis are provided by InstaForex.
Read More
Best regards, PR Manager / Learn more about InstaForex Company at http://instaforex.com