forex software

Create and Test Forex Strategies

forex software

Skip to forum content

Forex Software

Create and Test Forex Strategies

You are not logged in. Please login or register.


(Page 57 of 62)

Forex Software → Market Analysis → InstaForex Analysis

Pages Previous 1 55 56 57 58 59 62 Next

You must login or register to post a reply

RSS topic feed

Posts: 1,401 to 1,425 of 1,547

Re: InstaForex Analysis

Forecast of USD/JPY on August 15, 2023

USD/JPY The USD/JPY pair is approaching the target level of 145.90. The Marlin oscillator is gradually turning downwards on the daily chart, indicating a correction towards the nearest support level at 144.73. If the pair surpasses this mark, the next corrective target would be the MACD line at 143.97.

https://forex-images.ifxdb.com/userfiles/20230815/analytics64dae77047baf.jpg

If the price consolidates above 145.90, the pair might continue to rise to the nearest resistance of the global hyperchannel around the 147.90 mark. Beyond this level lies the 148.50 target. The bulls will probably aim for the 147.90-148.50 range next.

https://forex-images.ifxdb.com/userfiles/20230815/analytics64dae77c5f17f.jpg

The shorter timeframe shows us that the MACD line is approaching the support line of 144.73. This fact certainly supports the uptrend, reducing the risk of a deep correction. However, the Marlin oscillator, being a leading indicator, is not growing but gradually decreasing. We expect traders to struggle at the 144.73 level.

Analysis are provided by InstaForex.

Read More

Best regards, PR Manager / Learn more about InstaForex Company at http://instaforex.com

Re: InstaForex Analysis

Forecast for EUR/USD on August 16, 2023

EUR/USD Yesterday's performance was structurally similar to August 10th – a high upper shadow stopped by resistance. This time, the MACD line provided resistance.

https://forex-images.ifxdb.com/userfiles/20230816/analytics64dc3680de9e6.jpg

At the end of the day, the euro settled below this line and below the target level of 1.0924. Now the target is the support level of 1.0865. Consolidating below this level opens the target range of 1.0761/88. It looks like the stock market is already going into a medium- or long-term decline – we never got the expected corrective spike in quotes.

https://forex-images.ifxdb.com/userfiles/20230816/analytics64dc368c4e908.jpg

On the four-hour chart, the price also settled below the MACD line. The Marlin oscillator is descending in the downtrend territory.

Analysis are provided by InstaForex.

Read More

Best regards, PR Manager / Learn more about InstaForex Company at http://instaforex.com

Re: InstaForex Analysis

GBP/USD, H4 | Bearish Continuation Expected?

https://forex-images.ifxdb.com/userfiles/20230817/analytics64dd9c4500643.jpg

The GBP/USD chart exhibits a bearish trend within a descending channel. It suggests a potential move towards the 1st support at 1.2670, aligned with the 61.80% Fibonacci retracement. Additional support is at 1.2591, while resistances stand at 1.2779 and 1.2824, linked with Fibonacci retracement and swing levels respectively. The current chart patterns underscore the ongoing bearish momentum.

Analysis are provided by InstaForex.

Read More

Best regards, PR Manager / Learn more about InstaForex Company at http://instaforex.com

Re: InstaForex Analysis

Indicator analysis: Daily review of EUR/USD on August 18, 2023

Trend analysis (Fig. 1).
The EUR/USD currency pair may move upward from the level of 1.0871 (closing of yesterday's daily candle) to 1.0917, the 14.6% pullback level (blue dotted line). In the case of testing this level, a continued upward movement is possible to the 1.0940 resistance level (thick red line).

https://forex-images.ifxdb.com/userfiles/20230818/analytics64df0d1e297a6.jpg

Fig. 1 (daily chart).
Comprehensive analysis:
Indicator analysis - up;
Fibonacci levels - up;
Candlestick analysis - up;
Trend analysis - up;
Bollinger bands - bottom;
Weekly chart - up.
General conclusion:

Today, the price may move upward from the level of 1.0871 (closing of yesterday's daily candle) to 1.0917, the 14.6% pullback level (blue dotted line). In the case of testing this level, a continued upward movement is possible to the 1.0940 resistance level (thick red line).

Alternatively, the price may move upward from the level of 1.0871 (closing of yesterday's daily candle) to 1.0917, the 14.6% pullback level (blue dotted line). In the case of testing this level, a downward movement is possible to the 61.8% pullback level (red dotted line).

Analysis are provided by InstaForex.

Read More

Best regards, PR Manager / Learn more about InstaForex Company at http://instaforex.com

Re: InstaForex Analysis

EUR/USD analysis for August 21, 2023 - Key resistance level on the test

https://forex-images.ifxdb.com/userfiles/20230821/analytics64e3232fa9575.jpg

Technical analysis:

EUR/USD has been trading upside this morning but I found that market is testing important pivot resistance at 1.0893.

In case of the rejection of the resistance at 1.0893, I see potential downside rotation towards $1.0850.

In case fo the breakout and hold above resistance at 1.0893, I see further rally towards 1.0920 and 1.0950

Stochastic oscillator is showing bullish divergence and bull reading.

Analysis are provided by InstaForex.

Read More

Best regards, PR Manager / Learn more about InstaForex Company at http://instaforex.com

Re: InstaForex Analysis

Technical Analysis of Intraday Price Movement of Nasdaq 100 Index, Tuesday August 22, 2023

https://forex-images.ifxdb.com/userfiles/20230822/analytics64e431ec8b688.jpg

If we look at the 4-hour chart for the Nasdaq 100 index, even though the price is currently below the Supertrend AI indicator, but it has the potential to be corrected upwards, which can be seen from the Trendilo indicator which is trying to break above its Lower band so that 15301.86, and then #NDX still has a chance to continue its decline in the near future to the level of 14701.94 as the main target and 14401.97 as the next target to be achieved.

Analysis are provided by InstaForex.

Read More

Best regards, PR Manager / Learn more about InstaForex Company at http://instaforex.com

Re: InstaForex Analysis

Trading plan for GBP/USD on August 23. Simple tips for beginners

Analyzing Tuesday's trades: GBP/USD on 30M chart

https://forex-images.ifxdb.com/userfiles/20230822/analytics64e507ff54325.jpg

The GBP/USD pair showed quite an interesting downward movement on Tuesday. It retreated after testing the upper band of the sideways channel, in which it has been trading in for over three weeks. The chart above clearly shows what we mean. Thus, despite quite an interesting movement during the day (which was not provoked by a macroeconomic or fundamental background), the pair stayed within the sideways channel, meaning that the flat persists. We already mentioned this – no matter what movements we see, the pair is still moving sideways.

On Tuesday, there was nothing interesting about the economic calendar. One report in the US and a speech by a Federal Reserve official. Even if these events had a slim chance of affecting the market, they certainly aren't the reason for the dollar's growth. Since the upper band of the channel has been tested again, so now we can expect the pair to fall to the 1.2620 level.

GBP/USD on 5M chart
Two trading signals were formed on the 5-minute chart. During the European session, the pair hovered around the 1.2787-1.2791 area for several hours, afterwards it finally rebounded from it, forming a sell signal. Subsequently, the price successfully breached the 1.2748 level at its first attempt and there were no more signals for the rest of the day. Therefore, the short position should have been closed manually towards the evening, with a profit of no less than 40 pips, which is quite good given that volatility was 80 points.

https://forex-images.ifxdb.com/userfiles/20230822/analytics64e5081869140.jpg

Trading tips on Wednesday:

On the 30-minute chart, the GBP/USD pair continues to move in a sideways channel. We still expect the pound to fall, as we still believe it is overbought and unreasonably expensive. However, the market has taken a break for now, so either trade within the sideways channel or wait for the flat to end. In the coming days, we can expect the pound to fall by about 100 pips. The key levels on the 5M chart are 1.2499, 1.2538, 1.2605-1.2620, 1.2653, 1.2688, 1.2748, 1.2787-1.2791, 1.2848-1.2860, and 1.2913. Once the price moves 20 pips in the right direction after opening a trade, you can set the stop-loss at breakeven. On Wednesday, PMIs in the services and manufacturing sectors will be published in both the UK and the US. These aren't crucial reports, and they are unlikely to move the pair out of the flat.

Basic trading rules:
1) The strength of the signal depends on the time period during which the signal was formed (a rebound or a break). The shorter this period, the stronger the signal.
2) If two or more trades were opened at some level following false signals, i.e. those signals that did not lead the price to Take Profit level or the nearest target levels, then any consequent signals near this level should be ignored.
3) During the flat trend, any currency pair may form a lot of false signals or do not produce any signals at all. In any case, the flat trend is not the best condition for trading.
4) Trades are opened in the time period between the beginning of the European session and until the middle of the American one when all deals should be closed manually.
5) We can pay attention to the MACD signals in the 30M time frame only if there is good volatility and a definite trend confirmed by a trend line or a trend channel.
6) If two key levels are too close to each other (about 5-15 pips), then this is a support or resistance area.

How to read charts:

Support and Resistance price levels can serve as targets when buying or selling. You can place Take Profit levels near them.

Red lines are channels or trend lines that display the current trend and show which direction is better to trade.

MACD indicator (14,22,3) is a histogram and a signal line showing when it is better to enter the market when they cross. This indicator is better to be used in combination with trend channels or trend lines.

Important speeches and reports that are always reflected in the economic calendars can greatly influence the movement of a currency pair. Therefore, during such events, it is recommended to trade as carefully as possible or exit the market in order to avoid a sharp price reversal against the previous movement.

Beginners should remember that every trade cannot be profitable. The development of a reliable strategy and money management are the key to success in trading over a long period of time.

Analysis are provided by InstaForex.

Read More

Best regards, PR Manager / Learn more about InstaForex Company at http://instaforex.com

Re: InstaForex Analysis

Forecast for EUR/USD on August 24, 2023

EUR/USD
Yesterday, the euro broke through the key support level at 1.0834. By the end of the day, the euro had risen by 17 points. The nature of this movement suggests that this breakthrough was false. This morning, the price continues to rise above the 1.0865 level. The Marlin oscillator continues its upward turn. Market participants are concerned that tomorrow, Federal Reserve Chairman Jerome Powell will confirm the idea of a strong American economy and hint at another rate hike(possibly by 0.50%).

https://forex-images.ifxdb.com/userfiles/20230824/analytics64e6c44cc5bb8.jpg

The concern arises from the fact that seemingly obvious things might be interpreted differently by the Fed itself, implying that there might be no further tightening. Generally, the Jackson Hole conference doesn't discuss specific issues, such as a rate hike in a month or two, so there will be opportunities for speculation in interpreting Powell's words. Considering the increased volatility of the EUR/USD pair, it might reach the target range of 1.0924/42 regardless of the tone set by the Fed chair. The question is about the euro's medium-term perspective.

https://forex-images.ifxdb.com/userfiles/20230824/analytics64e6c42767787.jpg

On the four-hour chart, following the false downward movement, the price returned above the MACD line, and the Marlin oscillator entered the positive territory. An uptrend in the short-term, and the target range of 1.0924/42 is in sight. Consolidating above this range will open up the next target at 1.1012.

Analysis are provided by InstaForex.

Read More

Best regards, PR Manager / Learn more about InstaForex Company at http://instaforex.com

Re: InstaForex Analysis

EURUSD, H4 | Bounce off support level?

https://forex-images.ifxdb.com/userfiles/20230825/analytics64e821a3d768b.jpg

The EUR/USD pair is showing bearish tendencies, emphasized by its movement in a descending channel and its position beneath a bearish Ichimoku cloud, hinting at a possible price reversal. Given these signals, the pair may continue its descent towards the 1st support at 1.0741. This support gains significance from being an overlap support and its alignment with the 161.80% Fibonacci Extension and 100% level. The 2nd support lies at 1.0666, known as a swing low support. If there's an upward shift, the 1st resistance is at 1.0837, marked as an overlap resistance. The 2nd resistance is at 1.0923, another overlap point. In between, an intermediate resistance exists at 1.0802, serving as a pullback resistance.

Analysis are provided by InstaForex.

Read More

Best regards, PR Manager / Learn more about InstaForex Company at http://instaforex.com

Re: InstaForex Analysis

USDCHF, Day | React off resistance level?

https://forex-images.ifxdb.com/userfiles/20230828/analytics64ec16aa9257d.jpg

The USD/CHF chart displays a bearish trend within a descending channel, indicating a continued price decline. There's a potential for the price to react bearishly at the 1st resistance of 0.8850, influenced by its overlap resistance classification and Fibonacci confluence with the 50% and 61.80% retracement levels, before moving towards the overlap-supported level at 0.8702. The 2nd resistance at 0.8920, also an overlap resistance, strengthens its significance by aligning with the 61.80% Fibonacci Retracement.

Analysis are provided by InstaForex.

Read More

Best regards, PR Manager / Learn more about InstaForex Company at http://instaforex.com

Re: InstaForex Analysis

JAPAN JOBLESS RATE RISES TO 2.7% IN JULY

https://forex-images.ifxdb.com/analysts/big_preview/japan/5.jpg

The unemployment rate in Japan came in at a seasonally adjusted 2.7 percent in July, the Ministry of Internal Affairs and Communications said on Tuesday.

That exceeded expectations for 2.5 percent, which would have been unchanged from the June reading.

The jobs-to-applicant ratio ticked down to 1.29, shy of forecasts for 1.30, which again would have been unchanged.

The participation rate was 63.1 percent, matching forecasts and steady from the June level.

[url=https://ifxpr.com/3rbVYH7]News are provided by
InstaForex.[/url]

Read More

Best regards, PR Manager / Learn more about InstaForex Company at http://instaforex.com

Re: InstaForex Analysis

This week's pack of US data will decide the dollar's fate

This week, the news backdrop will be much stronger than in the previous one. The lion's share of essential reports will come from America, so I will focus on them in this article. Before delving into the data that could significantly affect the dollar's fate, I should note – the labor market and unemployment reports are currently the most crucial because they, along with inflation, influence when the Federal Reserve will stop raising rates and start lowering them. Reports on GDP or business activity are nowhere near as influential as the aforementioned ones.

https://forex-images.ifxdb.com/userfiles/20230828/analytics64ecc3e6576ef.jpg

The first significant report will be released on Tuesday – the JOLTS number of job openings. It's expected that this figure will slightly fall compared to the previous month, but it's rare for the actual value to deviate significantly from market expectations. Hence, while the report is important, the dollar's reaction will depend on the actual figure, which could be neutral.

The second key report is the ADP report on changes in employment in the non-farm sector. This is analogous to the Nonfarm Payrolls but with lesser significance to the market. Reactions to this report are quite frequent, and its values often do not meet market expectations. However, the market values payrolls more, and the final assessment of the labor market's state will be based on the payrolls. Nonetheless, a reaction to the ADP report might also follow.

The third important report is the unemployment rate on Friday. It is expected that for August, the unemployment rate will remain unchanged at 3.5%. However, its increase or decrease can greatly influence market sentiment. I believe that a slight increase will not lead to a decline in the dollar, as this indicator has been near its historical lows for a long time.

The fourth important report is Nonfarm Payrolls, which will be released at the same time as the unemployment report. Payrolls are more significant, and their value has been declining for some time. However, this should not cause confusion, as the FOMC continually tightens its monetary policy, leading to an economic slowdown. Accordingly, the relationship between expectation and reality will be significant here. The forecast is 170,000. Any value above this might cause an increase in demand for the dollar. And the payroll report will most likely overshadow the unemployment report.

Based on the conducted analysis, I came to the conclusion that the upward wave pattern is complete. I still believe that targets in the 1.0500-1.0600 range are quite realistic, and with these targets in mind, I advise selling the instrument. The a-b-c structure appears complete and convincing. Therefore, I advise selling the instrument with targets set around the 1.0788 and 1.0637 marks. I believe that the construction of a downtrend segment will continue, but a corrective wave might start soon.

https://forex-images.ifxdb.com/userfiles/20230829/analytics64ed5f1b8a684.jpg

The wave pattern of the GBP/USD pair suggests a decline within the downtrend segment. There is a risk of ending the current downward wave if it is wave "d" and not "1". In that case, wave 5 could start from current levels. However, in my opinion, we are currently witnessing the construction of the first wave as part of a new downward segment of the trend. A successful attempt to break through the 1.2618 mark, corresponding to 127.2% Fibonacci, indicates the market's readiness for new short positions. I advise selling with targets set around the 1.2443 mark.

Analysis are provided by InstaForex.

Read More

Best regards, PR Manager / Learn more about InstaForex Company at http://instaforex.com

Re: InstaForex Analysis

Forecast for EUR/USD on August 30, 2023

EUR/USD
On Tuesday, the euro tried to approach the support level of 1.0774, but the bulls held on to their strong positions, and as a result, the euro closed the day above the resistance level of 1.0865. The single currency started the day with a bearish correction, but eventually, it will try to test the resistance at 1.0931, above which the MACD line lies. The Marlin oscillator is also approaching the boundary of the uptrend territory. If the price surpasses 1.0931 concurrently with Marlin moving into the growth territory, the euro might receive another support for growth. Potential bullish targets are: 1.1012, 1.1062, 1.1096. This growth has a corrective nature.

https://forex-images.ifxdb.com/userfiles/20230830/analytics64eeb0094853c.jpg

In the US, the JOLTS Jobs Openings slowed to 8.82 million in July, well off the estimate of 9.46 million, and June data was revised downwards from 9.582 million to 9.165 million. In Japan, July unemployment increased from 2.5% to 2.7% (the forecast was for it to remain unchanged). Our assumption about the labor market in the US and worldwide losing steam seems justified. We anticipate weak employment data on Friday and the euro to rise further.

https://forex-images.ifxdb.com/userfiles/20230830/analytics64eeafff06214.jpg

On the four-hour chart, the price has settled above the balance and MACD indicator lines, above the 1.0865 level. The Marlin oscillator has sharply jumped. In such a scenario, the price may consolidate and rise further.

Analysis are provided by InstaForex.

Read More

Best regards, PR Manager / Learn more about InstaForex Company at http://instaforex.com

Re: InstaForex Analysis

USDCHF, H4 | Bounce off support?

https://forex-images.ifxdb.com/userfiles/20230831/analytics64f01544ab67b.jpg

The USD/CHF chart exhibits bullish momentum. Potential rebound from 1st support to 1st resistance. 1st support at 0.8772 and 2nd support at 0.8710 (50% Fibonacci Retracement) are crucial. Conversely, 1st resistance at 0.8825 (61.80% Fibonacci Retracement) resists, and 2nd resistance at 0.8866 signifies multi-swing high resistance. These levels indicate potential price reactions.

Analysis are provided by InstaForex.

Read More

Best regards, PR Manager / Learn more about InstaForex Company at http://instaforex.com

Re: InstaForex Analysis

Forecast for GBP/USD on September 1, 2023

GBP/USD
As a result of yesterday, the pound fell by 46 points, returning below the 1.2684 level. The signal line of the Marlin oscillator on the daily chart isn't in a hurry to move downwards; on the contrary, it indicates an intent to rise above the zero line.

https://forex-images.ifxdb.com/userfiles/20230901/analytics64f1546cb50f2.jpg

If the pound realizes this intention, then the pair could rise in the target range of 1.2799-1.2814. Traders across markets are eagerly awaiting today's US employment data for August. If they turn out to be strong, the pound might head towards 1.2547.

https://forex-images.ifxdb.com/userfiles/20230901/analytics64f15461597df.jpg

On the four-hour chart, the price consolidated below the MACD indicator line, with the Marlin oscillator in a waiting position in the uptrend territory. While waiting for the US data, the price might rise above 1.2684, which would significantly improve the bulls' positions.

Analysis are provided by InstaForex.

Read More

Best regards, PR Manager / Learn more about InstaForex Company at http://instaforex.com

Re: InstaForex Analysis

Forecast for EUR/USD on September 4, 2023

EUR/USD
The short-term battle of speculators with the release of US employment data ended in favor of the dollar bulls. The dollar index rose by 0.58%, US government bond yields increased (from 4.25% to 4.30% for 5-year bonds), and stock markets closed mixed. The euro lost 66 pips, reaching the target support at 1.0774. Is this a signal or condition for a medium-term decline? At the very least, we need to wait for the price to settle below 1.0774. Next, we need to confirm a confident reversal of the S&P 500. In other words, the initial conditions can only emerge tomorrow. If this doesn't happen, the euro may rise again, attempting to surpass 1.0931 (MACD line).

https://forex-images.ifxdb.com/userfiles/20230904/analytics64f5450c09321.jpg

We currently have a downtrend on the daily chart, so the nearest target is the level of 1.0692. Overcoming this target could result in the pair aiming for the 1.0483-1.0552 range, which includes the descending price channel line and the Fibonacci retracement level.

There is also potential for a bullish scenario, indicated by the emerging convergence between price and the Marlin oscillator.

If the pound realizes this intention, then the pair could rise in the target range of 1.2799-1.2814. Traders across markets are eagerly awaiting today's US employment data for August. If they turn out to be strong, the pound might head towards 1.2547.

https://forex-images.ifxdb.com/userfiles/20230904/analytics64f544f9cd9a8.jpg

On the four-hour chart, the price has paused at the target support of 1.0774. Consolidating below this level will allow the price to reach the target at 1.0692, but the euro can only reach this level if the stock market remains weak.

Analysis are provided by InstaForex.

Read More

Best regards, PR Manager / Learn more about InstaForex Company at http://instaforex.com

Re: InstaForex Analysis

Forex Analysis & Reviews: Forecast for EUR/USD on September 5, 2023

EUR/USD Yesterday, the euro gained 19 pips despite a relatively muted day. From a technical perspective, the situation has not changed. A close below 1.0774 would pave the way for the bears to reach 1.0692. However, there is a nuance here – it could break the support or a false consolidation to create a distinct convergence with the oscillator rather than leaving it weak as we see it now. On the other hand, it could gradually rise towards the nearest resistance level at 1.0834, then 1.0865, and ultimately 1.0931.

https://forex-images.ifxdb.com/userfiles/20230905/analytics64f699d769ae1_source!.jpg

On the 4-hour chart, we have a neutral situation because the price is moving sideways within the 1.0774-1.0834 range. The Marlin oscillator is also moving sideways, and the price is below both indicator lines, and there is no clear direction.

https://forex-images.ifxdb.com/userfiles/20230905/analytics64f699e10a8dc_source!.jpg

There are no clues on the external side. In the euro area, the composite PMI index for August is expected to fall from 48.6 to 47.0. In the United States, factory orders for July are expected to drop by 2.5%. We await further developments.

Analysis are provided by InstaForex.

Read More

Best regards, PR Manager / Learn more about InstaForex Company at http://instaforex.com

Re: InstaForex Analysis

Forex Analysis & Reviews: EUR/USD. Why is the dollar appreciating?

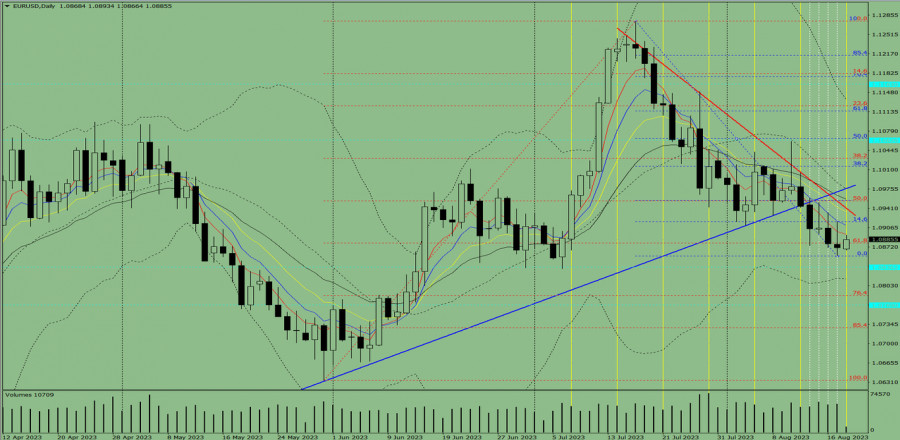
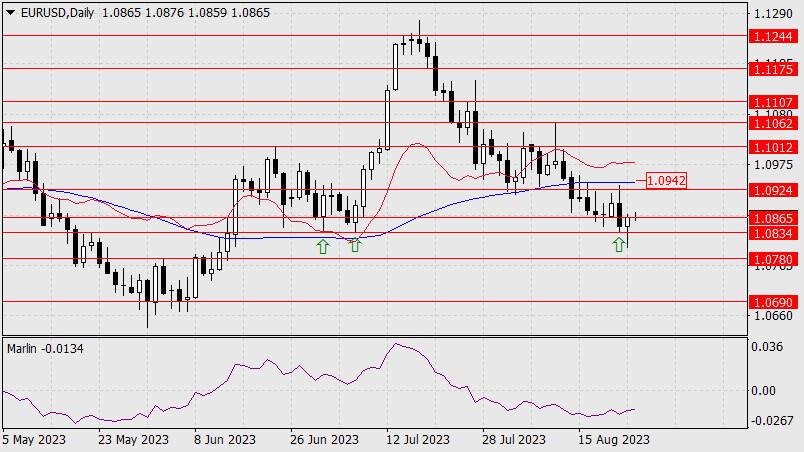
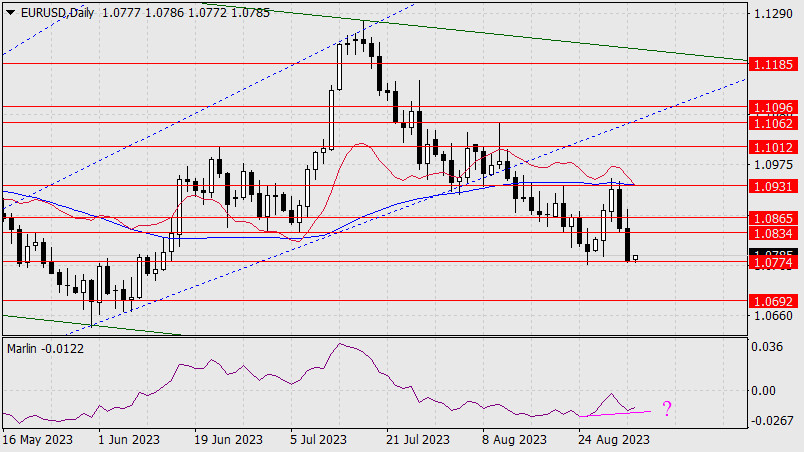
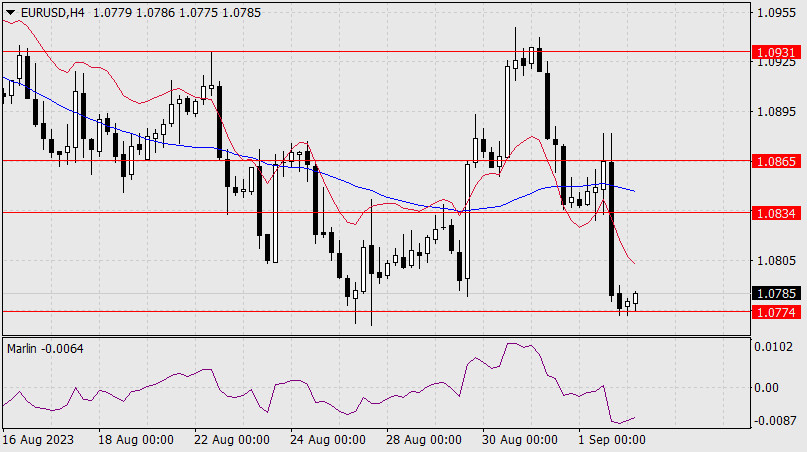
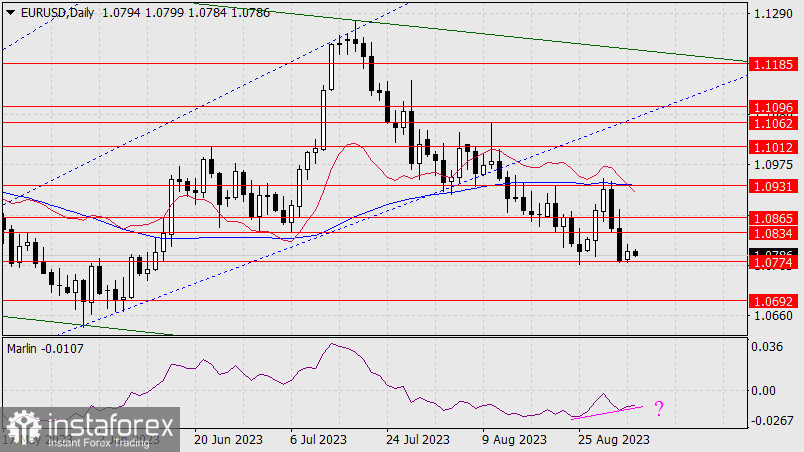
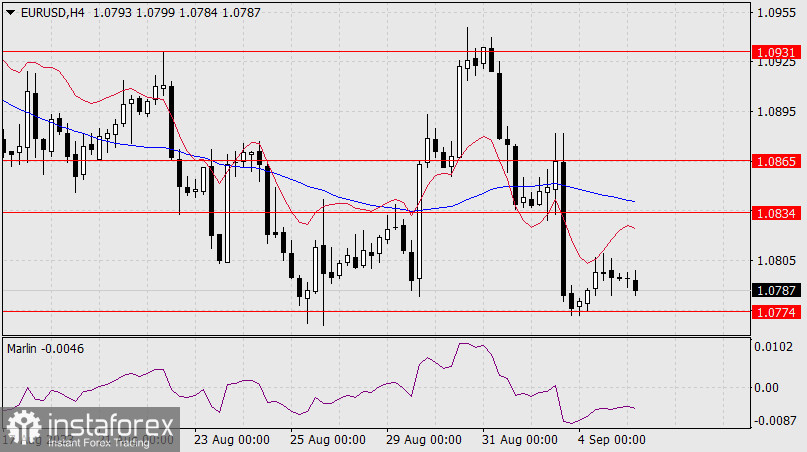
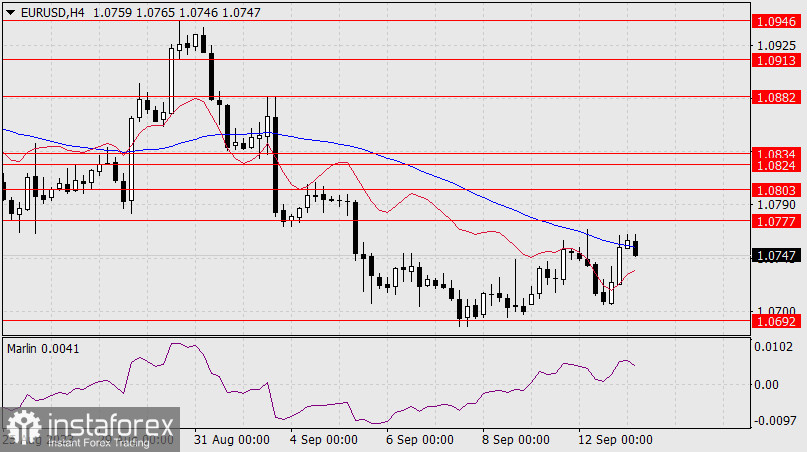
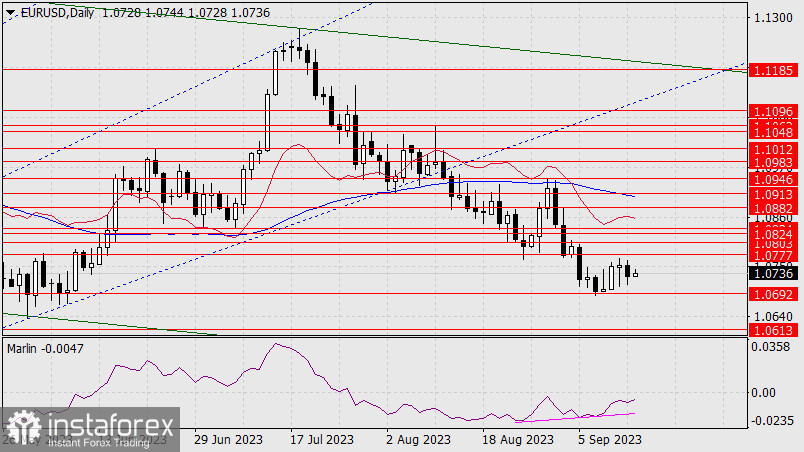
The US Dollar Index rose to a near six-month high on Tuesday. Currency pairs of the "major" group changed their configuration accordingly. In particular, the EUR/USD pair plummeted to the 1.0717 level, dropping to its lowest point in nearly three months. Moving forward, traders should be cautious about the current price dynamics. Short positions appear risky despite the swift and sharp decline in price.

Overall, Tuesday's "downward breakout" is solely due to the dollar's strength. At first glance, the greenback has strengthened without any apparent reason, given the nearly empty economic calendar. The primary reason for this has a deeper, more global nature: the dollar is trading higher amid a risk off mood. The US economy is showing signs of resilience, while there are signs that China and Europe are slowing, disappointing investors with declines in key macroeconomic indicators.

https://forex-images.ifxdb.com/userfiles/20230905/analytics64f7458979937_source!.jpg

The US dollar received support from Chinese fundamental data. Notably, the decline of the Caixin Services PMI reading to 51.8 in August from 51.9 in July, missing market forecasts of an increase to 53.4 points. This is the lowest reading since January. This disappointing result has renewed concerns about the slowdown in the Chinese economy. In response to this report, the Shanghai Composite Index fell by nearly 1%, and the Hang Seng Index dropped by almost 2%.

This report should be considered in conjunction with other reports published in China over the past few weeks. For instance, China's manufacturing PMI rose to 49.7 in August from 49.3 in July. This reading has been below the 50-point mark for the fifth consecutive month. China's non-manufacturing activity index also fell short of the forecast, rising to 51.0 against expectations of 51.3. While it remains "above the waterline," the downtrend has persisted for six months.

At the end of August, The Wall Street Journal published an article on the prospects of China's economic growth. It was quite pessimistic: surveyed economists concluded that the economic model that took China to great-power status seems broken. Weak Chinese fundamental data in July and August (GDP data, trade figures, industrial indicators, PMIs) only illustrated the resounding material from WSJ.

Weak growth in other countries, primarily China and the EU, prompts market participants to acquire the US dollar. Furthermore, according to some experts, the resilient US economy, combined with high inflation (slow decreases in inflation figures), "guarantee" that the Federal Reserve's interest rate will remain high for a long time.

Recent US economic reports indicate that the American economy is feeling fairly confident, despite the extensive and rather aggressive tightening of the Fed's monetary policy. In particular, Goldman Sachs trimmed its prediction for the chance of a recession in the US to 15% from 20%. Therefore, discussions about rate cuts in early next year have essentially been put to rest. Moreover, markets are pricing in another round of rate hikes by the Fed by the end of this year (a 40% probability of a rate hike in November).

At the same time, European reports, for the most part, have been disappointing (PMIs, IFO indices), and representatives of the European Central Bank are expressing concerns about the pace of economic growth in the eurozone. The recently published minutes of the ECB's July meeting also reflected negative trends: ECB members agreed with the chief economist of the ECB that the near-term economic prospects of the eurozone had "deteriorated significantly." Such a news flow has sparked rumors that the central bank may need to start lowering interest rates in the first half of next year. Moreover, the probability of an ECB rate hike in September has decreased to around 30%. Underwhelming China macro data (the EU's largest trading partner) only adds fuel to the fire, simultaneously sparking a risk-off sentiment in the markets.

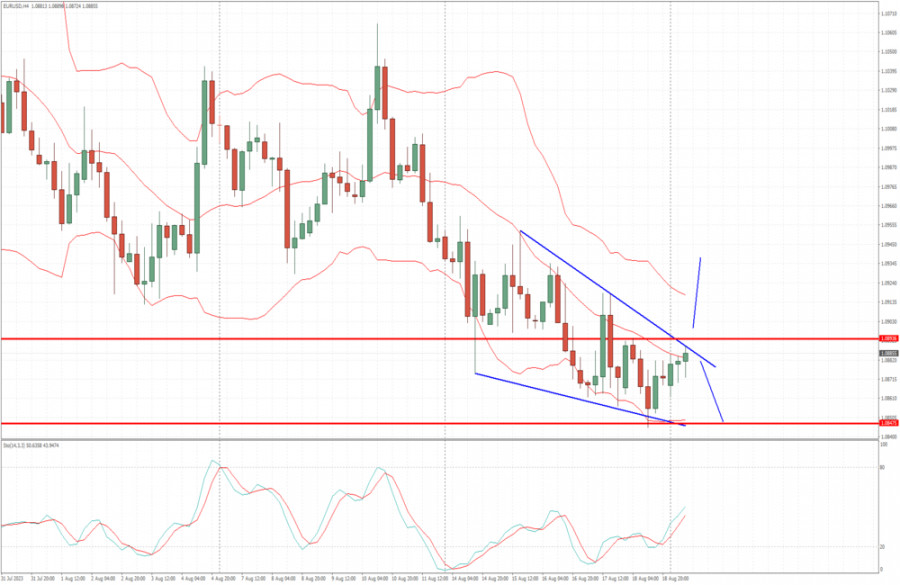
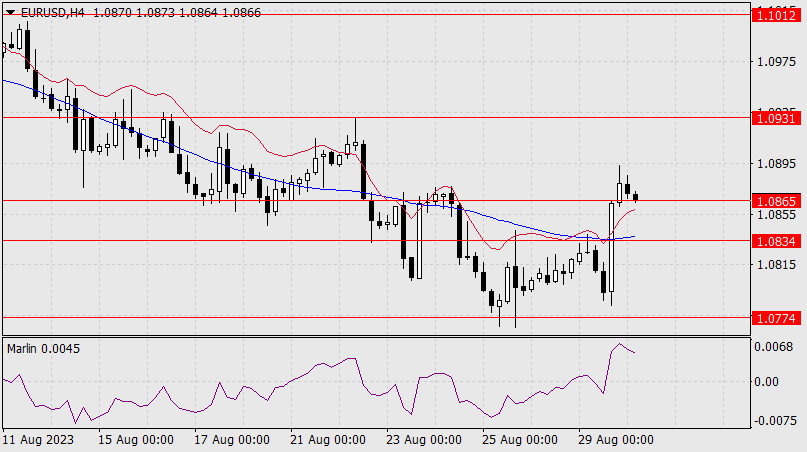
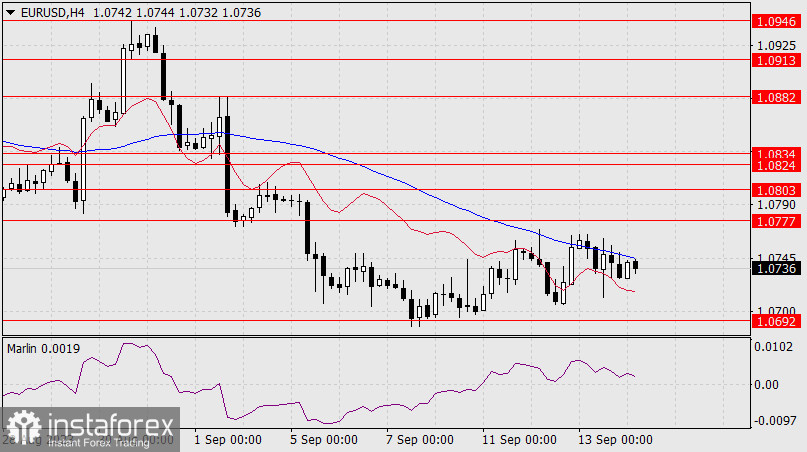
The dollar, in turn, is benefiting from this situation. On Tuesday, the euro slipped further amid risk-aversion, allowing bears to exit the 8-figure territory and establish a new price range between 1.0710 and 1.0800.

The oil market has also provided more (indirect) support to the greenback, as spike in oil prices reignited fears about US inflation accelerating. Brent crude futures rose above $90 per barrel (the first time since November 18, 2022) on news that Saudi Arabia and Russia are extending voluntary oil production cuts by a combined 1.3 million b/d.

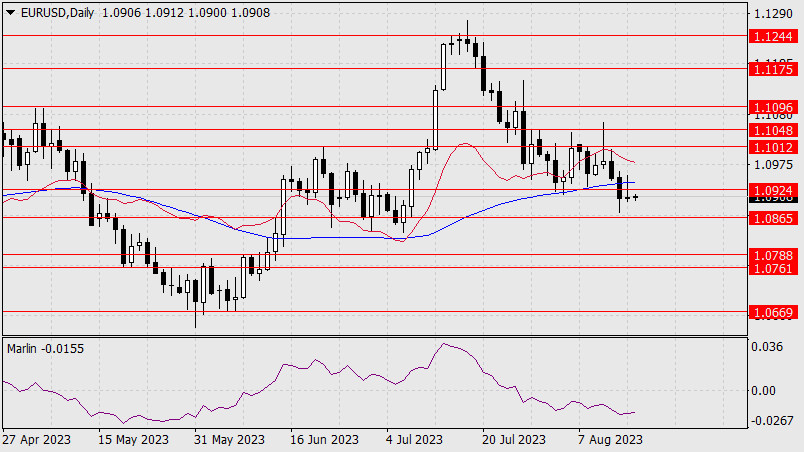
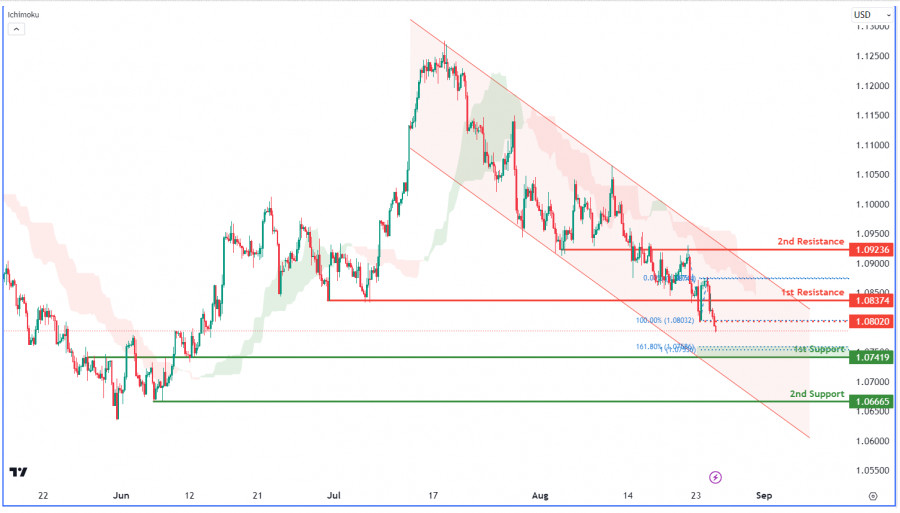
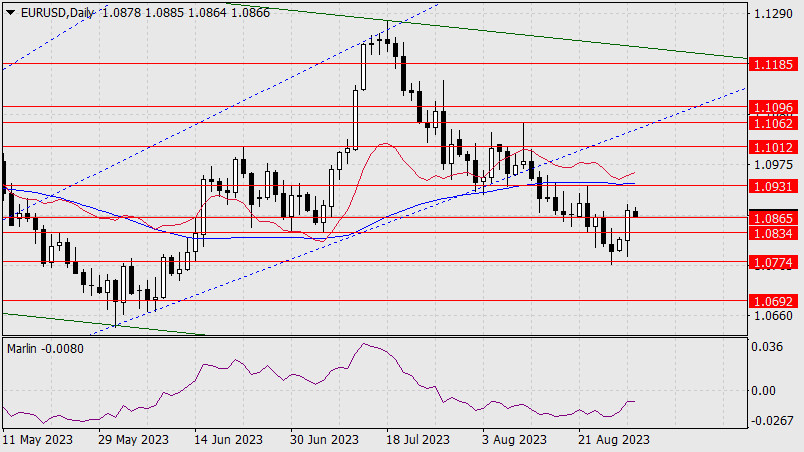
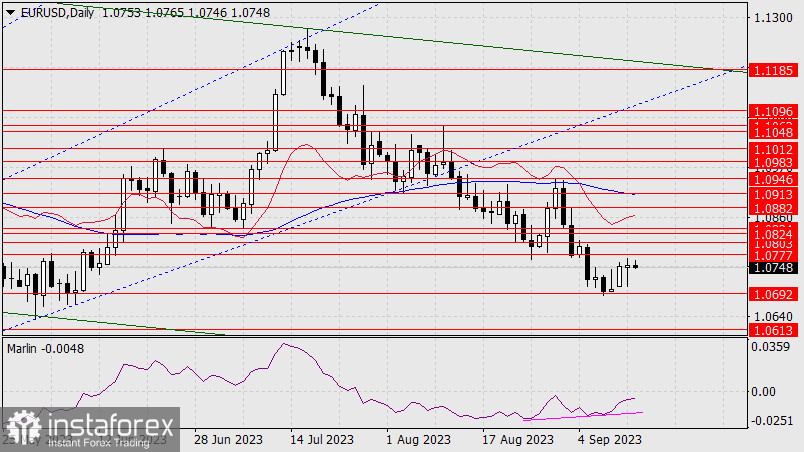
Considering that the EUR/USD pair has approached the lower band of the aforementioned price range (1.0710 - the lower Bollinger Bands line on the daily chart), it's better to be cautious with short positions. In this case, it would be wise to either wait for a bullish correction (to enter short positions aiming for 1.0710) or a breakdown of the support level. In the latter case, the next target for the downward movement will be the 1.0640 level, which is the lower Bollinger Bands line on the weekly chart.

Analysis are provided by InstaForex.

Read More

Best regards, PR Manager / Learn more about InstaForex Company at http://instaforex.com

Re: InstaForex Analysis

Forecast for GBP/USD on September 7, 2023

GBP/USD
The pound has reached an important support level from the embedded line of the global descending price channel. The brewing convergence with the Marlin oscillator on the daily chart warns of a price reversal which indicates a deep correction, possibly towards the range of 1.2799-1.2814, i.e. to the MACD indicator line.

https://forex-images.ifxdb.com/userfiles/20230907/analytics64f936cd79ac7.jpg

According to the Fibonacci retracement, such a correction would be 50.0%. If the price reaches the support at 1.2447 and turns around, the Fibonacci levels will also be corrective in nature, marking the lows of August 3 and 14 at 23.6%. Once we confirm that the price has settled below 1.2447, we can then consider 1.2307 as a target.

https://forex-images.ifxdb.com/userfiles/20230907/analytics64f936decb862.jpg

On the 4-hour chart, the price is rhythmically declining below the indicator lines, and the Marlin oscillator is developing in a descending channel but already shows an intention to leave this area by moving upwards. Yesterday's decline was caused by Bank of England Governor Andrew Bailey's speech in Parliament, where he mentioned reaching the peak of interest rates. However, markets still expect the last rate hike in early 2024, and such sentiment won't hinder corrective growth.

Analysis are provided by InstaForex.

Read More

Best regards, PR Manager / Learn more about InstaForex Company at http://instaforex.com

Re: InstaForex Analysis

XAUUSD H4 | Reacting off 1st Resistance?

https://forex-images.ifxdb.com/userfiles/20230908/analytics64fa99614ea0e.jpg

The XAU/USD chart currently has a bullish momentum, indicating a potential upward trend. There's a likelihood of continued bullish movement towards the first resistance. The first support at 1913.49 is significant, aligning with the 61.80% Fibonacci Retracement. The second support at 1901.55 is also noteworthy, aligning with the 78.60% Fibonacci Retracement. On the resistance side, the first resistance at 1931.97 aligns with the 38.20% Fibonacci Retracement, and the second resistance at 1943.88 aligns with the 78.60% Fibonacci Retracement.

Analysis are provided by InstaForex.

Read More

Best regards, PR Manager / Learn more about InstaForex Company at http://instaforex.com

Re: InstaForex Analysis

Technical Analysis of Intraday Price Movement of Gold Commodity Asset, Monday, September 11 2023

https://forex-images.ifxdb.com/userfiles/20230911/analytics64fe76ff016b7.jpg

With the penetration of the three important levels of the CCI indicator on the 4 hour timeframe, the Gold commodity asset indicates that Sellers are dominating this commodity asset, even though there is currently an upward correction to test the Equal High level of 1928.17, but as long as it does not penetrate above the 1935.42 level, Gold still has the potential to continue. The decline is especially supported by the emergence of the Bearish Continuation Ascending Broadening Wedge pattern, so Gold has the potential to go down and try to penetrate below the 1914.79 level and if this level is successfully penetrated, the level of the Daily Bullish Fair Value Gap area in the range of 1903.38-1911.29 will be the next target to be aimed at.

Analysis are provided by InstaForex.

Read More

Best regards, PR Manager / Learn more about InstaForex Company at http://instaforex.com

Re: InstaForex Analysis

NZDUSD H4 | Falling to 1st support?

https://forex-images.ifxdb.com/userfiles/20230912/analytics64ffdf178da7f.jpg

The NZD/USD chart currently shows a bullish trend with potential for further upward movement. The 1st resistance at 0.5930, coinciding with the 50.00% Fibonacci retracement, is a key level that may impede bullish progress. Similarly, the 2nd resistance at 0.5992 is also significant for potential resistance.

On the downside, the 1st support at 0.5891 aligns with the 61.80% Fibonacci retracement and serves as a strong support level. The 2nd support at 0.5862, identified as a pullback support, adds to the support zone.

Analysis are provided by InstaForex.

Read More

Best regards, PR Manager / Learn more about InstaForex Company at http://instaforex.com

1,423 (edited by ifx.gertrude 2023-09-13 06:19:32)

Re: InstaForex Analysis

Forex Analysis & Reviews: Forecast for EUR/USD on September 13, 2023

EUR/USD:
Yesterday, the volatile day ended in favor of the bulls. Despite the numerous target levels on the daily chart, which is due to the corrective nature of the growth, the main target is defined by the MACD line around 1.0913. Overcoming the nearest resistance at 1.0777 will open the second target at 1.0803, the low from August 23rd.

https://forex-images.ifxdb.com/userfiles/20230913/analytics6501260aca206_source!.jpg

Today, the main driving force could be the US inflation data for August. The forecast for the core CPI is 4.3% YoY, compared to 4.7% YoY the previous month, and the forecast for the CPI suggests an increase from 3.2% YoY to 3.6% YoY. If we assume that the data will come out in line with economists' calculations, investors will pay more attention to the decrease in the core CPI, as the Federal Reserve relies more on it. As a result, expectations of a rate hike will decrease, and the euro will rise.

https://forex-images.ifxdb.com/userfiles/20230913/analytics650126000662b_source!.jpg

Analysis are provided by InstaForex.

Read More

Best regards, PR Manager / Learn more about InstaForex Company at http://instaforex.com

Re: InstaForex Analysis

Forex Analysis & Reviews: Forecast for EUR/USD on September 14, 2023

EUR/USD
Yesterday's US CPI data came in around forecast levels. The August Core CPI dropped from 4.7% YoY to 4.3% YoY, while the CPI rose from 3.2% YoY to 3.7% YoY (forecast 3.6% YoY). Considering that industrial production in the eurozone plummeted by 1.1% in July and decreased by 2.2% YoY (forecast -0.3%), the euro's decline could have been greater than the 24 pips that we saw yesterday.

https://forex-images.ifxdb.com/userfiles/20230914/analytics650271f81f9ec_source!.jpg

Trading volumes were substantial, indicating that there was market activity, and traders preferred to hold their positions ahead of today's European Central Bank meeting, as the probability of a rate hike stands at 68%. If investors showed an intention not to sell the euro based on US inflation data, they may buy it following the ECB meeting. The bullish target is the 1.0824/32 range. Technical convergence in action. A price above this range will open up the target of 1.0882. The MACD line is approaching this level.

https://forex-images.ifxdb.com/userfiles/20230914/analytics650271e956489_source!.jpg

On the 4-hour chart, the price is between the balance and MACD indicator lines. The Marlin oscillator is currently holding an uptrend. A waiting mode is likely until the ECB announces its rate decision.

Analysis are provided by InstaForex.

Read More

Best regards, PR Manager / Learn more about InstaForex Company at http://instaforex.com

Re: InstaForex Analysis

GBPUSD H4 | Bearish Continuation Expected?

https://forex-images.ifxdb.com/userfiles/20230915/analytics6503d8bb9152f.jpg

The GBP/USD chart currently shows a bearish momentum due to trading below the bearish Ichimoku cloud. This could lead to a continued bearish movement towards the significant 1st support level at 1.2372, which is marked as an overlap support. Additionally, the 2nd support at 1.2309 is recognized as a swing low support.

On the resistance side, the 1st resistance level at 1.2448 is a pullback resistance, possibly hindering upward movement. The 2nd resistance at 1.2533 is an overlap resistance, suggesting its potential as a point of reversal or resistance.

Analysis are provided by InstaForex.

Read More

Best regards, PR Manager / Learn more about InstaForex Company at http://instaforex.com

Posts: 1,401 to 1,425 of 1,547

Pages Previous 1 55 56 57 58 59 62 Next

You must login or register to post a reply

Forex Software → Market Analysis → InstaForex Analysis

Similar topics in this forum