forex software

Create and Test Forex Strategies

forex software

Skip to forum content

Forex Software

Create and Test Forex Strategies

You are not logged in. Please login or register.


(Page 60 of 62)

Forex Software → Market Analysis → InstaForex Analysis

Pages Previous 1 58 59 60 61 62 Next

You must login or register to post a reply

RSS topic feed

Posts: 1,476 to 1,500 of 1,547

Re: InstaForex Analysis

https://forex-images.ifxdb.com/userfiles/20231124/analytics656021512f315.jpg

The XAU/USD pair is showing bearish potential, with a significant support at 1985.14, known as an overlap support. If the price drops further, the 2nd support at 1968.63, a swing low support, may offer a defensive stance.

On the upside, the 1st resistance at 1996.02 serves as an overlap resistance, and overcoming it could be challenging. Above that, the 2nd resistance at 2006.90, which is a multi-swing high resistance, could cap the upside.

Analysis are provided by InstaForex.

Read More

Best regards, PR Manager / Learn more about InstaForex Company at http://instaforex.com

Re: InstaForex Analysis

Key events on November 27: fundamental analysis for beginners

Analysis of macroeconomic reports:

https://forex-images.ifxdb.com/userfiles/20231126/analytics6563561fc0b4e.jpg

For Monday, there are hardly any macroeconomic events. We can only highlight the report on new home sales in the United States. Perhaps it will trigger a market reaction of around 20 pips, no more. There will be nothing else interesting in the US, the EU, the UK, or Germany. Therefore, it will likely turn out as another "boring Monday."

Analysis of fundamental events:
https://forex-images.ifxdb.com/userfiles/20231126/analytics65635650ef715.jpg

Among the fundamental events on Monday, we can highlight European Central Bank President Christine Lagarde's speech. However, Lagarde has already spoken several times and will repeatedly speak again. There has been nothing interesting in her speeches lately. This is not surprising since no one expects any drastic changes from the ECB at the moment. Most members of the Governing Council have expressed support for keeping the key rate unchanged for an extended period. So, what can Lagarde or her colleagues tell us now?

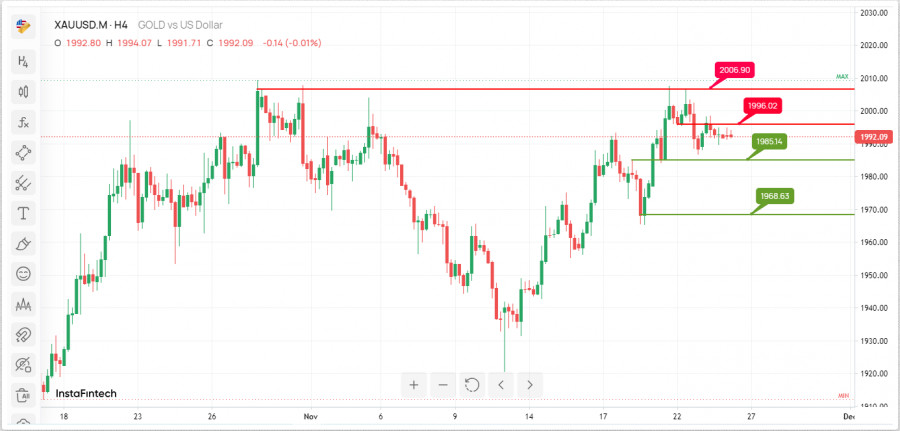
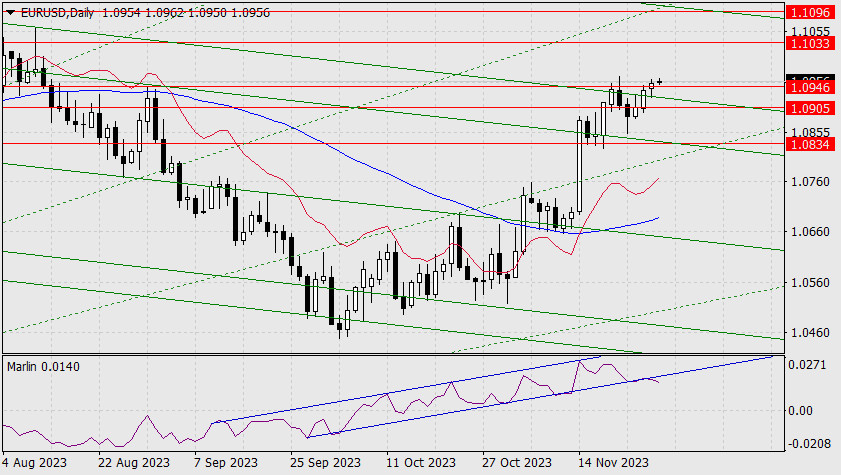
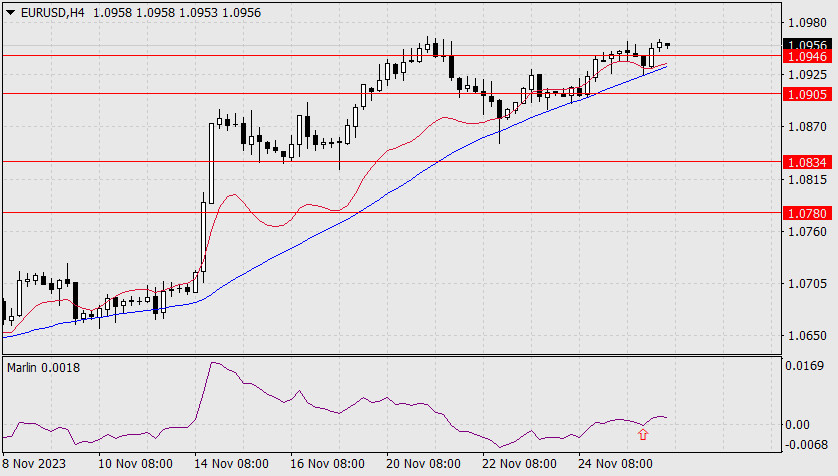
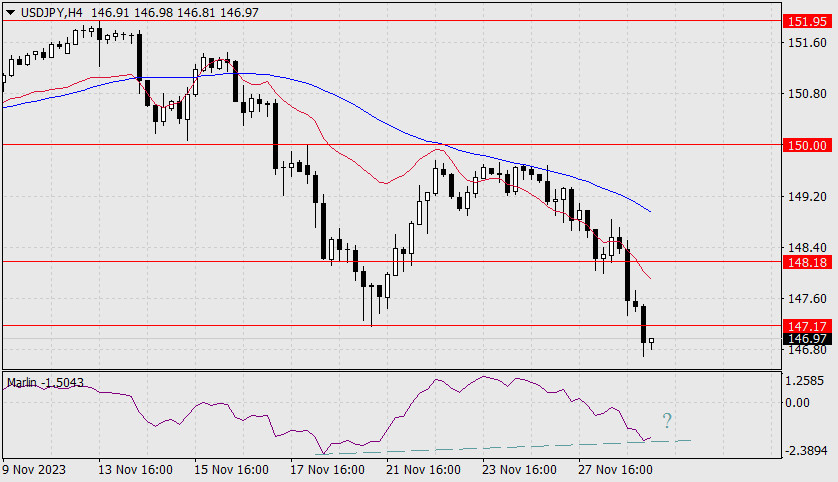
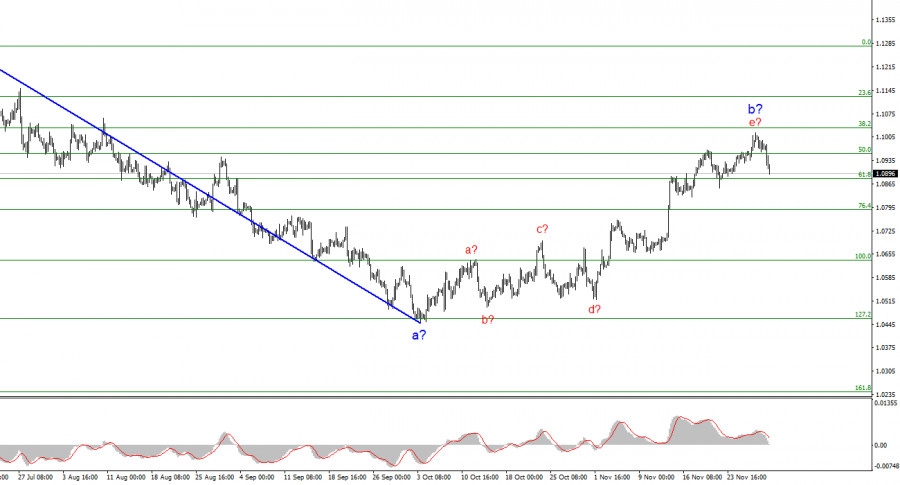
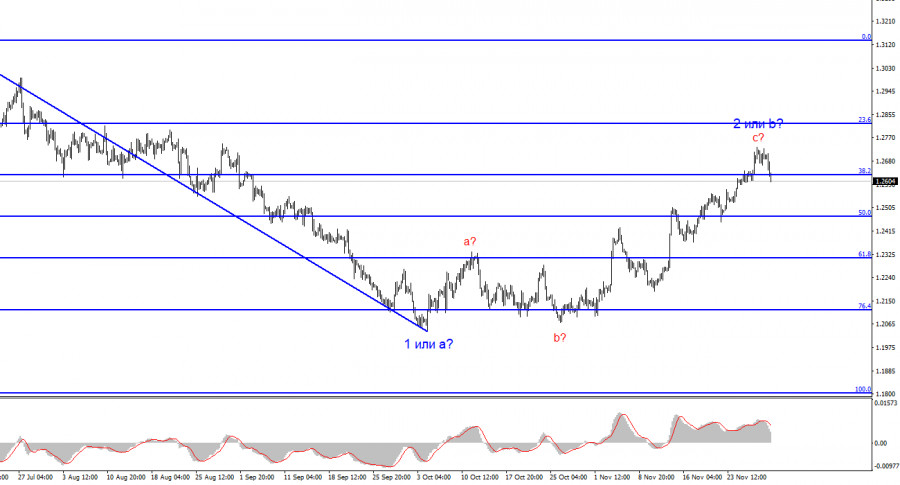
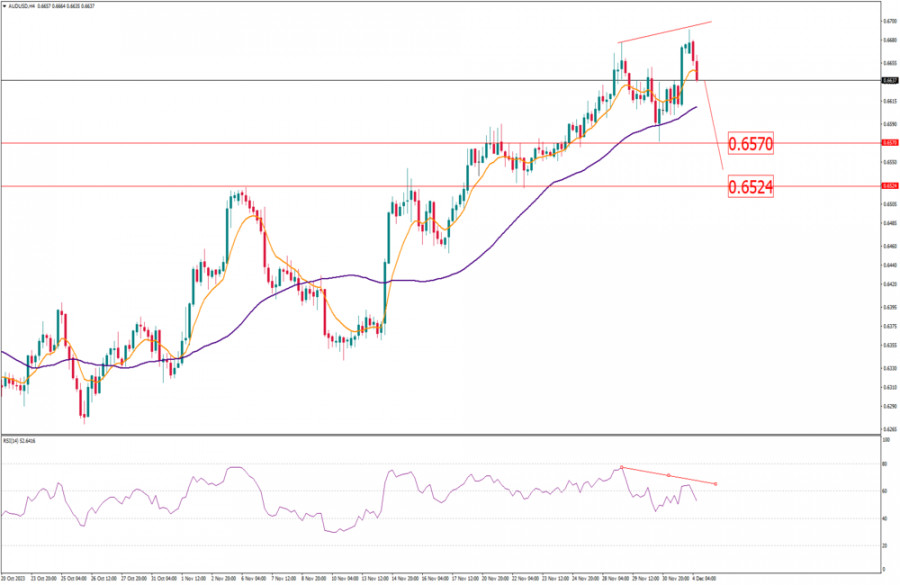
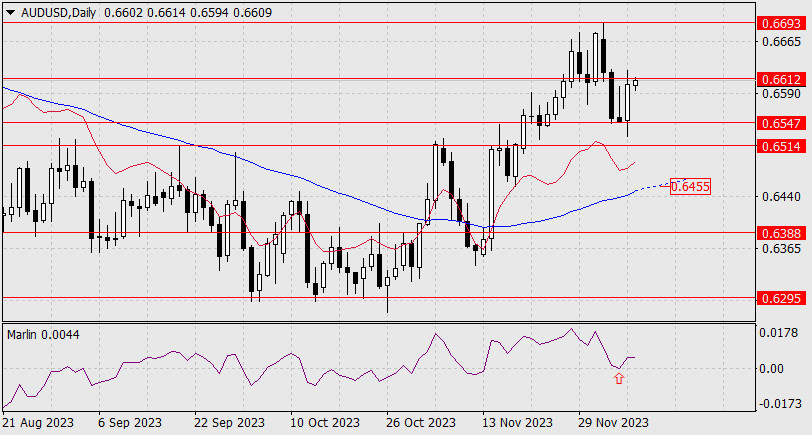
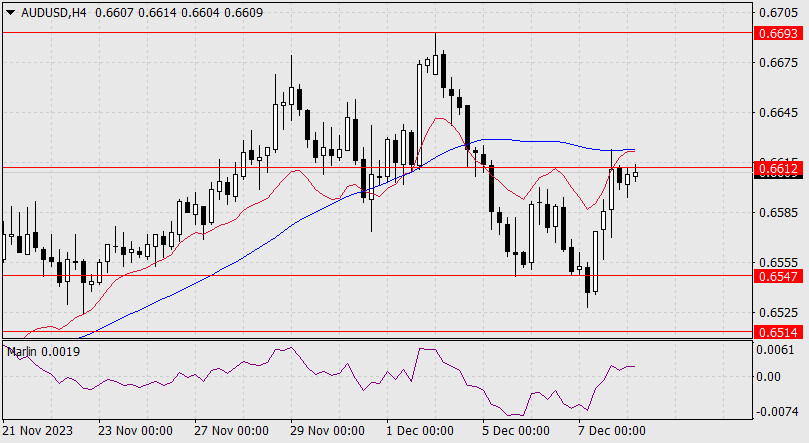
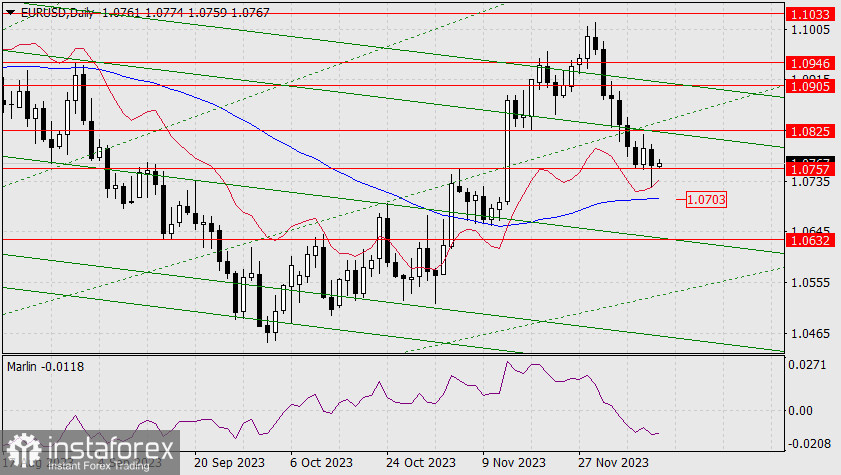
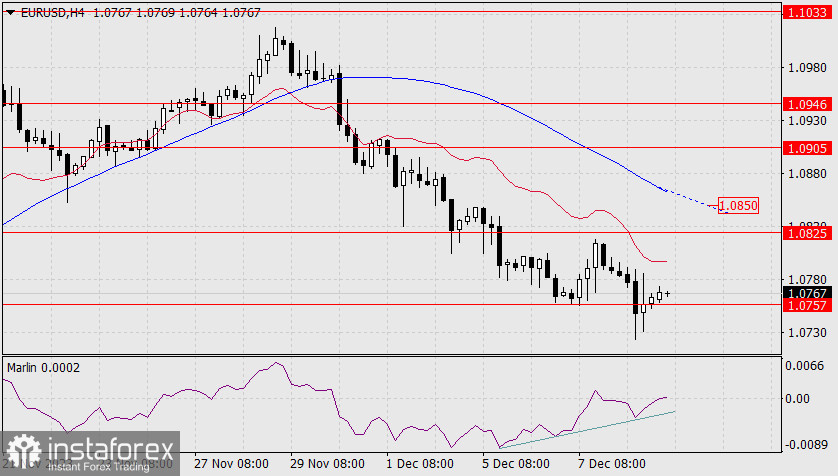
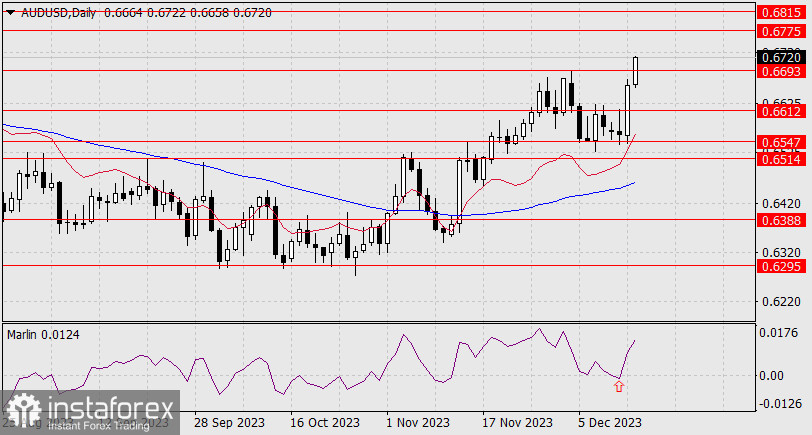
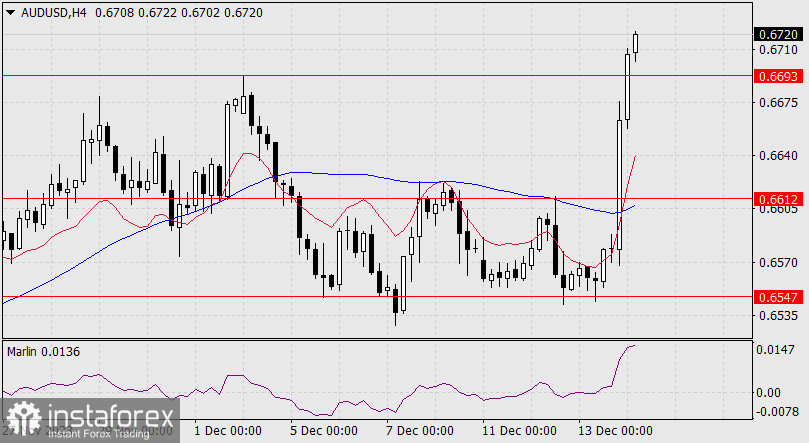
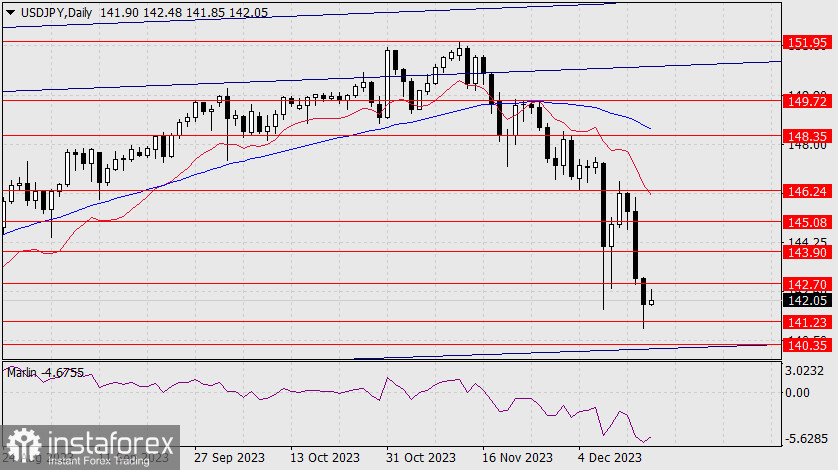
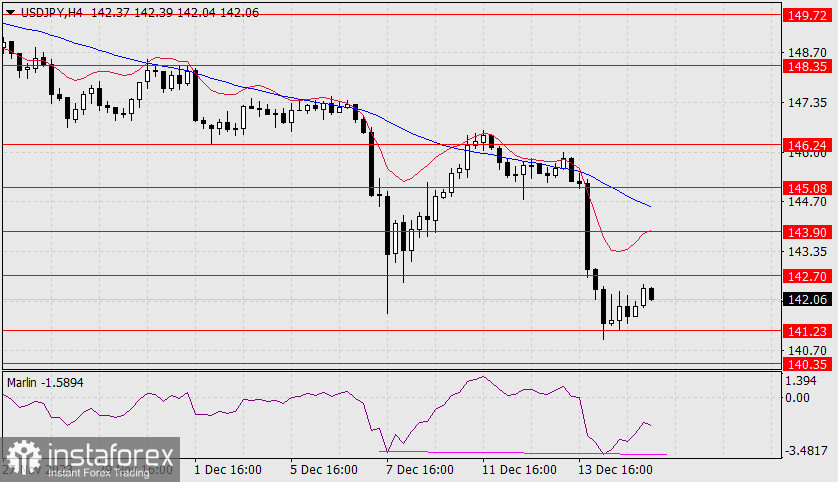
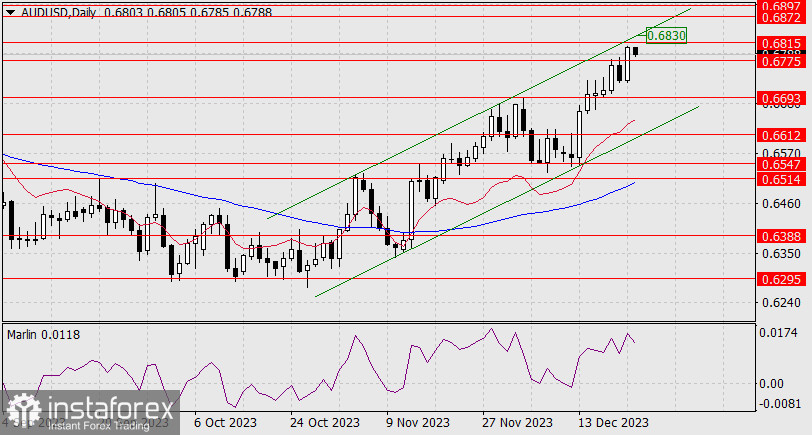
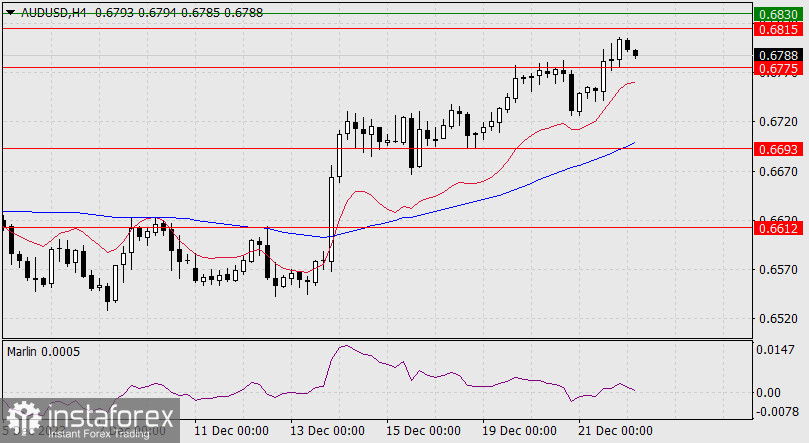
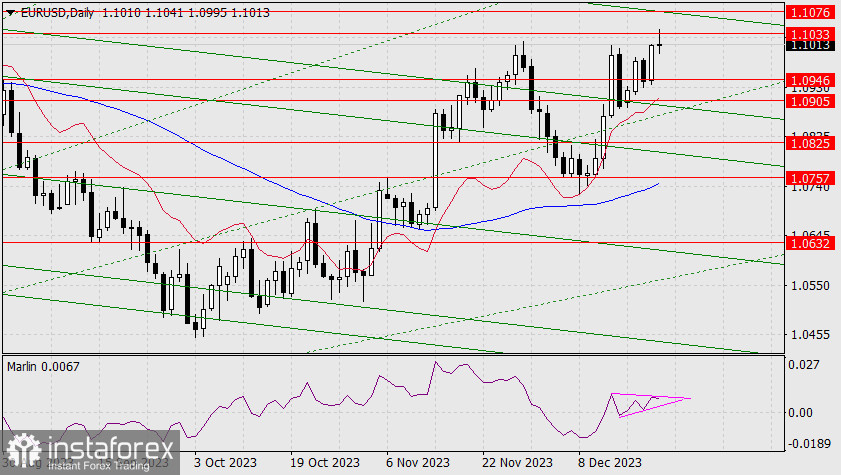
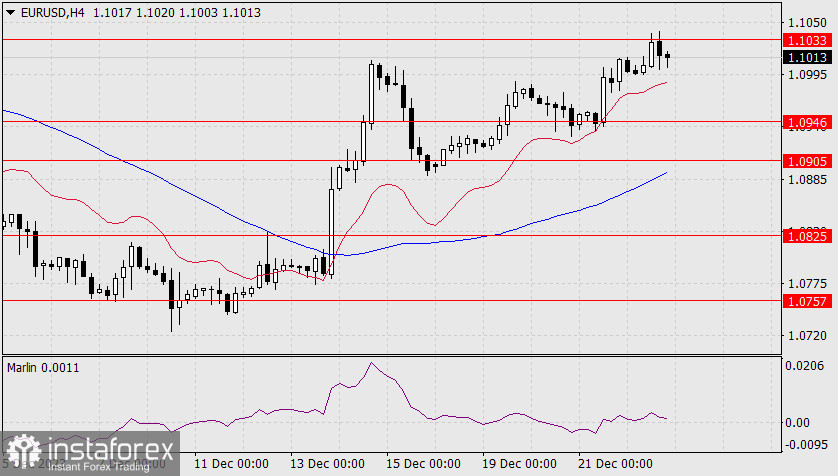
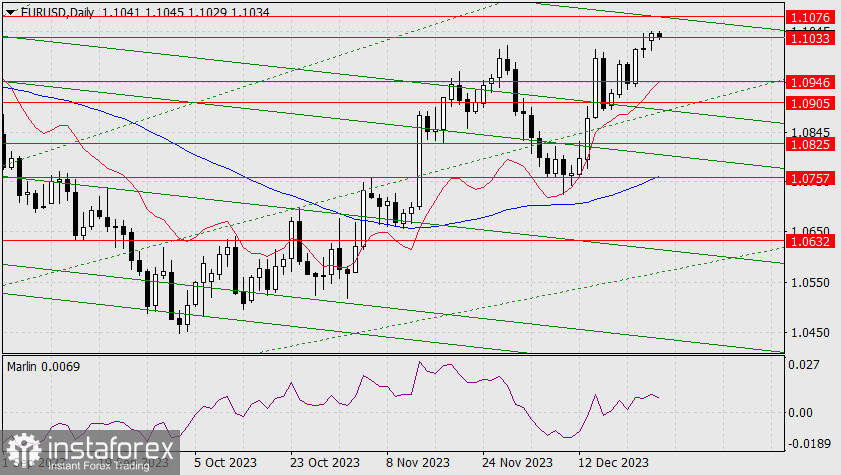
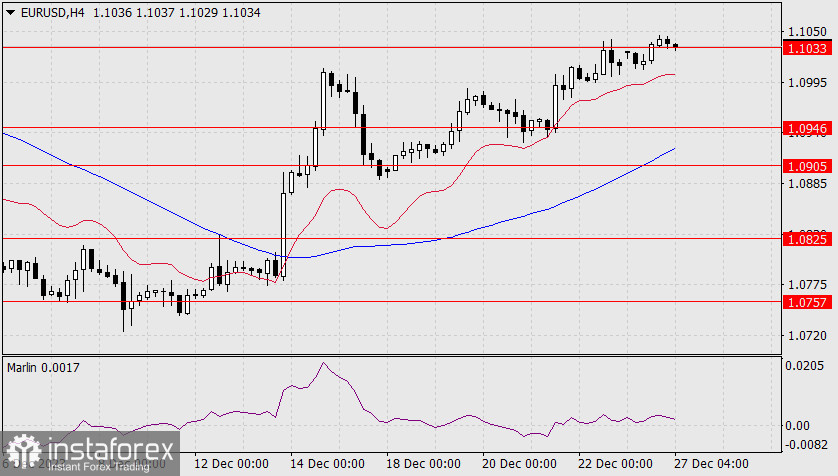
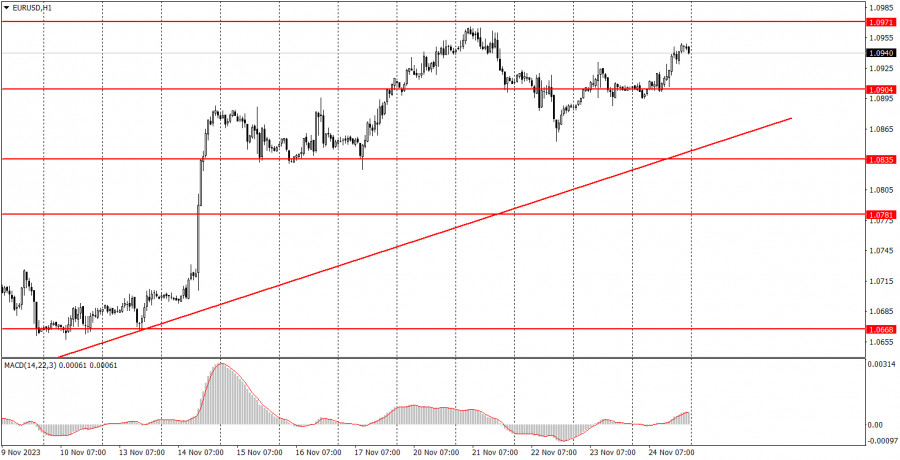
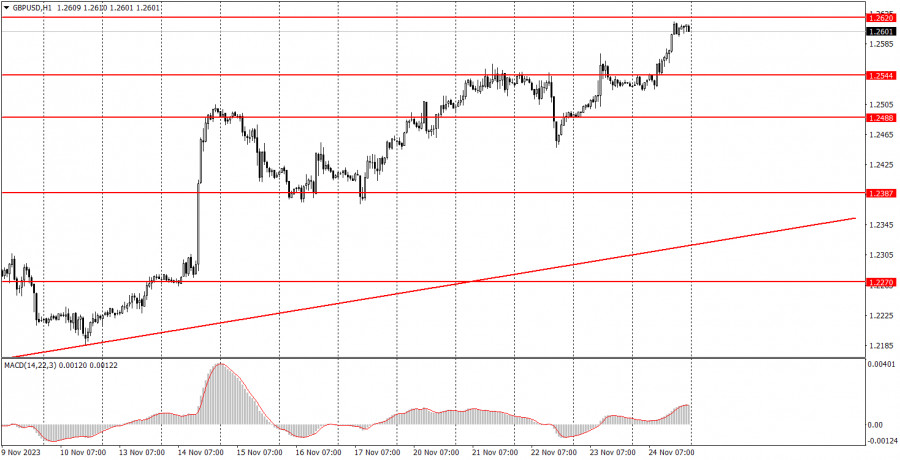
General conclusion: There are no interesting events on Monday. Perhaps Lagarde will finally announce something important, but hopes for this are frankly low. Therefore, most likely, we can expect a boring day. It is worth noting that both pairs can start a downward movement at any moment since they are both overbought.

Basic rules of a trading system:
1) Signal strength is determined by the time taken for its formation (either a bounce or level breach). A shorter formation time indicates a stronger signal.
2) If two or more trades around a certain level are initiated based on false signals, subsequent signals from that level should be disregarded.
3) In a flat market, any currency pair can produce multiple false signals or none at all. In any case, the flat trend is not the best condition for trading.
4) Trading activities are confined between the onset of the European session and mid-way through the U.S. session, post which all open trades should be manually closed.
5) On the 30-minute timeframe, trades based on MACD signals are only advisable amidst substantial volatility and an established trend, confirmed either by a trend line or trend channel.
6) If two levels lie closely together (ranging from 5 to 15 pips apart), they should be considered as a support or resistance zone.
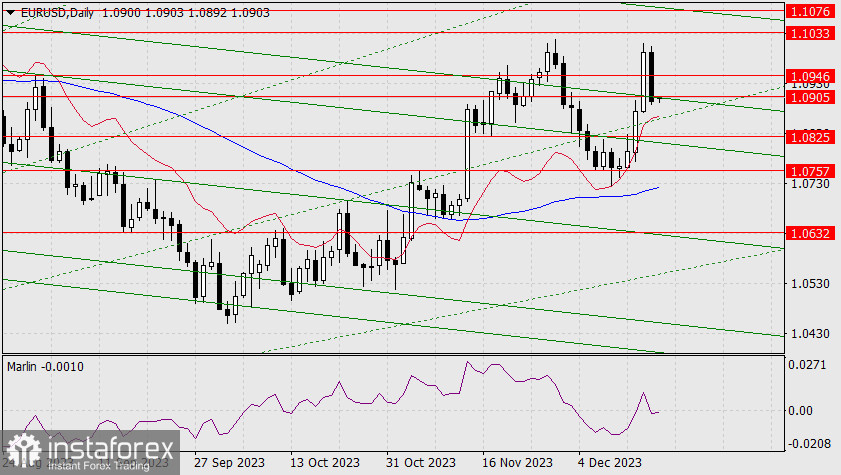
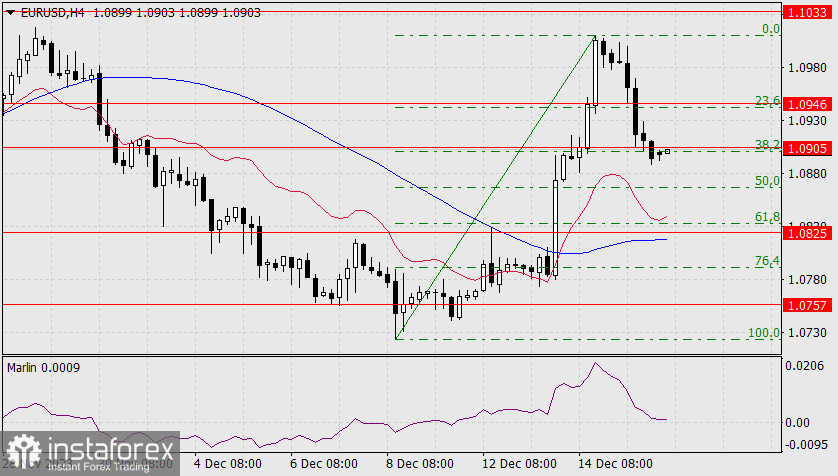
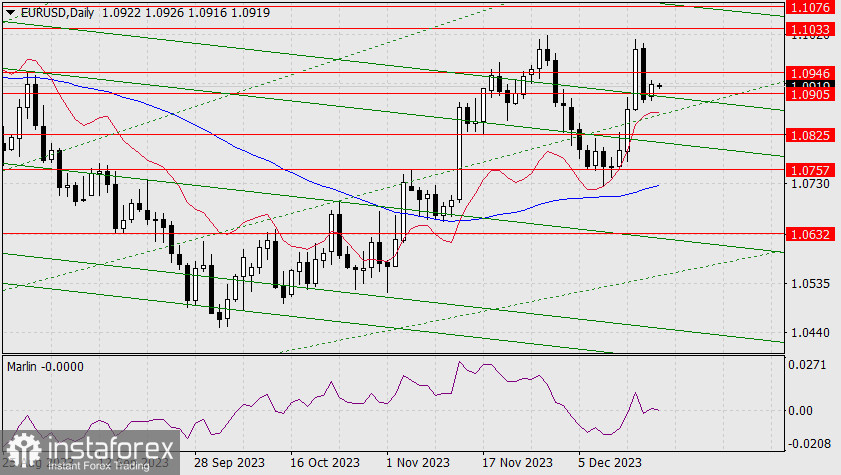
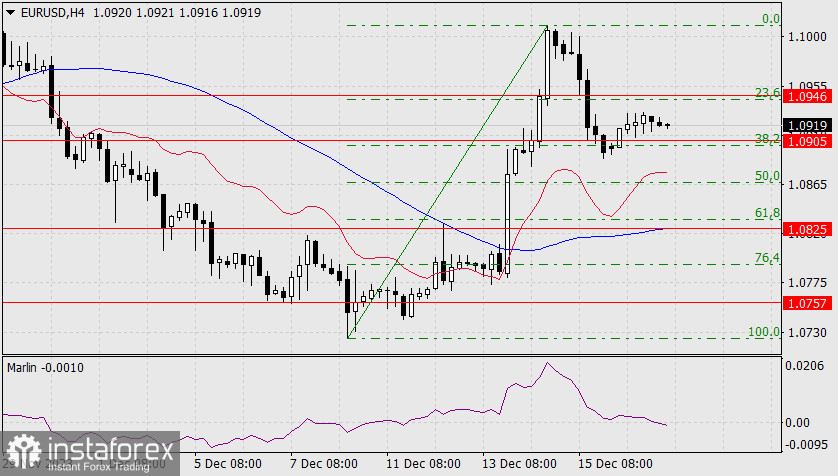
How to read charts:
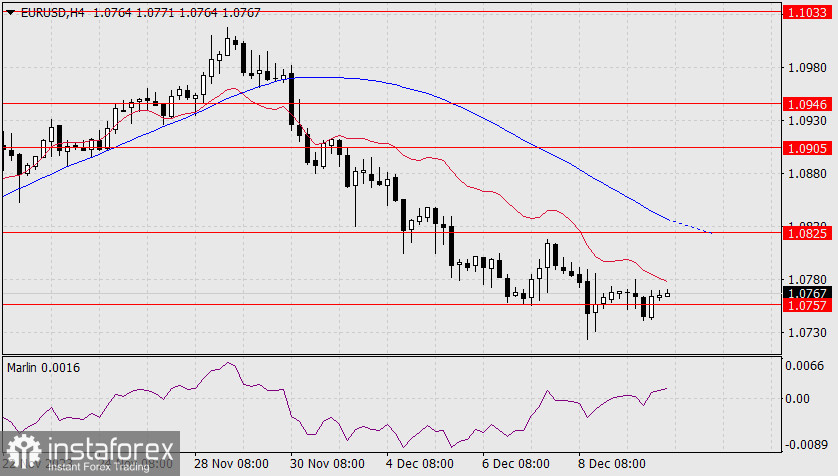
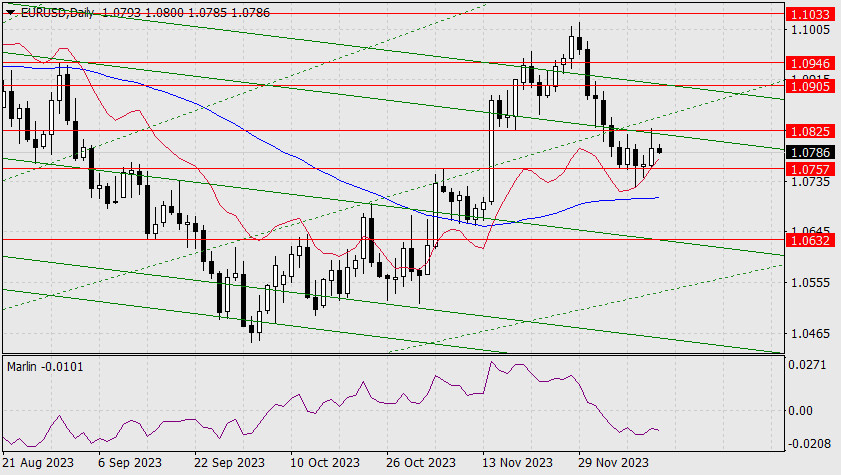
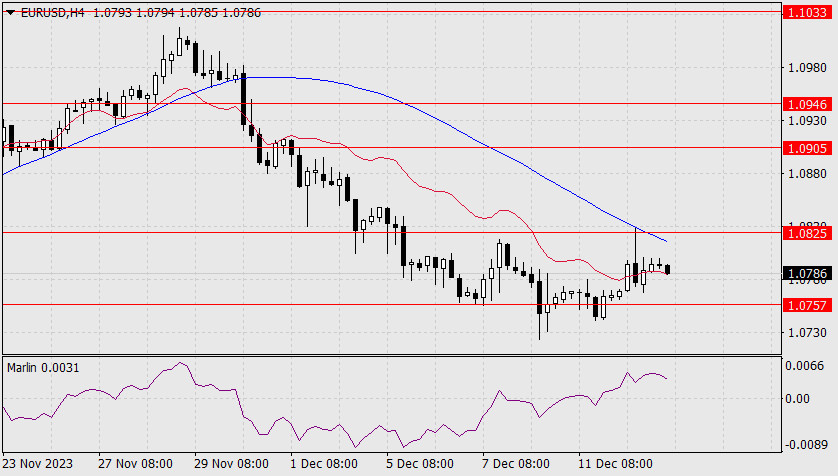
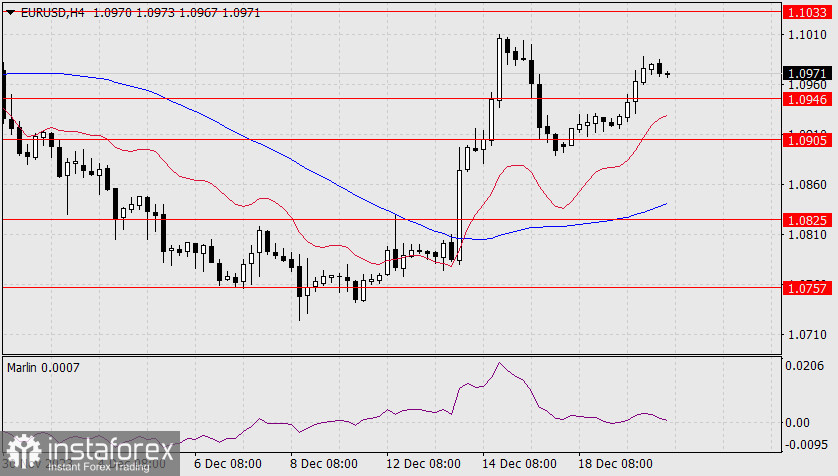
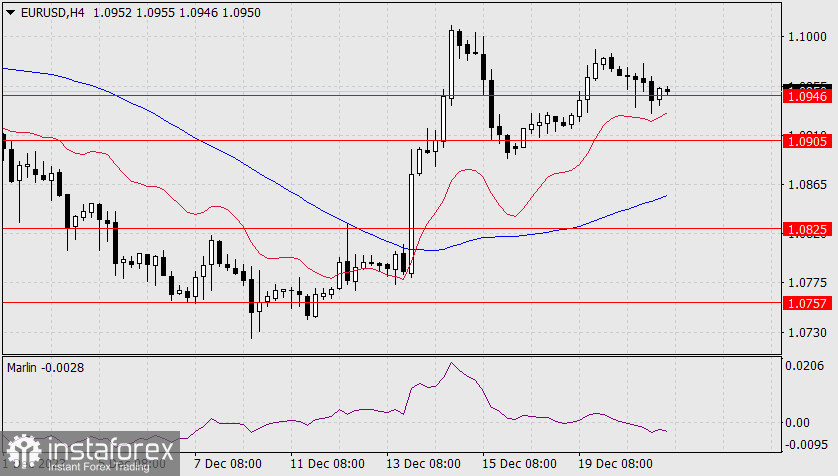
Support and Resistance price levels can serve as targets when buying or selling. You can place Take Profit levels near them.

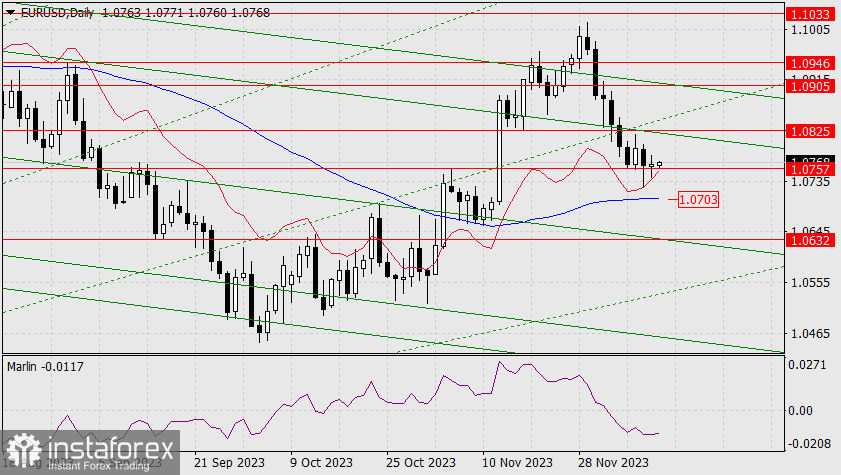
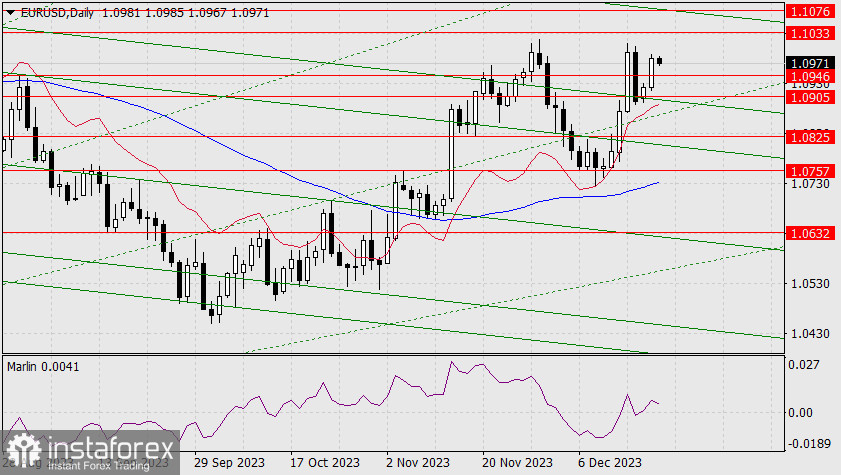
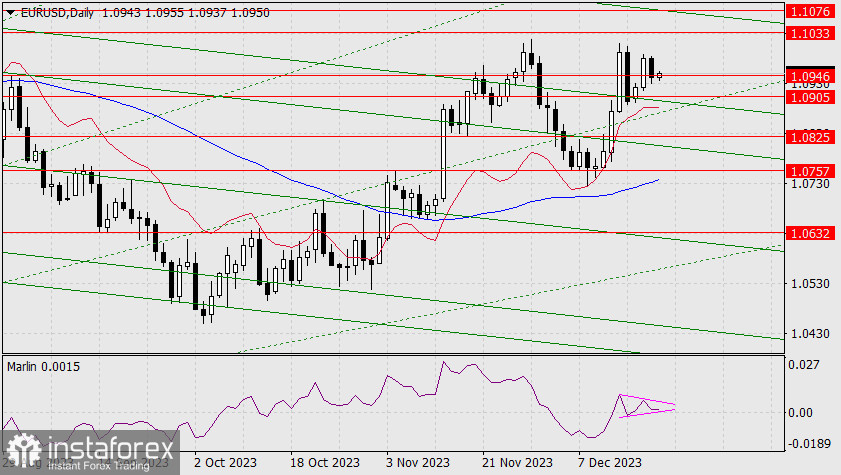
Red lines represent channels or trend lines, depicting the current market trend and indicating the preferable trading direction.

The MACD(14,22,3) indicator, encompassing both the histogram and signal line, acts as an auxiliary tool and can also be used as a signal source.

Significant speeches and reports (always noted in the news calendar) can profoundly influence the price dynamics. Hence, trading during their release calls for heightened caution. It may be reasonable to exit the market to prevent abrupt price reversals against the prevailing trend.

Beginning traders should always remember that not every trade will yield profit. Establishing a clear strategy coupled with sound money management is the cornerstone of sustained trading success.

Analysis are provided by InstaForex.

Read More

Best regards, PR Manager / Learn more about InstaForex Company at http://instaforex.com

Re: InstaForex Analysis

Forecast for EUR/USD on November 28, 2023

EUR/USD
After yesterday's bounce from the support of the green channel line, the price rose above the resistance at 1.0946, closing the day with a white candle. However, the signal line of the Marlin oscillator did not return to its own ascending channel and even strengthened the downward movement.

https://forex-images.ifxdb.com/userfiles/20231128/analytics6565519fd2095.jpg

There is a risk to continuing the upward movement; the price can turn into a correction at any time. Nevertheless, the main bullish scenario is still valid; Marlin simply annuls the current channel and enters the formation of some other formation. However, in order to confirm the growth, Marlin must still turn upwards. The target level of 1.1033 remains relevant.

https://forex-images.ifxdb.com/userfiles/20231128/analytics656551ac56142.jpg

On the 4-hour chart, yesterday, the price tried to attack the support of the MACD indicator line, but failed. The signal line of the Marlin oscillator turned upward from the zero line. The uptrend may strengthen. We are waiting for the price at the nearest target level. To develop a correction, the price must overcome yesterday's low at 1.0926. The first corrective target will be 1.0905.

Analysis are provided by InstaForex.

Read More

Best regards, PR Manager / Learn more about InstaForex Company at http://instaforex.com

Re: InstaForex Analysis

Forecast for USD/JPY on November 29, 2023

USD/JPY
The USD/JPY pair has been falling for the fourth day, at an accelerated pace for three days. The pair breached the support at 147.17 (November 21st low) this morning, and it can reach the target of 145.08 (June peak). The Marlin oscillator is also falling at a decent pace, but it is still far from the oversold territory. Even if the pair's downward movement slows down, we expect it to reach the target support.

https://forex-images.ifxdb.com/userfiles/20231129/analytics6566a5c81198a.jpg

U.S. government bonds are rapidly losing yield. The yield on 5-year bonds has fallen from 4.51% to 4.25% since the beginning of the week. Along with this, the dollar is declining against the yen. Simultaneously, there are increasing rumors of the Bank of Japan abandoning its ultra-loose monetary policy soon.

https://forex-images.ifxdb.com/userfiles/20231129/analytics6566a5b7a7c3c.jpg

On the 4-hour chart, there are signs of a brewing convergence between the price and the Marlin oscillator. The main event of the day will be released in the evening – the U.S. GDP for the 3rd quarter. Depending on the risk sentiment, the USD/JPY pair will choose a corresponding strategy. Until then, the price may stall under the resistance at 147.17.

Analysis are provided by InstaForex.

Read More

Best regards, PR Manager / Learn more about InstaForex Company at http://instaforex.com

Re: InstaForex Analysis

XAU/USD Day I Potential bearish reversal?

https://forex-images.ifxdb.com/userfiles/20231130/analytics656803921e95c.jpg

The XAU/USD is currently positioned for a potential bearish reversal, The chart is currently encountering major resistance levels, suggesting a potential bearish reversal.

The 1st resistance at 2050.34 is identified as a multi-swing high resistance. This implies that it's a significant barrier where selling interest could intensify, potentially triggering a reversal in the XAU/USD (Gold) market.

The 2nd resistance at 2079.54 is also noted as a swing high resistance, further reinforcing the potential resistance factors for the precious metal.

On the support side,

The 1st support at 2005.70 is categorized as a pullback support. This suggests that it's a significant level where buying interest may emerge, potentially providing some support for XAU/USD.

The 2nd support at 1951.77 is another support level identified as an overlap support. This adds further significance to this support level, indicating it as a potential area where buyers might become active, potentially mitigating the bearish reversal.

Analysis are provided by InstaForex.

Read More

Best regards, PR Manager / Learn more about InstaForex Company at http://instaforex.com

Re: InstaForex Analysis

Catherine Mann: The Bank of England may still need to raise rates

Inflation in the United Kingdom remains consistently high, although it has decreased to 4.6% in the last six months. Recall that Bank of England Governor Andrew Bailey and some of his colleagues promised to reduce inflation to 5% or below by the end of this year. At the moment, we can say that they have managed to keep their promise, but inflation in Britain remains persistently high, with wages growing at 8% annually, and core inflation currently standing at 5.7%.

https://forex-images.ifxdb.com/userfiles/20231130/analytics6568c29f6cb1e.jpg

Judging by data on price and wage inflation, we can see that the BoE is currently closest to a new interest rate hike. Recently, we have repeatedly heard that the British central bank prefers to keep the rate at its current level for a period long enough to return inflation to 2%. However, such measures may not be sufficient.

BoE Monetary Policy Committee member Catherine Mann said that the prospects of maintaining the current inflation could compel the central bank to tighten monetary policy more than it is doing now. Mann stated that the current BoE policy can be considered "sufficiently restrictive" only for a very short period and exerts relatively weak pressure on price growth. According to her, many companies expect inflationary pressures to persist next year. Accordingly, the BoE may tighten its policy once again.

This is the factor that can desynchronize the pound and the euro. The European Central Bank has no grounds to raise rates after the latest inflation report. Moreover, it may move to rate cuts in the near future. If we believe Mann's words, the BoE may need another rate hike, and the probability of such a scenario is quite high. This is a supporting factor for the pound but not for the euro.

In conclusion, I expect both instruments to fall. The BoE has not given any signals of readiness to move from words to action. In the last meeting, only three members of the Committee voted for a rate hike. Therefore, the euro and the pound can safely decline for now.

Based on the analysis, I conclude that a bearish wave pattern is still being formed. The pair has reached the targets around the 1.0463 mark, and the fact that the pair has yet to breach this level indicates that the market is ready to build a corrective wave. It seems that the market has completed the formation of wave 2 or b, so in the near future I expect an impulsive descending wave 3 or c with a significant decline in the instrument. I still recommend selling with targets below the low of wave 1 or a. But be cautious with short positions, as wave 2 or b may take a more extended form. A successful attempt to break the 1.0851 level could signal a decline in the instrument.

https://forex-images.ifxdb.com/userfiles/20231130/analytics6568c2aa665ca.jpg

The wave pattern for the GBP/USD pair suggests a decline within the downtrend. The most that we can count on is a correction. At this time, I can recommend selling the instrument with targets below the 1.2068 mark because wave 2 or b will eventually end and at any time. The longer it takes, the stronger the fall. The narrowing triangle is a harbinger to the end of the movement.

Analysis are provided by InstaForex.

Read More

Best regards, PR Manager / Learn more about InstaForex Company at http://instaforex.com

Re: InstaForex Analysis

AUD/USD Update for December 04, 2023 - Berish divergence on the oscillator

Technical analysis:

https://forex-images.ifxdb.com/userfiles/20231204/analytics656d8d5fd9275.jpg

AUD/USD has been trading downside this morning and I found rejection of the previous swing high at 0.6680, which is good sign for the further downside movement.

Due to the rejection of the previous swing high and the bearish divergence on the RSI oscillator, I see potential for the further drop towards lower references.

Downside objectives are set at the price of 0.6570 and 0.6524

RSI oscillator is showing fresh bearish divergence in the background, which is sign for the downside rotation.

Key resistance is set at the price of 0.6680

Analysis are provided by InstaForex.

Read More

Best regards, PR Manager / Learn more about InstaForex Company at http://instaforex.com

Re: InstaForex Analysis

USD/CAD I Bearish Reversal?

https://forex-images.ifxdb.com/userfiles/20231205/analytics656ea9060aa53.jpg

The USD/CAD chart is showing signs of a potential bearish reversal, with significant support and resistance levels in play.

Resistance Levels:
At 1.35788, the 1st resistance level is characterized as "Pullback resistance." This level signifies a zone where selling pressure may emerge, potentially hindering upward momentum. Additionally, the 2nd resistance level at 1.35280 is identified as "An Overlap resistance," reinforcing its role as a significant resistance zone.

Support Levels:
On the support side, the 1st support level at 1.34893 is labeled as "Swing low support." This level implies a potential area where buying interest may emerge, serving as a crucial support zone. Similarly, the 2nd support level at 1.34304 is characterized as "Swing low support," reinforcing its potential to provide support to the price.

Analysis are provided by InstaForex.

Read More

Best regards, PR Manager / Learn more about InstaForex Company at http://instaforex.com

Re: InstaForex Analysis

XAU/USD H4 I Bullish Bounce?

https://forex-images.ifxdb.com/userfiles/20231206/analytics656ffb9c9becf.jpg

The XAU/USD chart suggests the potential for a bullish bounce, with significant support and resistance levels at play.

Support Levels:
At 2009.00, the 1st support is characterized as "An Overlap support." This level signifies a potential area where buying interest may emerge, potentially facilitating a bounce. Similarly, the 2nd support at 1991.00 is also identified as "An Overlap support," reinforcing its potential significance in providing support to the price.

Resistance Levels:
On the resistance side, the 1st resistance level at 2034.68 is labeled as "An Overlap resistance." This level represents a notable barrier to further upward price movement and warrants attention from traders. Additionally, the 2nd resistance at 2051.18 is characterized by "Pullback resistance," further emphasizing its role as a significant resistance zone.

Analysis are provided by InstaForex.

Read More

Best regards, PR Manager / Learn more about InstaForex Company at http://instaforex.com

Re: InstaForex Analysis

USD/JPY Day I Bearish continuation expected?

https://forex-images.ifxdb.com/userfiles/20231207/analytics65714242420d7.jpg

The USD/JPY chart is currently indicating the potential for a bearish breakout, with significant support and resistance levels at play.

Support Levels:
At 144869.00, the 1st support is characterized as "An Overlap support." This level signifies a potential area where buying interest may emerge, potentially preventing further downward movement. Additionally, the 2nd support at 141.98 is identified as "An Overlap support," further reinforcing its potential significance in providing support to the price.

Resistance Levels:
On the resistance side, the 1st resistance level at 148.28 is labeled as "An Overlap resistance." This level represents a notable barrier to further upward price movement and warrants attention from traders.

Analysis are provided by InstaForex.

Read More

Best regards, PR Manager / Learn more about InstaForex Company at http://instaforex.com

Re: InstaForex Analysis

Forecast for AUD/USD on December 8, 2023

Yesterday, the Australian dollar, with overlaps, covered the entire range of levels 0.6547-0.6612. It sharply grew when the Marlin oscillator's signal line turned from the zero line.

https://forex-images.ifxdb.com/userfiles/20231208/analytics657287c37c202.jpg

According to technical rules, the pair can rise further by surpassing the previous day's high (0.6623), but since the US will release important data today, there may be a false breakout above 0.6623.

According to technical rules, the pair can rise further by surpassing the previous day's high (0.6623), but since the US will release important data today, there may be a false breakout above 0.6623.


https://forex-images.ifxdb.com/userfiles/20231208/analytics657287cf694e3.jpg


On the 4-hour chart, the price is consolidating just before the resistance level of 0.6612. The MACD line is slightly above it, precisely at yesterday's high. Consolidating above it will signal further growth. The Marlin oscillator is already in the uptrend territory. We are waiting for the resolution of the situation with the release of the US data.


Analysis are provided byInstaForex.

Read More

Best Regards,PR Manager
InstaForex Companies Group

Re: InstaForex Analysis

Forex Analysis & Reviews: Forecast for EUR/USD on December 11, 2023

EUR/USD
Friday's U.S. labor data turned out better than expected. The result was reflected in a decrease in the unemployment rate from 3.9% to 3.7%. The balance indicator line stopped the initial downward movement in response to the news. This was evidently influenced by the risk appetite, as the S&P 500 stock index grew by 0.41%. It is very close to continuing its growth in the medium-term, and to achieve this, the quote needs to surpass the year's high of 4612 (July 27), paving the way for the pair to reach the record target of 4816 (January 2022).

https://forex-images.ifxdb.com/userfiles/20231211/analytics65767797f203c_source!.jpg

From this perspective, the euro's growth is limited to the time when the S&P 500 continues to rise. Synchronization with this timeframe gives the first serious target level of 1.1076 – the upper band of the descending price hyperchannel, coinciding with the peak on April 14 (December 21-22).

https://forex-images.ifxdb.com/userfiles/20231211/analytics657677854f985_source!.jpg

On the 4-hour chart, a double convergence has formed, which could provide the initial momentum in order for the price to rise further so it can consolidate above 1.0825. This would mean settling above the nearest embedded line of the price channel, marked on the daily chart. Subsequent consolidation above the MACD line (1.0850) would mean overcoming the Fibonacci ray on the daily chart and pave the way for the pair to reach the target level of 1.0905. Considering the upcoming Federal Reserve meeting, the euro's growth could be quite strong.

Analysis are provided by InstaForex.

Read More

Best regards, PR Manager / Learn more about InstaForex Company at http://instaforex.com

Re: InstaForex Analysis

Forex Analysis & Reviews: Forecast for EUR/USD on December 12, 2023

EUR/USD
In the previous review, we tied the rise of counter-dollar currencies to the development of risk sentiment in the broader market. Yesterday, the S&P 500 stock index surpassed the nearest peak from July 27 (4612), and now it has a good target at the level of 4818, which is a record high (January 2022). Oil has risen slightly. Yields on US government bonds have not changed for the third day in anticipation of tomorrow's Federal Reserve meeting.

https://forex-images.ifxdb.com/userfiles/20231212/analytics6577cb007a7d7_source!.jpg

On the daily chart, the price has consolidated above the level of 1.0757. The Marlin oscillator is slowly turning upward. If there are no significant events that will hinder the euro's way, the price will continue to rise towards the target level of 1.0825.

A potential bullish breakout, in continuation of the decline from November 29, will take place if the price surpasses the support of the MACD line in the area of 1.0703. The first bearish target will be 1.0632. Exchange Rates 12.12.2023 analysis

https://forex-images.ifxdb.com/userfiles/20231212/analytics6577caf70c01c_source!.jpg

On the 4-hour chart, the price is consolidating symbolically above the support of 1.0757. The signal line of the Marlin oscillator, after the previous convergence, entered the uptrend territory. Overcoming the level of 1.0825 will support the uptrend, as resistance is strengthened by the approaching MACD line.

Analysis are provided by InstaForex.

Read More

Best regards, PR Manager / Learn more about InstaForex Company at http://instaforex.com

Re: InstaForex Analysis

Forecast for EUR/USD on December 13, 2023

EUR/USD
So, yesterday's US inflation data turned out to be positive for the euro. The core CPI for November remained at the previous 4.0% YoY, while the CPI decreased from 3.2% YoY to 3.1% YoY. Such an optimistic trend of decreasing inflation could be reflected in today's dot plot projections on interest rates by FOMC members.

https://forex-images.ifxdb.com/userfiles/20231213/analytics65791d4da263e.jpg

Today, the euro may surpass yesterday's high and continue to rise.

Yesterday, the upper shadow reached the target level of 1.0825. According to the main scenario, we expect a breakout and the euro to rise towards 1.0905. The second target is 1.0946.

https://forex-images.ifxdb.com/userfiles/20231213/analytics65791d59986ca.jpg

On the 4-hour chart, the price reached the MACD indicator line and retraced slightly downwards. The price settled above the balance line indicator, and the Marlin oscillator settled in the uptrend territory. If the price consolidates above 1.0825, it will mean consolidation above the MACD line. We expect the euro to continue rising according to the main plan.

Analysis are provided by InstaForex.

Read More

Best regards, PR Manager / Learn more about InstaForex Company at http://instaforex.com

Re: InstaForex Analysis

Forex Analysis & Reviews: Forecast for AUD/USD on December 14, 2023

AUD/USD
The Australian dollar sharply strengthened after yesterday's Federal Reserve meeting – up 100 pips compared to the euro's 80-pip rise. In today's Asian session, the pair continued to rise at an even greater speed, and has already surpassed the target level of 0.6693. With that said, we now expect the uptrend to move forward towards the target levels of 0.6775 and 0.6815 (the average value of the peaks in April and May).

https://forex-images.ifxdb.com/userfiles/20231214/analytics657a70a7cfe2d_source!.jpg

A slight move of the Marlin oscillator's signal line into negative territory (red arrow) is now considered a false move, afterwards we witnessed movement into the overbought territory.

https://forex-images.ifxdb.com/userfiles/20231214/analytics657a70960c8a6_source!.jpg

On the 4-hour chart, the price is trying to consolidate above the level of 0.6693. If it successfully manages to consolidate, this would automatically support the pair's rise to 0.6775.

Analysis are provided by InstaForex.

Read More

Best regards, PR Manager / Learn more about InstaForex Company at http://instaforex.com

Re: InstaForex Analysis

Forex Analysis & Reviews: Forecast for USD/JPY on December 15, 2023

USD/JPY
The USD/JPY pair continues to support the dollar's broad weakness. Yesterday, the yen strengthened by 97 pips, and the lower shadow of the daily candle tested the target support at 141.23. During the correction, the price approached the resistance level at 142.70 by this morning.

https://forex-images.ifxdb.com/userfiles/20231215/analytics657bbb0af1f27_source!.jpg

This level is strong, so we do not believe that there is a reason for the price to overcome it. After completing the correction, a consolidation could form before the level for 1-2 days. After that, we expect a new test of support at 141.23 and further down to 140.35, coinciding with the embedded line of the price channel.

https://forex-images.ifxdb.com/userfiles/20231215/analytics657bbaf9e7a18_source!.jpg

On the 4-hour chart, the price and the Marlin oscillator formed a weak convergence. However, the oscillator quickly moved upward, so it may briefly linger at elevated values before turning downward.

Analysis are provided by InstaForex.

Read More

Best regards, PR Manager / Learn more about InstaForex Company at http://instaforex.com

Re: InstaForex Analysis

Forex Analysis & Reviews: Forecast for EUR/USD on December 18, 2023

EUR/USD
Friday's correction turned out to be quite intense and balancing on the verge of a trend change, as the price managed to overcome the strong support at 1.0905, and the Marlin oscillator returned to negative territory. Now, if the current day closes below the price channel line, below the level of 1.0905, the price could attack the lower Fibonacci ray and support at 1.0825.

https://forex-images.ifxdb.com/userfiles/20231218/analytics657faca7e4940_source!.jpg

However, the euro still has a chance to rise. In order to do so, the current daily candle should stay above the level of 1.0905, which will lead the Marlin oscillator to rise in the positive territory. Surpassing the 1.0946 mark will reopen the target of 1.1033 and then 1.1076.

On the 4-hour chart, we can see that the corrective phase was just over 38.2%. The Marlin oscillator has not left the growth territory. There is a good chance that the price will turn from these levels. The uptrend remains intact, and in order to change it, the price needs to consolidate below 1.0825 and below the MACD line.

https://forex-images.ifxdb.com/userfiles/20231218/analytics657facb5a6361_source!.jpg

Such a deep correction only occurred with the euro. The Canadian dollar strengthened on Friday, Asia-Pacific currencies spent the day in consolidation, and this morning, the New Zealand dollar continues to rise. This means that on Friday, the euro qualitatively reacted to the weak eurozone PMI data. But today, the IFO indices for Germany for December will be released, and they are expected to increase. In particular, the value is expected to rise from 89.4 to 89.5. This supports the main scenario.

Analysis are provided by InstaForex.

Read More

Best regards, PR Manager / Learn more about InstaForex Company at http://instaforex.com

Re: InstaForex Analysis

Forex Analysis & Reviews: Forecast for EUR/USD on December 19, 2023

EUR/USD
Yesterday, the euro closed with a white candle above the level of 1.0905, and the signal line of the Marlin oscillator quickly returned to the bullish territory. Although this isn't a signal that the pair will rise to the level of 1.1033, it removes the risk of a decline to 1.0825.

https://forex-images.ifxdb.com/userfiles/20231219/analytics658104603d751_source!.jpg

Perhaps the bulls still do not have enough long positions to overcome 1.0946, then we will see the price consolidating in the range of 1.0905/46. On the 4-hour chart, the price has settled above the level of 1.0905 and above the 38.2% Fibonacci correction level.

https://forex-images.ifxdb.com/userfiles/20231219/analytics6581047285cbb_source!.jpg

The Marlin oscillator is misleading the bulls, showing an intention to move below the neutral zero line. At the same time, this is a sign of an upcoming correction in the range of 1.0905/46. A consolidation below the lower band of the range will sharply increase the risks of a decline.

Analysis are provided by InstaForex.

Read More

Best regards, PR Manager / Learn more about InstaForex Company at http://instaforex.com

Re: InstaForex Analysis

Forex Analysis & Reviews: Forecast for EUR/USD on December 20, 2023

EUR/USD
The euro did not linger in the range of 1.0905/46, broke out of it and gained 57 pips on Tuesday. The signal line of the Marlin oscillator has settled in the positive territory, and the price can continue to move to the nearest target level of 1.1033 and rise to the upper band of the price channel, coinciding with the target level of 1.1076 (the peak of April 14).

https://forex-images.ifxdb.com/userfiles/20231220/analytics658257dc10a62_source!.jpg

Obviously, the pre-New Year rally is in full swing, if we count the stock market since October 30th. The Dow Jones stock index sets a new record every day. The S&P 500 is slightly behind. Yesterday, oil rose by 1.80%, and copper rose by 1.36%. The crisis, along with the euro's decline, is expected in the new year.

https://forex-images.ifxdb.com/userfiles/20231220/analytics658257ec3e587_source!.jpg

On the 4-hour chart, the price is progressing above the indicator lines, which are rising, and the Marlin oscillator has settled and is progressing in the uptrend territory. The possible correction is supported by the level of 1.0946, but overall, we expect the pair to rise to the specified target levels.

Analysis are provided byInstaForex.

Read More

Best regards, PR Manager / Learn more about InstaForex Company at http://instaforex.com

Re: InstaForex Analysis

Forex Analysis & Reviews: Forecast for EUR/USD on December 21, 2023

EUR/USD
The cause of yesterday's corrective move can be attributed to the stock market; the S&P 500 fell by 1.47%, and the dollar index rose by 0.26%. Of course, we won't interpret every black candle as the collapse of the pre-New Year rally or the beginning of a global crisis, as the decline was triggered by other factors, fueled by the cautious remarks of T. Barkin, R. Bostic, D. Goolsbee. Even representatives of the European Central Bank, K. Knot, M. Kazaks, J. Nagel, have leaned towards the "soft" side.

Today, the U.S. will release data on GDP for the 3rd quarter, and tomorrow, data on durable goods orders and consumer spending are expected to come out as positive. US markets open on Tuesday, and there are no clear reasons for mass closure of long positions even before the new year.

https://forex-images.ifxdb.com/userfiles/20231221/analytics6583ab041e032_source!.jpg

On the daily chart, the price tested support at 1.0946, and this morning, the pair is gradually rising. The signal line of the Marlin oscillator is developing in a miniature triangle, a sign of an impending upward movement. The targets remain the same: 1.1033, 1.1076.

https://forex-images.ifxdb.com/userfiles/20231221/analytics6583aaf8de250_source!.jpg

On the four-hour chart, the price is staying above both indicator lines, and there has been no consolidation below the support. Marlin has entered negative territory, which may slightly slow down the euro's recovery, possibly for the structure of the Marlin triangle on the daily chart.

Analysis are provided by InstaForex.

Read More

Best regards, PR Manager / Learn more about InstaForex Company at http://instaforex.com

Re: InstaForex Analysis

Forex Analysis & Reviews: Forecast for AUD/USD on December 22, 2023

AUD/USD
Yesterday, the Australian dollar gained 71 pips and approached the target level of 0.6815, and the upper band of the local price channel.

https://forex-images.ifxdb.com/userfiles/20231222/analytics6584f9e572add_source!.jpg

The Marlin oscillator has been behaving nervously recently, but a break above 0.6830 opens the way for further growth with the initial target of 0.6897 - towards the peak of July 13 with an intermediate level of 0.6872.

https://forex-images.ifxdb.com/userfiles/20231222/analytics6584f9d728262_source!.jpg

On the 4-hour chart, the price has settled above the balance and MACD indicator lines, and the Marlin oscillator has stabilized in the uptrend territory. We are waiting for progress on this growth.

Analysis are provided by InstaForex.

Read More

Best regards, PR Manager / Learn more about InstaForex Company at http://instaforex.com

Re: InstaForex Analysis

Analysis of Gold for December 25, 2023 - Potential for the downside movement

https://forex-images.ifxdb.com/userfiles/20231225/analytics658941ff3959a.jpg

Technical analysis:

Gold has been trading downside in the background but I found that supply overcame demand, which is good sign for the further downside movement.

Due to the rejection of the resistance level in the background and supply present, I see potential for the further drop towards lower references.
Downside objectives are set at $2.032 and $2.017

RSI oscillator is showing downside rotation toward 50 level, which is sign od indecision and the breakout of the rising lows.

Key resistance is set at $1.270

Analysis are provided by InstaForex.

Read More

Best regards, PR Manager / Learn more about InstaForex Company at http://instaforex.com

Re: InstaForex Analysis

Forex Analysis & Reviews: Forecast for EUR/USD on December 26, 2023

EUR/USD
So far, the euro has reached the first bullish target at 1.1033. Now, the target is 1.1076 (the peak of April 14) at the intersection with the upper band of the price channel. Surpassing this level will open up the target of 1.1150 (the July 27 high). But first, the price needs to consolidate above 1.1033.

https://forex-images.ifxdb.com/userfiles/20231226/analytics658a420fb3c90_source!.jpg

Today, the United States will release housing price data. The October estimate suggests a growth of 0.5%, and the composite S&P/CS-20 index, excluding seasonal fluctuations, is expected to rise to 5.0% YoY from the previous 3.9% YoY. Such data may hinder the euro's growth. On the other hand, in thin markets, movements can be unpredictable depending on the goals of major players, and these goals were bullish just a week ago.

On the daily chart, the signal line of the Marlin oscillator has turned away from the upper band of the wedge, creating a risk of a pullback to the lower band of the wedge and an upward breakout of the line. Based on this scenario, the price may spend the entire day below the resistance of 1.1033 and only resume its upward movement tomorrow.

https://forex-images.ifxdb.com/userfiles/20231226/analytics658a4206427b9_source!.jpg

On the four-hour chart, the price is starting to consolidate before the reached level, and the Marlin oscillator has settled in the positive territory. Price development is occurring above the balance and MACD indicator lines. An uptrend in place.

Analysis are provided by InstaForex.

Read More

Best regards, PR Manager / Learn more about InstaForex Company at http://instaforex.com

Re: InstaForex Analysis

Forex Analysis & Reviews: Forecast for EUR/USD on December 27, 2023

EUR/USD
The pre-New Year rally continues; S&P 500 up 0.42%, the euro up by 28 points, oil up by 1.99%, and gold up by 0.52%. The euro has surpassed the target resistance at 1.1033, and today, it opened above this level. Now the pair has one final leap to move towards 1.1076, where we might see profit-taking for the entire pre-New Year movement.

https://forex-images.ifxdb.com/userfiles/20231227/analytics658b9c4bb0ee7_source!.jpg

There is also room for growth in the stock market; the S&P 500 index is 0.9% away from the record high, and 2.28% away from the 4883 target along the price channel line (see the review from December 25).

On the 4-hour chart, the price has managed to consolidate above 1.1033.

https://forex-images.ifxdb.com/userfiles/20231227/analytics658b9c63a213d_source!.jpg

Although the Marlin oscillator is in the positive territory, it feels weak, formally consolidating above the zero line. A delay in the price's growth may push the oscillator to move into negative territory. The least we can do for today is to close the day above yesterday's closing price.

Analysis are provided by InstaForex.

Read More

Best regards, PR Manager / Learn more about InstaForex Company at http://instaforex.com

Re: InstaForex Analysis

Forex Analysis & Reviews: Technical Analysis of Intraday Price Movement of Gold Commodity Asset, Thursday December 28, 2023

https://forex-images.ifxdb.com/userfiles/20231228/analytics658ce1db99131_source!.jpg

Although currently Gold commodity assest still look strengthening where this is confirmed by the price movement which is above its Moving Average, but with the appearance of the Rising Wedge pattern and the deviation between price movement with Awesome Oscillator indicator, then in the near future, although gold will try to reach the level area of 2093.24-2107.79 but there is a potential for gold to fall down to its weakening up to the level of 2004.27, but this weakness potential will become invalid if the strengthen of gold still continue until it breaks above the level 2143.74.

Analysis are provided by InstaForex.

Read More

Best regards, PR Manager / Learn more about InstaForex Company at http://instaforex.com

Posts: 1,476 to 1,500 of 1,547

Pages Previous 1 58 59 60 61 62 Next

You must login or register to post a reply

Forex Software → Market Analysis → InstaForex Analysis

Similar topics in this forum