forex software

Create and Test Forex Strategies

forex software

Skip to forum content

Forex Software

Create and Test Forex Strategies

You are not logged in. Please login or register.


(Page 56 of 62)

Forex Software → Market Analysis → InstaForex Analysis

Pages Previous 1 54 55 56 57 58 62 Next

You must login or register to post a reply

RSS topic feed

Posts: 1,376 to 1,400 of 1,547

Re: InstaForex Analysis

Technical Analysis of EUR/USD for July 11, 2023

Technical Market Outlook:
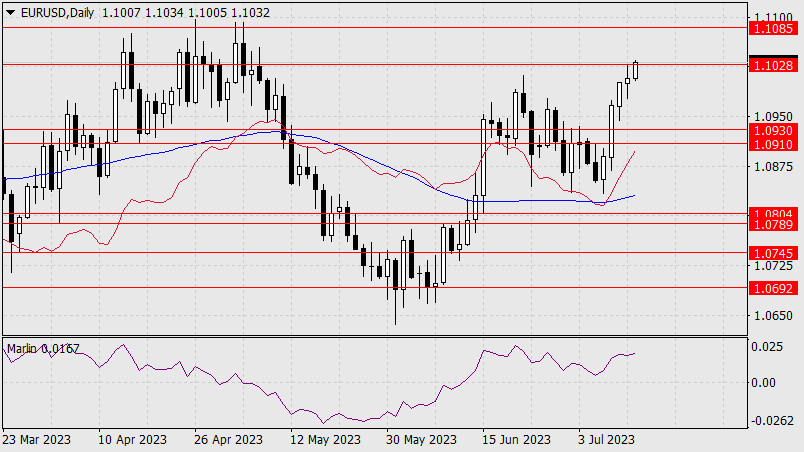
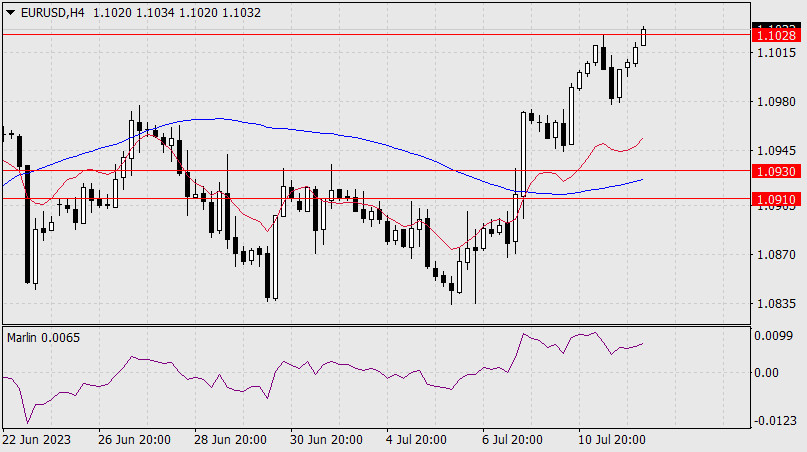
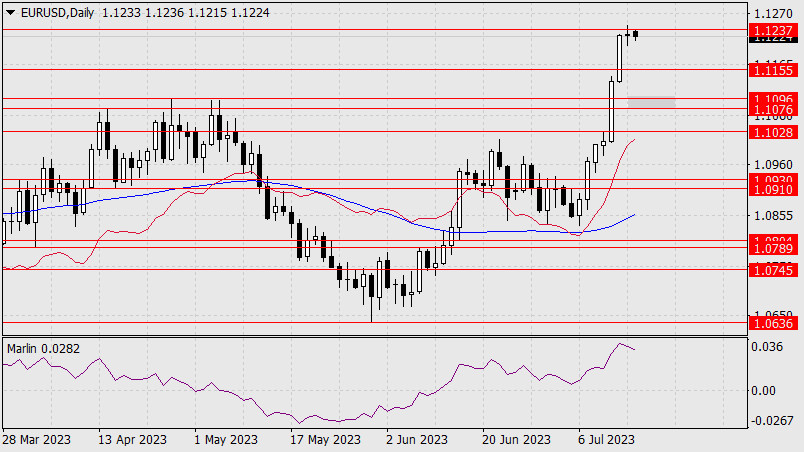
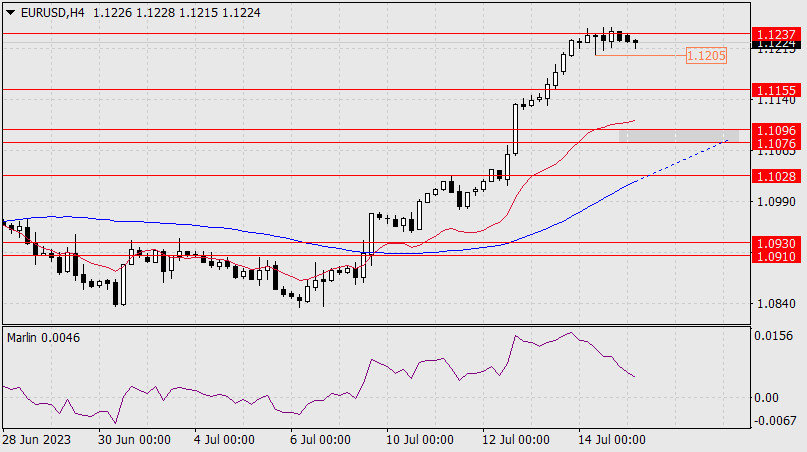
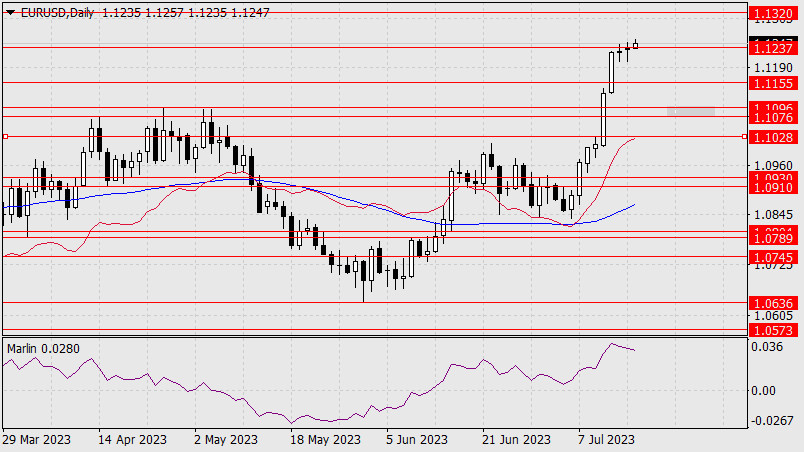
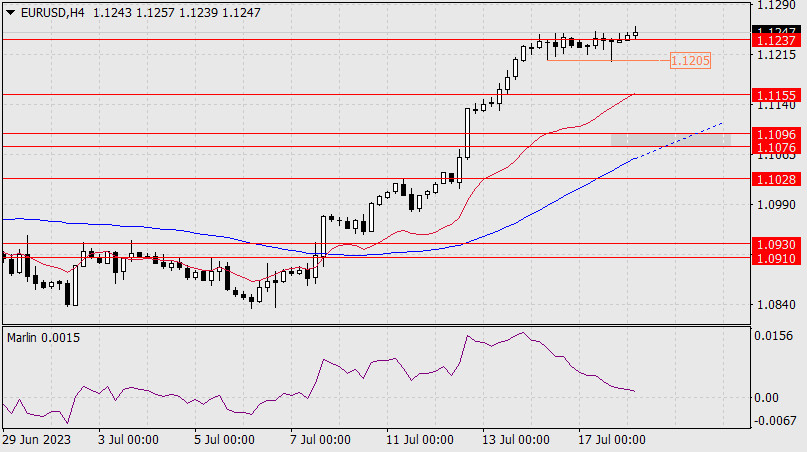
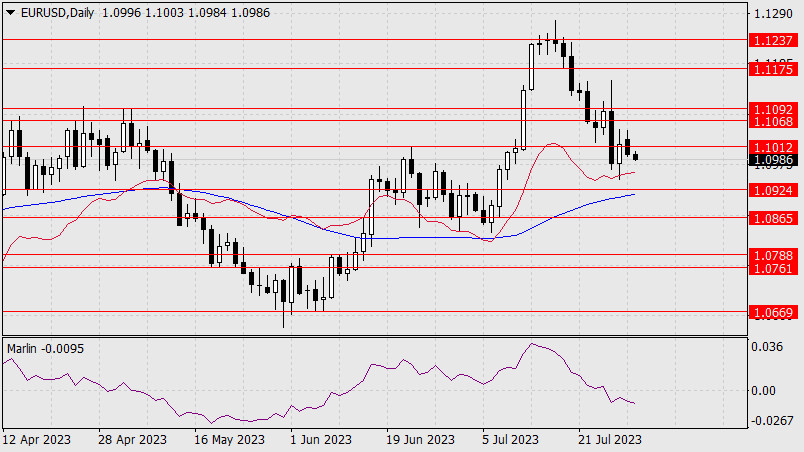
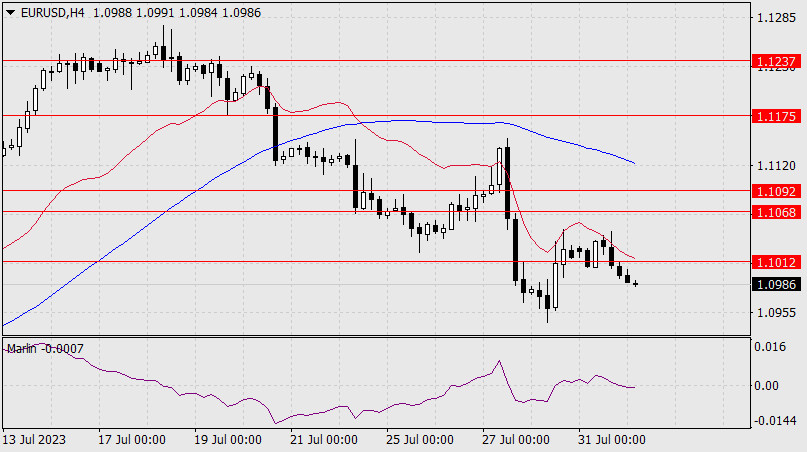
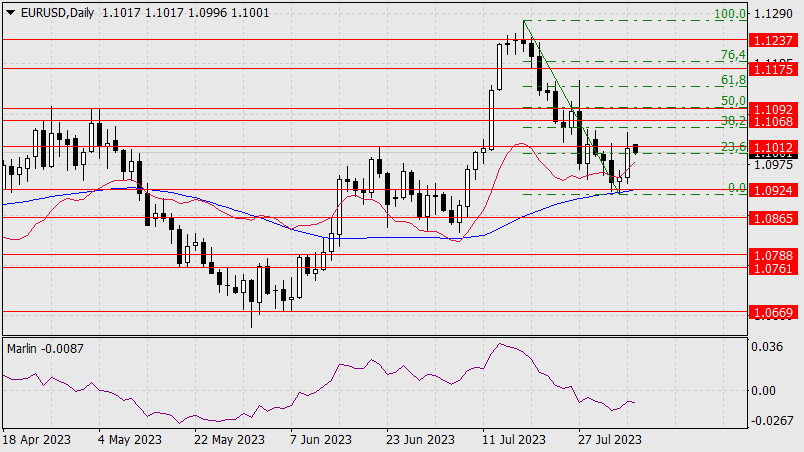
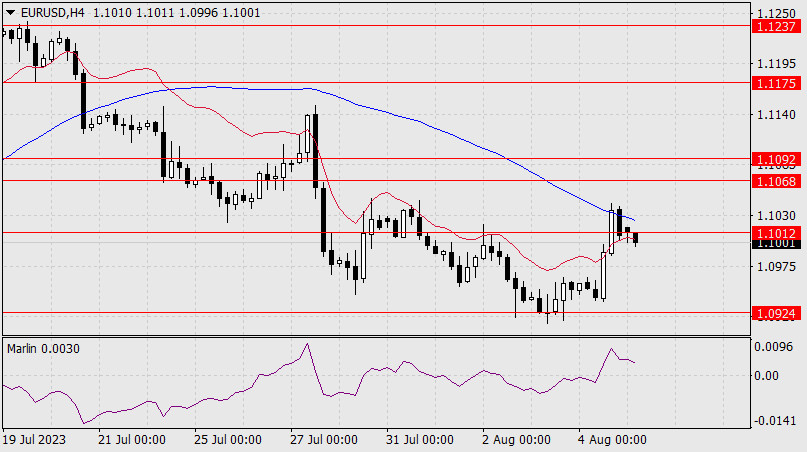
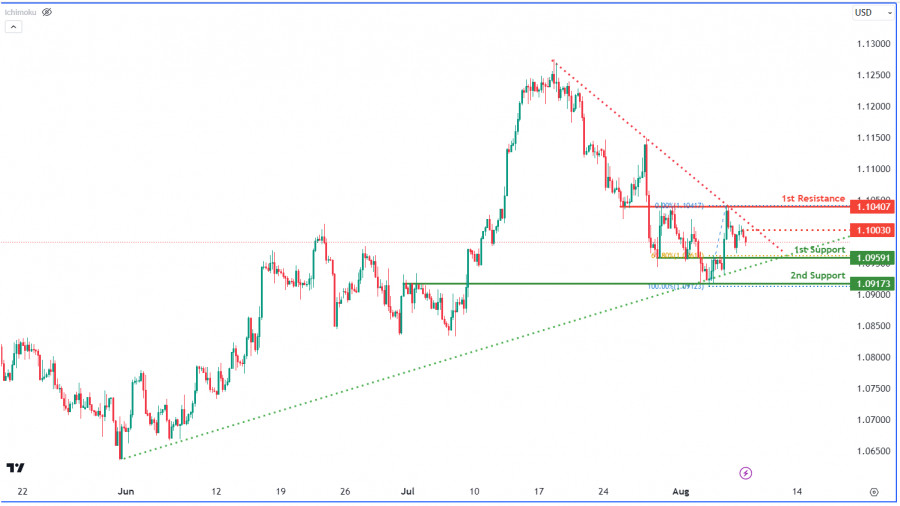
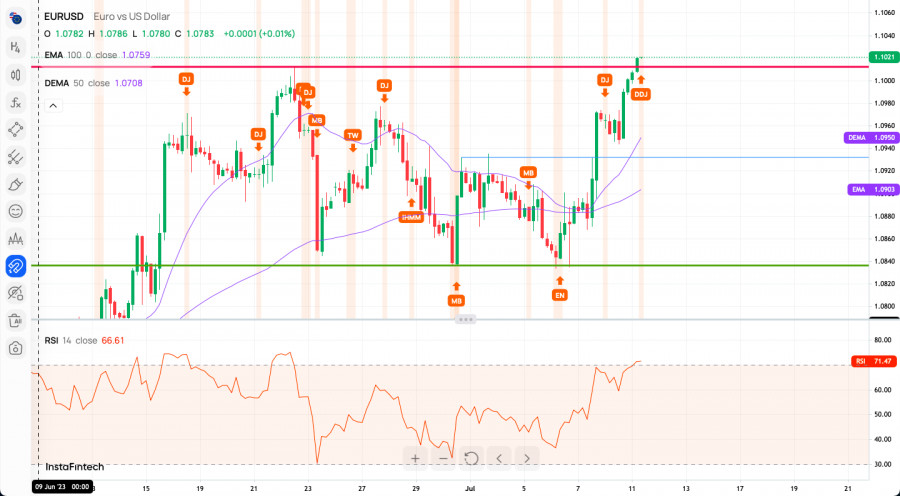
The EUR/USD pair has broken above the intraday technical resistance seen at the level of 1.0974 and made a new swing high at the level of 1.1023 (at the time of writing the analysis). The intraday technical support is seen at the level of 1.0974. Please notice, the momentum has hit the extremely overbought conditions again, so there is a confirmation of the bearish pressure on the lower time frame charts. In a case of a breakout lower, the next target for bears is seen at the level of 1.0901 and 1.0876. Only a sustained breakout below the moving average dynamic support around 1.0900 would change the outlook to more negative.

https://forex-images.ifxdb.com/userfiles/20230711/analytics64ace907ce8e1.jpg

Weekly Pivot Points:
WR3 - 1.09927
WR2 - 1.09761
WR1 - 1.09665
Weekly Pivot - 1.09595
WS1 - 1.09499
WS2 - 1.09429
WS3 - 1.09263

Trading Outlook:
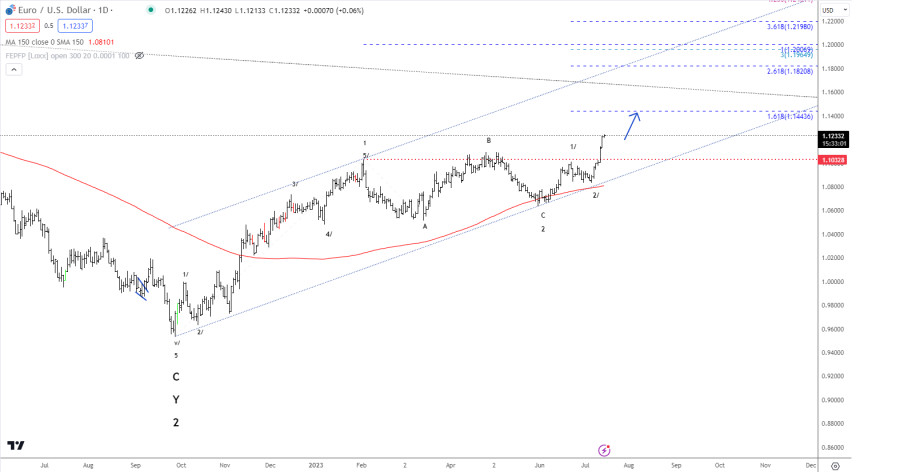
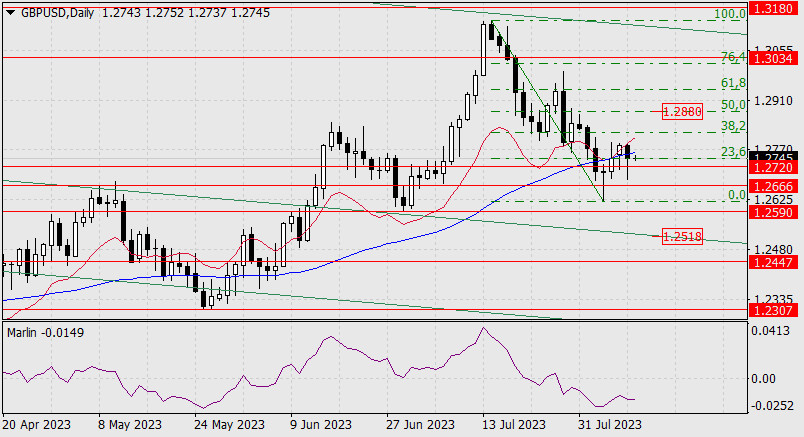
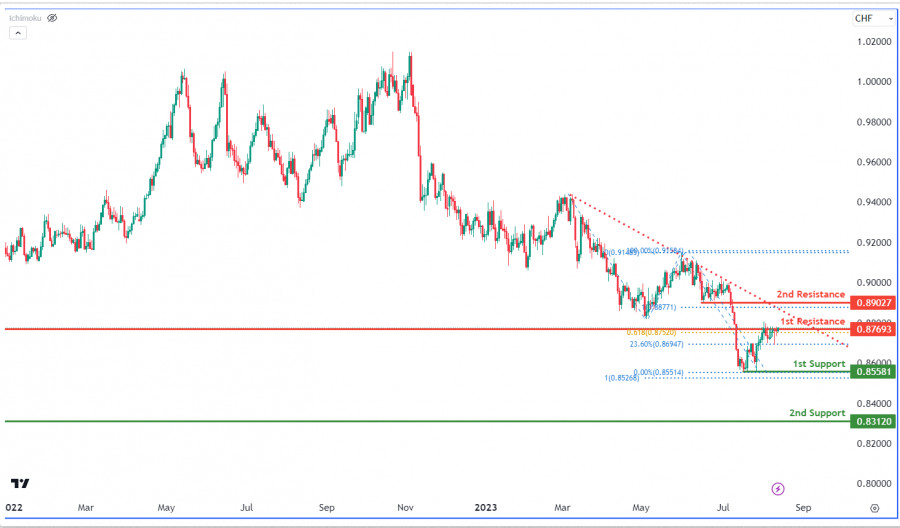
Since the beginning of October 2022 the EUR/USD is in the corrective cycle to the upside, but the main, long-term trend remains bearish. This corrective cycle might had been terminated at the level of 1.2080 which is 61% Fibonacci retracement level. The EUR had made a new multi-decade low at the level of 0.9538, so as long as the USD is being bought all across the board, the down trend will continue towards the new lows.

Analysis are provided by InstaForex.

Read More

Best regards, PR Manager / Learn more about InstaForex Company at http://instaforex.com

Re: InstaForex Analysis

Forecast for EUR/USD on July 12, 2023

EUR/USD
The euro has reached the target resistance of 1.1028. The pair has crossed the peak of June 22, and along with it, the primary conditions for forming divergence with the Marlin oscillator have been prepared. If a divergence is formed, it will mean the end of the entire corrective growth since May 31. If the price consolidates above 1.1028, it could extend this correction to 1.1085, that is, to its limit as a correction. But if the pair surpasses this level, it will mean the continuation of the entire uptrend from September 25, 2022. However, this growth also has a small chance of a build-up, its first resistance level is 1.1155.

https://forex-images.ifxdb.com/userfiles/20230712/analytics64ae12eb885a9.jpg

oday, the June CPI data will be published in the United States. The total CPI is forecasted to fall from 4.0% y/y to 3.1% y/y, and the core CPI is expected to decrease from 5.3% y/y to 5.0% y/y. As the previous rise from July 6 was purely speculative, the market reaction to the data could even be against the data. This means that if the current market logic implies a softening of the Federal Reserve's policy in connection with forecasts for today's data, then the actual reaction could be the opposite (falling euro), as a cumulative view on the deterioration of the European economy and the resilience of the American one. It is also notable that the market ignored yesterday's drop in the European ZEW Economic Sentiment Index for July from -10.0 to -12.2.

https://forex-images.ifxdb.com/userfiles/20230712/analytics64ae12dbeae1a.jpg

On the four-hour chart, the Marlin oscillator is developing sideways movement in its own range. This is a sign of increasing potential for a downward movement. All we have to do is wait for the US inflation report and look at the market reaction.

Analysis are provided by InstaForex.

Read More

Best regards, PR Manager / Learn more about InstaForex Company at http://instaforex.com

Re: InstaForex Analysis

Forecast for EUR/USD on July 13, 2023

EUR/USD
Yesterday's US inflation data came out better than forecasts; the core CPI for June fell from 5.3% YoY to 4.8% YoY, the overall CPI fell by 1.0% - from 4.0% YoY to 3.0% YoY. The euro surpassed the April peak and closely approached the target level of 1.1155. Now the price has revived the uptrend from September 25, 2022. After overcoming 1.1155, the next target will be 1.1222 (the support level from December 7-15, 2022).

https://forex-images.ifxdb.com/userfiles/20230713/analytics64af63f1686c2.jpg

The pair may not surpass the 1.1155 mark today, but after a slight pullback to the nearest support level of 1.1085. The reason may be the slowdown in the growth rate of industrial production in the eurozone - the forecast for May is -1.1% YoY against 0.2% YoY in April.

https://forex-images.ifxdb.com/userfiles/20230713/analytics64af63e7397a8.jpg

On the four-hour chart, the signal line of the Marlin oscillator has left the consolidation and moved upwards, and immediately into the overbought territory. This is also a sign of an impending pullback before the price rises further.

Analysis are provided by InstaForex.

Read More

Best regards, PR Manager / Learn more about InstaForex Company at http://instaforex.com

Re: InstaForex Analysis

Elliott wave analysis of EUR/USD for July 14, 2023

https://forex-images.ifxdb.com/userfiles/20230714/analytics64b0de52c6765.jpg

EUR/USD continues to rally higher towards the next upside target at 1.1444. In the longer term, we are looking for EUR/USD to move closer to the 1.2007 target as a minimum.

Short-term support is seen near 1.1130 with solid support placed at 1.1033, which previously acted as resistance, but now, has shifted character to support after the clear break on Wednesday. In the short term, we could see the pace of the rally settle down, but the bias will remain towards the upside.

Analysis are provided by InstaForex.

Read More

Best regards, PR Manager / Learn more about InstaForex Company at http://instaforex.com

Re: InstaForex Analysis

Forecast for EUR/USD on July 17, 2023

EUR/USD
Last Friday, as well as in today's Asian session, the euro started to show signs of reversal from the resistance level at 1.1237. We can confirm this when the price falls below Friday's low at 1.1205. This would allow it to continue falling towards the first support level at 1.1155.

https://forex-images.ifxdb.com/userfiles/20230717/analytics64b4af95070f9.jpg

Further, we might witness a breakthrough below this mark and test the 1.1076/96 range. Consolidating below this target range would serve as a strong signal for a reversal. However, this would need to be confirmed as well. The signal line of the Marlin oscillator is turning downwards, indicating a high probability of the price decline, at least as a correction towards 1.1155.

https://forex-images.ifxdb.com/userfiles/20230717/analytics64b4af7b3457d.jpg

On the 4-hour chart, the Marlin oscillator is swiftly approaching the boundary of the bearish territory, indicating the price's intention to test 1.1155. The MACD line is heading towards the target range at 1.1076/96, strengthening it and increasing its strategic significance.

Analysis are provided by InstaForex.

Read More

Best regards, PR Manager / Learn more about InstaForex Company at http://instaforex.com

Re: InstaForex Analysis

Forecast for EUR/USD on July 18, 2023

EUR/USD:
The euro closed Monday's session at the opening level below the resistance at 1.1237. This morning, the price rose higher than yesterday's high and formally opened the target at 1.1320.

https://forex-images.ifxdb.com/userfiles/20230718/analytics64b5f94660315.jpg

Speculative growth of the euro continues, but it will eventually come to an end, maybe today, as the US will release its retail sales report for June, with an optimistic forecast of 0.5% compared to 0.3% in May. The Marlin oscillator does not react to the price increase; it continues to fall. The upward movement may turn out to be deceptive.

https://forex-images.ifxdb.com/userfiles/20230718/analytics64b5f955108d0.jpg

On the four-hour chart, Marlin also does not respond to the recent price growth. Yesterday, the pair failed to break through the key level of 1.1205; it retains its role today as well. Overcoming this level will open the next target at 1.1155. Breaking below 1.1155 opens up the key range of 1.1076/96.

Analysis are provided by InstaForex.

Read More

Best regards, PR Manager / Learn more about InstaForex Company at http://instaforex.com

Re: InstaForex Analysis

Forecast for EUR/USD on July 19, 2023

EUR/USD
Yesterday's US economic data did not push the dollar higher. Retail sales for June showed a 0.2% increase, while industrial production declined by 0.5%. The dollar was also hindered by surveys conducted among 109 economists, the majority of whom considered the July rate hike by the Federal Reserve as the last in the tightening cycle.

Today, the EU will release its inflation data, with a forecast of 5.5% YoY compared to 6.1% YoY in May. Good data may have an impact on European monetary policymakers. However, on the daily chart, the euro is consolidating below the resistance level of 1.1237, which, together with yesterday's attempt at growth, keeps the bulls' interest towards aiming for the 1.1320 level. The Marlin oscillator is steadily falling, which supports the notion of a downward movement.

https://forex-images.ifxdb.com/userfiles/20230719/analytics64b74d3d0bc13.jpg

On the four-hour chart, the price is currently between the signal level of 1.1205 and the resistance level of 1.1237. Breaking through the signal level will allow the price to fall towards the target support level of 1.1155. The Marlin oscillator has moved into a downtrend territory, indicating the potential for short-term downward movement. The delay in the euro's fall has led to the MACD indicator line surpassing the target range of 1.1076/96 and heading towards 1.1155. This means that the focus is shifting from the support range to a higher level, from which it may reverse to the upside. Therefore, 1.1155 serves as a reference for the corrective decline.

Analysis are provided by InstaForex.

Read More

Best regards, PR Manager / Learn more about InstaForex Company at http://instaforex.com

Re: InstaForex Analysis

Technical Analysis of Intraday Price Movement of EUR/USD Main Currency Pairs, Thursday, July 20 2023

https://forex-images.ifxdb.com/userfiles/20230720/analytics64b89a45ca6ca.jpg

If we look on its 4 hour chart, EUR/USD main currency pairs seems like Buyers still dominates where this things confirmed by EMA 12 & 26 which is still intersecting Golden Cross as well as indicator CCI which manages to break above its three levels and hold on to the level 0 which indicates that there is significant support based on these facts, in the near future Fiber has the potential to rally up to test the 1.1253 level. If this level is successfully broken up, then the 1.1276 level will be the main target to aim for and the 1.1329-1.1376 area level will be the next target to go for. However, all of these strengthening scenarios will cancel itself out if on the way the EUR/USD rally goes up towards the target levels, it is suddenly corrected downwards and breaks below the 1.1134 level because if this level is successfully broken down then all strengthening rally scenarios previously described will become invalid and cancel automatically.

Analysis are provided by InstaForex.

Read More

Best regards, PR Manager / Learn more about InstaForex Company at http://instaforex.com

Re: InstaForex Analysis

NZDUSD, H4 | Bounce off support level?

https://forex-images.ifxdb.com/userfiles/20230721/analytics64ba0ae08f7fd.jpg

The NZD/USD pair is in a bearish trend, breaking below an ascending support line and suggesting a potential continuation of the downward movement. The first support at 0.6189, aligned with the 61.8% Fibonacci retracement, could act as a price floor. If the price drops further, the second support at 0.6114, aligned with the 78.6% Fibonacci retracement, may provide strong resistance.

On the other hand, if the bearish momentum reverses, the price could face resistance at 0.6246, followed by a higher obstacle at 0.6305. These resistance levels have the potential to hinder the price's upward progress.

Analysis are provided by InstaForex.

Read More

Best regards, PR Manager / Learn more about InstaForex Company at http://instaforex.com

Re: InstaForex Analysis

Forecast for GBP/USD on July 24, 2023

GBP/USD:
On Friday, the British pound traded in a 43-pip range, slightly decreasing by the end of the day. The Marlin oscillator has entered the downward territory, strengthening the pound's potential to test the support level at 1.2666-1.2720.

https://forex-images.ifxdb.com/userfiles/20230724/analytics64bde4fb89335.jpg

The MACD line has become significant within the mentioned range. The price will likely fall after breaking below Friday's low at 1.2815. On the four-hour chart, we can see that the price tested the nearest correction level at 1.2903 with the upper shadow on Friday. The price and oscillator convergence is gradually waning.

https://forex-images.ifxdb.com/userfiles/20230724/analytics64bde5098c99f.jpg

If today's UK business activity gauge shows that the Manufacturing PMI is slowing down as expected, while the US Manufacturing PMI is getting stronger (forecast of 46.4 versus 46.3 in May), then the pound will likely fall towards the upper band of the target range at 1.2720.

Analysis are provided by InstaForex.

Read More

Best regards, PR Manager / Learn more about InstaForex Company at http://instaforex.com

Re: InstaForex Analysis

Forex Analysis & Reviews: Forecast for AUD/USD on July 25, 2023

AUD/USD: The Australian Dollar, unlike other currencies, clearly indicates a potential decline in the US Dollar after the Federal Reserve's rate hike tomorrow. The signs include a price reversal at the approaching signal line of 0.6708 and a false break of the Marlin oscillator's signal line below the zero line.

https://forex-images.ifxdb.com/userfiles/20230725/analytics64bf3642b4f8d_source!.jpg

Currently, the Marlin oscillator is in positive territory. If the price breaks above the target range of 0.6783/98, there is potential for further growth towards the target level of 0.6940. On the other hand, if the price breaks below the signal level of 0.6708, it may aim to test the MACD line around 0.6643 with a perspective of declining to 0.6560.

https://forex-images.ifxdb.com/userfiles/20230725/analytics64bf367051421_source!.jpg

On the four-hour chart, the Marlin oscillator has moved into the upward territory, and the price shows an intention to enter the target range of 0.6783/98, which would also mean breaking above the MACD line. The FX market awaits the outcome of tomorrow's Fed meeting.

Analysis are provided by InstaForex.

Read More

Best regards, PR Manager / Learn more about InstaForex Company at http://instaforex.com

Re: InstaForex Analysis

NZDUSD, H4 | React off Resistance level?

https://forex-images.ifxdb.com/userfiles/20230726/analytics64c09949a874d.jpg

The NZD/USD chart is currently trending bearish, with the price within a bearish Ichimoku cloud and below a major descending trend line, indicating potential further decline. The 1st support at 0.6166, a multi-swing low, and the 2nd at 0.6128, an overlap support and the 78.60% Fibonacci retracement, could halt the bearish run. Resistance levels are at 0.6221 and 0.6272, acting as overlap and pullback resistances respectively, potentially sparking selling pressure.

Analysis are provided by InstaForex.

Read More

Best regards, PR Manager / Learn more about InstaForex Company at http://instaforex.com

Re: InstaForex Analysis

XAUUSD, H4 | React off Resistance level?

https://forex-images.ifxdb.com/userfiles/20230727/analytics64c2013cc2326.jpg

XAU/USD exhibits a bullish momentum, potentially continuing towards the first resistance at 1985.73. The first support at 1967.08 is significant as an overlap support. The second support at 1953.30 is an overlap support, positioned at both the 38.20% Fibonacci retracement level and the 38.20% Fibonacci retracement level, indicating a Fibonacci confluence. Regarding resistance levels, the second resistance at 2006.41 is notable as a pullback resistance. An intermediate resistance at 1979.00 is recognized as a pullback resistance, positioned at both the 78.60% Fibonacci retracement level and the 61.80% Fibonacci projection level, indicating a Fibonacci confluence.

Analysis are provided by InstaForex.

Read More

Best regards, PR Manager / Learn more about InstaForex Company at http://instaforex.com

Re: InstaForex Analysis

XAUUSD, H4 | React off Resistance level?

https://forex-images.ifxdb.com/userfiles/20230728/analytics64c34cd203018.jpg

The XAU/USD pair is showing a bearish trend, potentially leading to a price drop from the 1st resistance level towards the 1st support at 1938.31, significant due to its pullback support and 50% Fibonacci retracement alignment. If the price breaches this level, the 2nd support at 1928.59, an overlap support and the 61.80% Fibonacci retracement level, is notable. Resistance levels are at 1954.07 (pullback) and 1968.24 (pullback), both likely hindrances for upward price movement.

Analysis are provided by InstaForex.

Read More

Best regards, PR Manager / Learn more about InstaForex Company at http://instaforex.com

Re: InstaForex Analysis

Forex Analysis & Reviews: Forecast for AUD/USD on July 31, 2023

AUD/USD
With a strong movement on Friday, the pair broke below the support of the MACD line on the daily scale. Although the Marlin oscillator slipped into negative territory, it reversed slightly, indicating a potential moderate correction in the pair. Nevertheless, if the quote surpasses Friday's low today, it will again break below the MACD line, sliding towards the level of 0.6560.

https://forex-images.ifxdb.com/userfiles/20230731/analytics64c72095e98b4_source!.jpg

A correction can be seen on the four-hour chart, with the pair trading between 0.6625 and 0.6718. The situation will remain uncertain until it exits this range.

https://forex-images.ifxdb.com/userfiles/20230731/analytics64c720a4414be_source!.jpg

Alternatively, the pair could break above the upper boundary of the mentioned range and continue the correction towards the target range of 0.6783/98. The attempt of the Marlin oscillator to return to the positive territory will indicate the high probability of such a development.

Analysis are provided by InstaForex.

Read More

Best regards, PR Manager / Learn more about InstaForex Company at http://instaforex.com

Re: InstaForex Analysis

Forecast for EUR/USD on August 1, 2023

EUR/USD
Euro failed to approach the target range of 1.1068/92 yesterday, in part due to the large distance to cover and the technical resistance on lower timeframes. Key economic reports also came out rather weak, with Germany's retail sales for June showing a decrease of 0.8%. Meanwhile, the Chicago Business Activity Index for July increased from 41.5 to 42.8, collectively offsetting the eurozone's GDP growth for the 2nd quarter by 0.6% y/y (0.30% q/q).

https://forex-images.ifxdb.com/userfiles/20230801/analytics64c86c84db0a0.jpg

The political factor also intervened, as China decided to reduce the export of unmanned aerial vehicles to the US, citing national security reasons. Furthermore, the forecasts for key economic indicators in the US came out optimistic.

Currently, the price approaches the target level of 1.0924, along which the MACD line also converges. There may be a breakout around the speculative buying range of July 6-7, or a correction from the entire decline since July 18.

https://forex-images.ifxdb.com/userfiles/20230801/analytics64c86c94d8955.jpg

On the four-hour timeframe, the balance indicator line capped yesterday's growth, pushing the price below 1.1012. The Marlin oscillator also fell under zero, showing a downward trend.

Analysis are provided by InstaForex.

Read More

Best regards, PR Manager / Learn more about InstaForex Company at http://instaforex.com

Re: InstaForex Analysis

Forecast for GBP/USD on August 2, 2023

GBP/USD Pound's decline slowed, which led to the MACD line rising above the target level of 1.2720. The balance line also turned upwards.

https://forex-images.ifxdb.com/userfiles/20230802/analytics64c9bba88a332.jpg

If sellers remain inactive today or tomorrow, a correction may occur to one of the Fibonacci levels: 1.2893, 1.2940, 1.2988.

So, for further decline to develop, the pair needs to overcome not only yesterday's low, which coincides with the MACD line, but also the target level of 1.2720.

https://forex-images.ifxdb.com/userfiles/20230802/analytics64c9bb9ab9376.jpg

On the four-hour chart, the pair trades below the balance line. The Marlin oscillator slipped into negative territory, while the MACD line gave another landmark for an upward correction - 1.2900.

Not far from this lies the 38.2% retracement level - 1.2893.

Despite the bearish trend, the pair has all the opportunities to rise above 1.2720.

Analysis are provided by InstaForex.

Read More

Best regards, PR Manager / Learn more about InstaForex Company at http://instaforex.com

Re: InstaForex Analysis

NZD/USD, H4 | Will the Kiwi finally find support?

https://forex-images.ifxdb.com/userfiles/20230803/analytics64cb3784b7391.jpg

The NZD/USD pair is displaying a bearish trend, suggesting a potential fall towards the first support at 0.6065 which is an overlap support that aligns close to the -27.20% Fibonacci expansion level. If price continues to fall further, the second support level is at 0.5994 which is swing-low support. To the upside, the first resistance at 0.6132 is an overlap resistance while the second resistance at 0.6221 is a swing-high resistance.

Analysis are provided by InstaForex.

Read More

Best regards, PR Manager / Learn more about InstaForex Company at http://instaforex.com

Re: InstaForex Analysis

USDCAD, H4 | Potential falling to 1st support?

https://forex-images.ifxdb.com/userfiles/20230804/analytics64cc7a5cef754.jpg

The USD/CAD pair is exhibiting a bearish trend, suggesting potential movement towards the 1st support level at 1.3270, a key point due to its status as a pullback support and the 50% Fibonacci retracement level. If broken, the 2nd support at 1.3253, a multi-swing low support, could act as a floor. If the trend reverses and the price rises, the 1st resistance level at 1.3377, a swing high resistance, could pose a challenge. A breakthrough here might face the 2nd resistance at 1.3447, an overlap resistance that could hamper bullish momentum.

Analysis are provided by InstaForex.

Read More

Best regards, PR Manager / Learn more about InstaForex Company at http://instaforex.com

Re: InstaForex Analysis

Forecast for EUR/USD on August 7, 2023

EUR/USD:
Friday's US employment data for July came out positive. Nonfarm payrolls increased 187,000 in July, average hourly earnings rose 0.4%, and the unemployment rate declined from 3.6% to 3.5%, even after June's increase of 209,000 got revised lower to 185,000 while the labor force participation rate remained unchanged at 62.6%.

https://forex-images.ifxdb.com/userfiles/20230807/analytics64d05955e3766.jpg

The price closed the day with a 58-pip gain, failing to reach both the target level of 1.1068 or the Fibonacci correction level of 38.2%. Trading volume was high, so the euro may develop upward movement. The signal line of the Marlin oscillator has turned upwards, and the border of the bullish territory is nearby.

https://forex-images.ifxdb.com/userfiles/20230807/analytics64d05949c3df0.jpg

On the four-hour chart, the upward movement ended at the MACD line, afterwards the price returned below the resistance level of 1.1012. The Marlin oscillator is in the positive territory, indicating that the euro is likely to take a breather before it grows further.

Analysis are provided by InstaForex.

Read More

Best regards, PR Manager / Learn more about InstaForex Company at http://instaforex.com

Re: InstaForex Analysis

EURUSD, H4 | Overall Neutral Momentum?

https://forex-images.ifxdb.com/userfiles/20230808/analytics64d1c22d8b7c9.jpg

The EUR/USD chart currently shows a neutral overall momentum, lacking a clear directional trend. The price of the currency pair has the potential to fluctuate between the 1st resistance and the 1st support level. The 1st support level at 1.0959 is considered a pullback support, offering a buying opportunity during market retracements, and it gains significance from its alignment with a 61.80% Fibonacci retracement level.

Additionally, the 2nd support level at 1.0917, identified as an overlap support, may also attract buyers' interest and provide further support during price declines. Conversely, the 1st resistance at 1.1040 acts as an overlap resistance, coinciding with a 50% Fibonacci retracement level, potentially limiting upward movement and attracting selling pressure. An intermediate resistance level at 1.1003 adds to the potential resistance points in the price movement. Moreover, the observed chart pattern is a symmetrical triangle, indicating consolidation before a possible breakout or breakdown. A break above the upper trendline suggests a bullish breakout, while a break below the lower trendline indicates a bearish breakdown.

Analysis are provided by InstaForex.

Read More

Best regards, PR Manager / Learn more about InstaForex Company at http://instaforex.com

Re: InstaForex Analysis

Forecast for GBP/USD on August 9, 2023

GBP/USD Over the past two days, we observed that the British pound falsely settled above the MACD indicator line (and above the 23.6% Fibonacci level) on Monday. Then it made a false breakout to the downside on Tuesday, narrowly missing the target support level at 1.2666.

https://forex-images.ifxdb.com/userfiles/20230809/analytics64d2facff196d.jpg

This morning, the price is returning above the 23.6% Fibonacci level. Surpassing yesterday's peak at 1.2784 opens up the target for further corrective growth towards 1.2880 (50.0%). If the price solidifies below 1.2720, it opens up the target at 1.2666. Afterwards, it can further fall towards 1.2590.

https://forex-images.ifxdb.com/userfiles/20230809/analytics64d2fac034d5f.jpg

On the four-hour chart, the price is trying to overcome the resistance of the MACD line. It's aided by the Marlin oscillator, which is already in the positive territory. The price only needs to settle above 1.2760. It has a 60% chance at growth.

Analysis are provided by InstaForex.

Read More

Best regards, PR Manager / Learn more about InstaForex Company at http://instaforex.com

Re: InstaForex Analysis

USDCHF, H4 | React off Resistance level?

https://forex-images.ifxdb.com/userfiles/20230810/analytics64d463b43feea.jpg

The USD/CHF chart currently exhibits a bearish momentum, indicating a continuing downward trend. In light of this bearish sentiment, there's a likelihood of the price extending its decline towards the 1st support level at 0.8718, which gains importance due to its alignment as an overlap support. Additionally, reinforcement to the support structure comes from a secondary support at 0.8678. Conversely, attention is directed towards the 1st resistance level at 0.8776, marked by its classification as a multi-swing high resistance, potentially obstructing upward movement. Furthermore, a 2nd resistance at 0.8824 is identified as a pullback resistance, intensifying its potential to hinder price advancement.

Analysis are provided by InstaForex.

Read More

Best regards, PR Manager / Learn more about InstaForex Company at http://instaforex.com

Re: InstaForex Analysis

USDJPY, H4 | React off Resistance level?

https://forex-images.ifxdb.com/userfiles/20230811/analytics64d5b15cd8770.jpg

The current USD/JPY chart reflects a bearish momentum, indicating an ongoing downward trend. In light of this momentum, there is a possibility that the price might react bearishly upon reaching the 1st resistance level, potentially leading to a decline towards the 1st support. The significance of the 1st support at 143.81 is highlighted as it serves as an overlap support and is further reinforced by a 38.20% Fibonacci Retracement. Similarly, the 2nd support at 142.78 is identified as an overlap support and aligns with a 61.80% Fibonacci Retracement. On the contrary, the 1st resistance level at 144.86 gains importance as a multi-swing high resistance. This level gains additional strength from its alignment with a 61.80% Fibonacci Projection and a 161.80% Fibonacci Extension, adding to its potential as a resistance level.

Analysis are provided by InstaForex.

Read More

Best regards, PR Manager / Learn more about InstaForex Company at http://instaforex.com

Re: InstaForex Analysis

USDCHF, Day | React off Resistance level?

https://forex-images.ifxdb.com/userfiles/20230814/analytics64d9a26e8ba85.jpg

The USD/CHF chart is displaying a strong downward trend, indicating bearish momentum.

With this bearish view, there's a possibility of a negative price reaction near the first resistance level, potentially leading to a decline towards the first support level.

The significance of the initial support at 0.8558 is due to its role as a support level marked by multiple swing lows. Also, a secondary support at 0.8312 adds to the overall support structure.

Conversely, the primary resistance level at 0.8769 is notable for aligning with a resistance point observed in earlier data.

Furthermore, a secondary resistance at 0.8902 is recognized as a potential pullback point, potentially introducing resistance against upward movement.

Analysis are provided by InstaForex.

Read More

Best regards, PR Manager / Learn more about InstaForex Company at http://instaforex.com

Posts: 1,376 to 1,400 of 1,547

Pages Previous 1 54 55 56 57 58 62 Next

You must login or register to post a reply

Forex Software → Market Analysis → InstaForex Analysis

Similar topics in this forum