forex software

Create and Test Forex Strategies

forex software

Skip to forum content

Forex Software

Create and Test Forex Strategies

You are not logged in. Please login or register.


(Page 49 of 62)

Forex Software → Market Analysis → InstaForex Analysis

Pages Previous 1 47 48 49 50 51 62 Next

You must login or register to post a reply

RSS topic feed

Posts: 1,201 to 1,225 of 1,547

Re: InstaForex Analysis

Forex Analysis & Reviews: USD/JPY analysis for November 07, 2022 - Triangle pattern in creation

https://forex-images.ifxdb.com/userfiles/20221107/analytics6368b498a948e.jpg

USD/JPY has been trading sideways at the price of 147.45. I see potential for the breakout play. Trading recommendation:

Due to the range condition, watch for potential breakout of the trading range to confirm further direction. In case of the upside breakout of the resistance at 148.80, watch for buying opportunities with the upside objective at 151.85.

In case of the downside breakout of the support at 145.65, watch for selling opportunities with the downside objective at 141.85 *The market analysis posted here is meant to increase your awareness, but not to give instructions to make a trade.

Analysis are provided by InstaForex.

Read More

Best regards, PR Manager / Learn more about InstaForex Company at http://instaforex.com

Re: InstaForex Analysis

Forex Analysis & Reviews: Forecast for AUD/USD on November 8, 2022

The Australian dollar managed to overcome the resistance of the MACD indicator line on the daily chart. Today it opened above this line. Now the price will try to master the target range of 0.6514/32. If it is overcome, then the next target will be the level of 0.6592.

https://forex-images.ifxdb.com/userfiles/20221108/analytics6369c249a092b.jpg

The daily Marlin Oscillator is in the neutral position, and it reached a reversal level on October 27 and August 12 (0.0185 on the indicator scale), which increases the psychological tension in connection with the upcoming US Congressional elections today.

https://forex-images.ifxdb.com/userfiles/20221108/analytics6369c25de630c.jpg

On the four-hour chart, the price is above the indicator lines, Marlin is in the positive area and shows the intention to develop a sideways movement. In general, the expectation is positive, that is, the market is preparing to meet the victory of the Republicans. But we are not in a hurry with such expectations, so we just follow the course of events.

*The market analysis posted here is meant to increase your awareness, but not to give instructions to make a trade.

Analysis are provided by InstaForex.

Read More

Best regards, PR Manager / Learn more about InstaForex Company at http://instaforex.com

Re: InstaForex Analysis

Forex Analysis & Reviews: Elliott wave analysis of Litecoin for November 9, 2022

We have seen a deeper-than-expected correction here, as we have seen a correction to the 78.6% corrective target near 53.72, but then it's just in the middle of the fourth wave of one lesser degree, which is normally what we would expect to see. Therefore, we expect Litecoin to start the next journey higher towards the S/H/S bottom target at 97.38.

Only an unexpected break below the key support at 48.41 will invalidate our bullish scenario for the expected rally higher to 97.38 and above.

*The market analysis posted here is meant to increase your awareness, but not to give instructions to make a trade.

Analysis are provided by InstaForex.

Read More

Best regards, PR Manager / Learn more about InstaForex Company at http://instaforex.com

Re: InstaForex Analysis

Forex Analysis & Reviews: Forecast for EUR/USD on November 10, 2022

The elections to the American Congress turned out to be far from being as tragic for the Democrats as the US and other world media predicted. Seats in the Senate were distributed equally 48/48. There will be re-elections in several states in December to determine the winners. The seats in the lower house this morning were distributed as follows: 182 for the Democrats, 205 for the Republicans. As a result, conflicts are already brewing in the Republican camp, a number of functionaries are demanding that Trump be removed from influence on the party, and several Republican governors have already spoken out on their nominations for the presidency (DeSantis, Hogan).

https://forex-images.ifxdb.com/userfiles/20221110/analytics636c684b7c898.jpg

Well, the markets continued their fall: S&P 500 -2.08%, euro -0.58%, oil (CL) -3.42%. A divergence has formed with the Marlin Oscillator on the daily chart. The price returned under the level of 1.0051, where it is most likely to close the day. Thus, the nearest target for the euro is the level of 0.9950. Further, we are waiting for the advance to 0.9864. The price is still in an upward position on the four-hour chart, as the development takes place above the indicator lines and Marlin is in the growth zone. A bit above the support of 0.9950 is the MACD line, which will make it difficult and slow down the price to work out this support.

https://forex-images.ifxdb.com/userfiles/20221110/analytics636c68389fd5d.jpg

Analysis are provided by InstaForex.

Read More

Best regards, PR Manager / Learn more about InstaForex Company at http://instaforex.com

Re: InstaForex Analysis

Forex Analysis & Reviews: Indicator analysis: Daily review of EUR/USD on November 11, 2022

Trend analysis (Fig. 1).
The euro-dollar pair may move upward from the level of 1.0208 (close of yesterday's daily candle) to 1.0246, the 85.4% retracement level (yellow dotted line). When testing this level, a downward pullback is possible.

https://forex-images.ifxdb.com/userfiles/20221111/analytics636debcfdf667.jpg

Fig. 1 (daily chart).
Comprehensive analysis:
Indicator analysis - up;
Fibonacci levels - up;
volumes - up;
candlestick analysis - up;
trend analysis - up;
Bollinger bands - up;
weekly chart - up.

General conclusion: Today, the price may move upward from the level of 1.0208 (close of yesterday's daily candle) to 1.0246, the 85.4% retracement level (yellow dotted line). When testing this level, a downward pullback is possible.

Alternatively, the price may move upward from the level of 1.0208 (close of yesterday's daily candle) to the upper limit of the Bollinger band indicator at 1.0308 (black dotted line). Upon reaching this level, a downward movement is possible with the target of 1.0162, the 14.6% retracement level (blue dotted line).

*The market analysis posted here is meant to increase your awareness, but not to give instructions to make a trade.

Analysis are provided by InstaForex.

Read More

Best regards, PR Manager / Learn more about InstaForex Company at http://instaforex.com

Re: InstaForex Analysis

Forex Analysis & Reviews: Elliott wave analysis of Gold for November 14, 2022

https://forex-images.ifxdb.com/userfiles/20221114/analytics6371cce618dc0.jpg

Gold has finally broken nicely above resistance at 1,735 confirming that wave C of 4 has been completed and wave 5 towards at least 2,400 is in progress. We will be looking for a rally towards resistance in the 1,799 - 1,809 area from where we could see a temporary correction back to retest the former resistance which now acts as support at 1,735 before the next strong rally higher to 1,912 and 2,070 as the next major hurdles on the way higher to 2,400 and possibly 2,700.

*The market analysis posted here is meant to increase your awareness, but not to give instructions to make a trade.

Analysis are provided by InstaForex.

Read More

Best regards, PR Manager / Learn more about InstaForex Company at http://instaforex.com

Re: InstaForex Analysis

Forex Analysis & Reviews: AUDUSD Potential for Bearish Drop | 15th November 2022

https://forex-images.ifxdb.com/userfiles/20221115/analytics63730984a80c8.jpg

With the price moving above the ichimoku cloud on the H4, we have a bullish bias that the price will rise to the first resistance at 0.67711, which is in line with the 161.8% fibonacci line. If the first resistance is broken, the second should be at 0.69161, the previous swing high. Alternatively, the price could fall to the first support level at 0.65398, which is marked by the 38.2% Fibonacci line.

Trading Recommendation
Entry: 0.67711
Reason for Entry: 1st resistance line
Take Profit: 0.65398
Reason for Take Profit:
1st support line
Stop Loss: 0.69161
Reason for Stop Loss:
Previous swing high and 1st resistance line

*The market analysis posted here is meant to increase your awareness, but not to give instructions to make a trade.

Analysis are provided by InstaForex.

Read More

Best regards, PR Manager / Learn more about InstaForex Company at http://instaforex.com

Re: InstaForex Analysis

Forex Analysis & Reviews: Technical Analysis of GBP/USD for November 16, 2022

https://forex-images.ifxdb.com/userfiles/20221116/analytics6374adb348ba2.jpg

Technical Market Outlook: The GBP/USD pair has been seen moving higher towards the next target for bulls which is located at 161% Fibonacci extension level at 1.2073. So far the local high was made at the level of 1.2026 and then a 2% pull-back followed. The intraday technical support is seen at 1.1760, 1.1734 and 1.1722. The strong and positive momentum on the H4 time frame chart supports the bullish outlook for GBP despite the extremely overbought market conditions, however please stay focused and viligant as the pull-back lower might come any time now as the market looks overstretched o n H4 time frame chart.

Weekly Pivot Points:
WR3 - 1.19243
WR2 - 1.18500
WR1 - 1.18089
Weekly Pivot - 1.17757
WS1 - 1.17346
WS2 - 1.17014
WS3 - 1.16271

Trading Outlook:
The Bearish Engulfing candlestick pattern that was made on the weekly time frame chart has been invalidated and the strong green weekly candle was made. The bulls are temporary in control of the market and the 38% Fibonacci retracement of the last wave down located at 1.1830 had been tested as well. On the other hand, the level of 1.0351 has not been tested since 1985, so the down trend is strong. In order to terminate the down trend, bulls need to break above the level of 1.2275 (swing high from August 10th). *The market analysis posted here is meant to incr

*The market analysis posted here is meant to increase your awareness, but not to give instructions to make a trade.

Analysis are provided by InstaForex.

Read More

Best regards, PR Manager / Learn more about InstaForex Company at http://instaforex.com

Re: InstaForex Analysis

Forex Analysis & Reviews: Technical Analysis of Nasdaq 100 Index Intraday Price Movement, Thursday November 17, 2022

https://forex-images.ifxdb.com/userfiles/20221117/analytics637595bd28a0e.jpg

On 4 hour chart Nasdaq 100 Index seems visible if #NDX still moving within its Bullish Pitchfork channel even so because of its failure to touch the top line of the Bullish Pitchfork channel it can be considered as Hagopian Rules which confirms that in the near future #NDX will depreciated in the near future where it is also confirmed by the emergence of the Ascending Broadening Wedge pattern so that in the near future #NDX will try to test and broke below the level 11670,5 if this level is successfully broken then #NDX has the potential to fall to 11121.8 as the main target and 10789.1 as the next target to be tested with a note that on its way to the target level it does not return to its initial bias (Bull) until it exceeds above 12082. because if this level is successfully broken, it is very likely that the downside scenario described above will become invalid.

*The market analysis posted here is meant to increase your awareness, but not to give instructions to make a trade.

Analysis are provided by InstaForex.

Read More

Best regards, PR Manager / Learn more about InstaForex Company at http://instaforex.com

Re: InstaForex Analysis

Forex Analysis & Reviews: Forecast for EUR/USD on November 18, 2022

Despite the euro's strong desire to go down yesterday, it was not possible to overcome the support of 1.0360, the day closed higher. This morning the price is at the level, waiting for external incentives for further action. Yesterday, such incentives were the fall of oil by 3.76% and the decline of gold by 0.79%.

https://forex-images.ifxdb.com/userfiles/20221118/analytics6376f2ef8dbc0.jpg

The daily Marlin Oscillator is declining smoothly, while there are no signs that the price may abandon attempts to break through 1.0360. If this happens, the 1.0205 target will become available.

https://forex-images.ifxdb.com/userfiles/20221118/analytics6376f2fb11244.jpg

On the four-hour chart, the price is supported by the indicator balance line (red moving line), but, nevertheless, the Marlin Oscillator has been in the negative area for a long time, so the price is unlikely to stop trying to overcome the supports. On the way to 1.0205, there is a MACD line (1.0260). It is also an important support to overcome. If the attempt is still unsuccessful, then the price may return to 1.0470 or even overcome the high on November 15 to form a divergence.

*The market analysis posted here is meant to increase your awareness, but not to give instructions to make a trade.

Analysis are provided by InstaForex.

Read More

Best regards, PR Manager / Learn more about InstaForex Company at http://instaforex.com

Re: InstaForex Analysis

Forex Analysis & Reviews: Technical Analysis of Intraday Price Movements of the EUR/GBP Cross Currency Pair November 21, 2022

https://forex-images.ifxdb.com/userfiles/20221121/analytics637ad3360e69a.jpg

On the 4 hour chart EUR/GBP cross Currency pair seems to appear.

1. Deviations between price movements with the CCI indicator.
2. Ascending Broadening Wedge.
3. Bearish Wolve Waves

Based on the three information above it can be confirmed that in the near future EUR/GBP will try to get down below the level 0,8689 where if this level successfully penetrated will potentially bring EUR/GBP down to ETA Line from Wolve Waves and/or to the level 0,8589 as a target that will aim for with a note that if on his way to these levels there is no upward correction movement that penetrates above the 0.8775 level because if this level is successfully broken above, it is very likely that the scenario described previously will potentially become invalid.

*The market analysis posted here is meant to increase your awareness, but not to give instructions to make a trade.

Analysis are provided by InstaForex.

Read More

Best regards, PR Manager / Learn more about InstaForex Company at http://instaforex.com

Re: InstaForex Analysis

Forex Analysis & Reviews: Technical Analysis of Intraday Price Movements of the EUR/GBP Cross Currency Pair November 21, 2022

Yesterday, China reported a sharp rise in Covid cases in Beijing, and the return of social restrictions and isolation in several areas in the country. Oil rebounds and stock indices started to decline on risks regarding the collapse of new (after FTX) cryptocurrency platforms (Genesis). Against this backdrop, the euro fell in price by 0.80%.

https://forex-images.ifxdb.com/userfiles/20221122/analytics637c3a53a0ab0.jpg

This morning, the euro is approaching support at 1.0205. The price may correct just a bit, as the Marlin oscillator has a margin to the zero line on the daily chart - up to the limit of the declining territory, and may try to turn up without leaving this area. The bears' success, however, would open the 1.0100/20 target range. The price has settled under the MACD indicator line on the four-hour chart. The Marlin oscillator is in negative territory, in the area where the direction is downward.

These circumstances increase the probability of the attempt to overcome 1.0205. The immediate objective is to settle under 1.0205. Support is technically strong, preliminary price consolidation is likely.

https://forex-images.ifxdb.com/userfiles/20221122/analytics637c3a5f8c31e.jpg

*The market analysis posted here is meant to increase your awareness, but not to give instructions to make a trade.

Analysis are provided by InstaForex.

Read More

Best regards, PR Manager / Learn more about InstaForex Company at http://instaforex.com

Re: InstaForex Analysis

Forex Analysis & Reviews: Technical Analysis of Intraday Price Movements of Commodity Currency Pairs, NZD/USD Wednesday, November 23, 2022

https://forex-images.ifxdb.com/userfiles/20221123/analytics637d9d47de792.jpg

On the 4 hour chart kiwi shows that hidden deviations appear between price movements and the CCI indicator which confirms if in the near future NZD/USD will have the potential to rally upwards to the nearest liquidity gathering place, namely in the Equal High area, namely at the level of 0.6201 but if the CCI level drops below the level 0 and/or level 0.6962 is exceeded, it is very likely for the scenario described earlier cancel by itself.

*The market analysis posted here is meant to increase your awareness, but not to give instructions to make a trade.

Analysis are provided by InstaForex.

Read More

Best regards, PR Manager / Learn more about InstaForex Company at http://instaforex.com

Re: InstaForex Analysis

Forex Analysis & Reviews: Elliott wave analysis of EUR/USD for November 24, 2022

https://forex-images.ifxdb.com/userfiles/20221124/analytics637f0318164ab.jpg

The minor correction from 1.0482 has reached its corrective target at 1.0222 and the pair is ready to resume the underlying impulsive rally higher through resistance at 1.0482 for a rally towards 1.0784 and 1.0927 as the next upside targets.

In the longer term, we are looking for much higher levels here as we see the major corrective decline from 1.6038 as completed at 0.9536. A new major impulsive rally that ultimately will take us back above 1.6038 is unfolding. This of course will not be in a straight line, but in the next years, the trend will be up.

*The market analysis posted here is meant to increase your awareness, but not to give instructions to make a trade.

Analysis are provided by InstaForex.

Read More

Best regards, PR Manager / Learn more about InstaForex Company at http://instaforex.com

Re: InstaForex Analysis

Forex Analysis & Reviews: Future interest rate reductions by the Bank of England are also possible.

https://forex-images.ifxdb.com/userfiles/20221125/analytics638040b2aa470.jpg

Currently, the Bank of England is a "dark horse." It is difficult to predict how much longer the British regulator will raise its rate, even though it is doing so slower than the Fed and the ECB. It decided to increase the rate by 75 basis points at the most recent meeting, a record increase over the previous 12 to 13 years and the first increase during the current tightening monetary policy cycle. Although the Bank of England rate has already increased to 3%, inflation in the UK is still rising, and there are currently no signs that it will slow down. One could anticipate at least a slight slowdown in the consumer price index with such a rate value, but keep in mind that there is a "time lag" that could take up to 3–4 months for the economy to fully adjust to the most recent (and subsequent) PEPP tightenings.

Inflation in the UK may therefore start to slow down soon, but I believe it will only be able to disappear at a 3% rate, even below the 10% threshold. It increased to 11.1% in October, and Andrew Bailey recently predicted that the peak value might reach 13% or 15%. The fact that British inflation has yet to display any discernible slowdown that would be considered the start of a fall is a major disadvantage. Based on this, it can be assumed that the Bank of England's relatively high rate is already impacting the economy and inflation. However, no one can say with certainty how significant this impact is. There may be an impact, but it is probably insignificant in light of the factors that drive monthly price increases. A 3% rate may only stop prices from increasing even more quickly. Since I cannot respond, it is too early to discuss the Bank of England's final interest rate.

In light of the current situation, the regulator should increase the rate by 75 basis points at least twice more, bringing it to 4.5%. After that, he can follow the Fed's lead and raise the rate gradually while he waits for inflation to respond to three or four rounds of extremely strict PEPP tightening. However, given the current state of the British economy, analysts now have serious doubts about the Bank of England's ability to take such actions. According to Andrew Bailey, the recession "has already begun" and at the same time "has just begun" due to the most recent GDP report for the third quarter showing a contraction. It can last for up to two years (assuming no further economic shocks), and it is difficult to predict how much the British GDP will decline due to high rates.

According to Dave Ramsden, the deputy governor of the Bank of England, it is imperative to respond to the state of the British economy. If things continue to go poorly, it will be prudent to lower the rate to prevent making the already challenging financial situation for households even worse. The objective of bringing inflation back to 2% remains the same, but the Bank of England will need to monitor economic expansion.

The construction of a new downward trend segment is predicated on the wave pattern of the pound/dollar instrument. I cannot suggest purchasing the instrument immediately because the wave marking already permits the development of a downward trend section. Sales are more accurate now that the targets are close to the 200.0% Fibonacci level.

Analysis are provided by InstaForex.

Read More

Best regards, PR Manager / Learn more about InstaForex Company at http://instaforex.com

Re: InstaForex Analysis

Forex Analysis & Reviews: Forecast for EUR/USD on November 28, 2022

Last Friday, the euro touched the lower shadow of the support at 1.0360, this morning it did the same thing. The price needs to settle under this level so it can reach 1.0205, and it will form a double top on the daily chart. But the price is not in a hurry to do so. Therefore, if today closes with a white candle, then there is a high probability of a breakout of 1.0470 and a divergence may form with the Marlin oscillator.

https://forex-images.ifxdb.com/userfiles/20221128/analytics63841d3f6deda.jpg

The situation on the weekly chart contributes to the divergence option - here we see that the MACD indicator line still hasn't been reached. But whether it will be reached or not, remains an intrigue.

https://forex-images.ifxdb.com/userfiles/20221128/analytics63841d4a23c70.jpg

On the four-hour chart, the price crossed the MACD line on the descending Marlin oscillator. There was a similar transition on Friday, it was not reliable. Now, when the Marlin oscillator is involved, the price has a chance of settling under 1.0360. Watch the situation, for a signal for a short-term growth or a medium-term fall.

Analysis are provided by InstaForex.

Read More

Best regards, PR Manager / Learn more about InstaForex Company at http://instaforex.com

Re: InstaForex Analysis

Forex Analysis & Reviews: ETHUSD Potential For Bearish Continuation | 29th November 2022

https://forex-images.ifxdb.com/userfiles/20221129/analytics6385d9f01cbf1.jpg

Looking at the H4 chart, my overall bias for ETHUSD is bearish due to the current price being below the Ichimoku cloud, indicating a bearish market .If this bearish momentum continues, expect price to possibly head towards the 1st support at 1071.11, where the -previous swing low is located. In an alternate scenario, price could possibly head back up towards the 1st resistance level at 1291.84, where the 38.2% Fibonacci line is located. Trading Recommendation Entry: 1302.56 Reason for Entry: 1st resistance line Take Profit:1071.11 Reason for Take Profit: 1st support line Stop Loss: 1677.00 Reason for Stop Loss: Slightly above where the 2nd resistance line is located.

*The market analysis posted here is meant to increase your awareness, but not to give instructions to make a trade.

Analysis are provided by InstaForex.

Read More

Best regards, PR Manager / Learn more about InstaForex Company at http://instaforex.com

Re: InstaForex Analysis

Forex Analysis & Reviews: USD/MXN Currency Pair Intraday Price Movement Technical Analysis Wednesday November 30, 2022.

https://forex-images.ifxdb.com/userfiles/20221130/analytics6386b2e3e6177.jpg

With price movements moving below the Moving Average of the 100 period and the CCI indicator still moving in the range of 0 to -100 levels on the 4-hour chart, the condition of the USD/MXN currency pair is confirmed to be still moving in a bearish bias while currently an upward correction is occurring. stuck at the Resistance level 19,268-19,240 if this level area is strong to hold the upward correction rate and does not exceed the 19,390 level then USD/MXN will have the potential to fall again down to the 19,036 level.

Analysis are provided by InstaForex.

Read More

Best regards, PR Manager / Learn more about InstaForex Company at http://instaforex.com

Re: InstaForex Analysis

Forex Analysis & Reviews: EUR/USD. Overview for December 1, 2022

https://forex-images.ifxdb.com/userfiles/20221201/analytics6387fe1fdd5fe.jpg

On Wednesday, there was no movement in the EUR/USD currency pair. We wouldn't have been shocked if this situation had occurred on Monday or Tuesday because there hasn't been a single significant event or report published lately. On Wednesday, there were a ton of macroeconomic statistics. Still, traders paid no attention to the report on European inflation, although it was just as alarming as the last one on American inflation, which sparked this rally. Yet again, we are convinced that the impact of European statistical data on trader sentiment is minimal. But the main point is that quite significant reports from abroad were disregarded yesterday. The ADP report could cause a market reaction if everything in the GDP report is clearer because such reports always come out with three estimates. After the first estimate, it is clear what to expect from the value for a particular quarter.

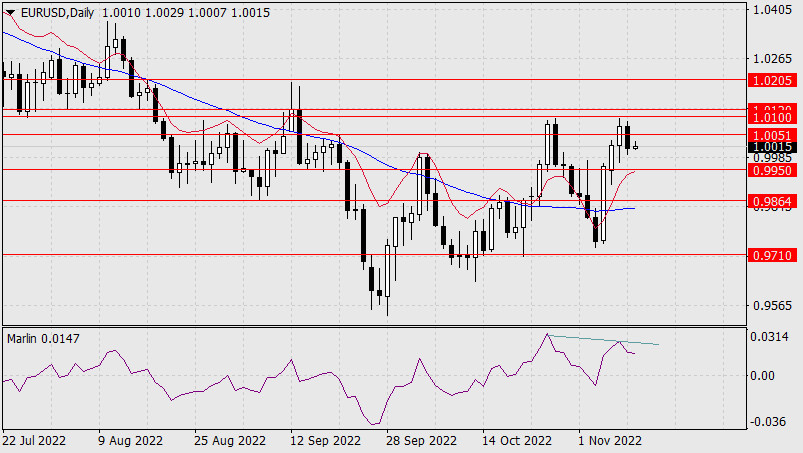
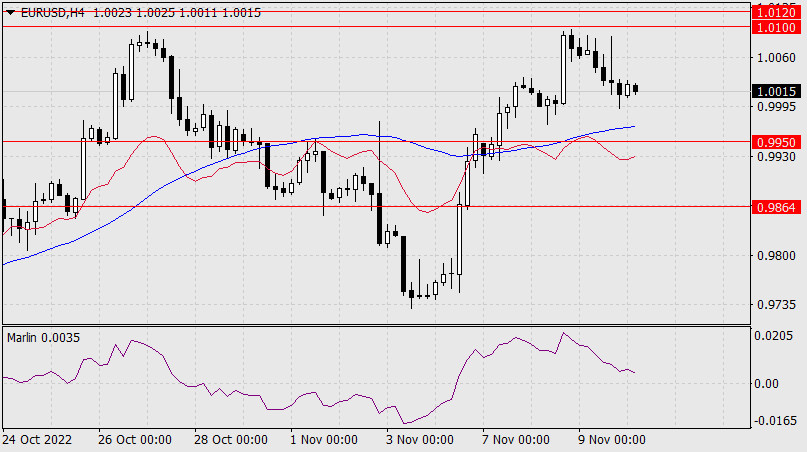
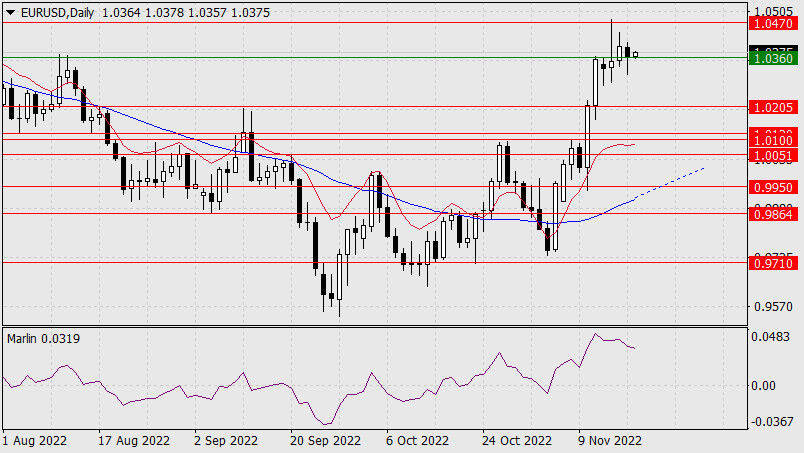
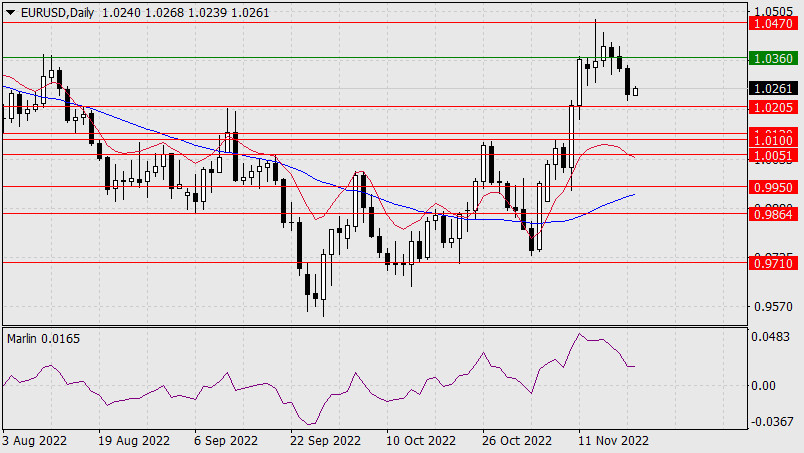
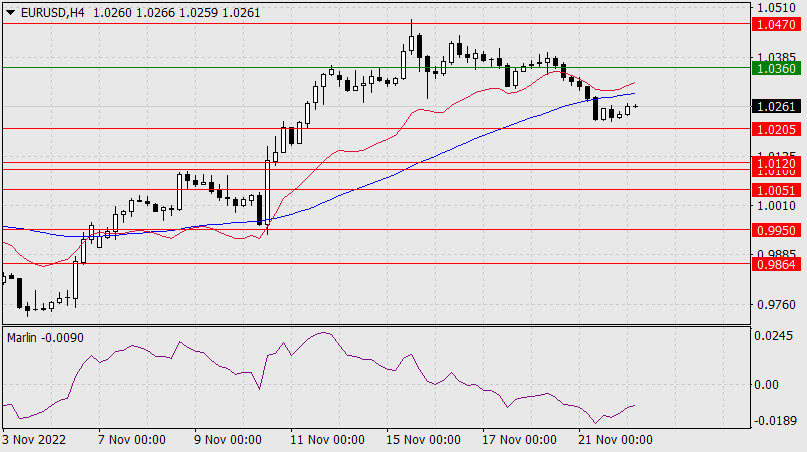
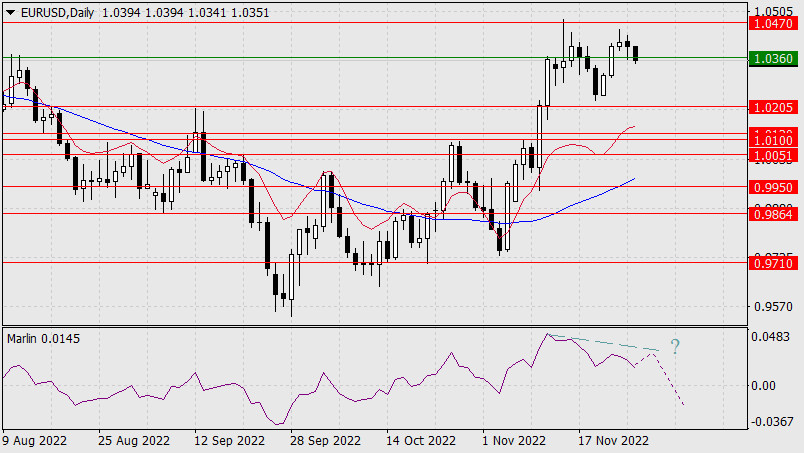
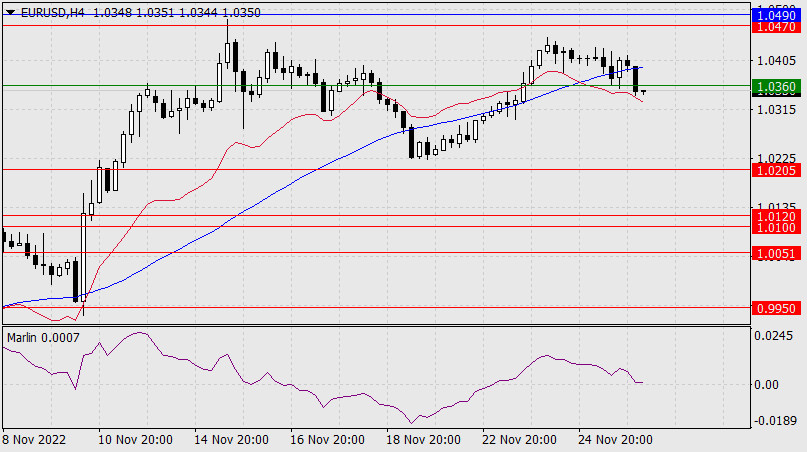
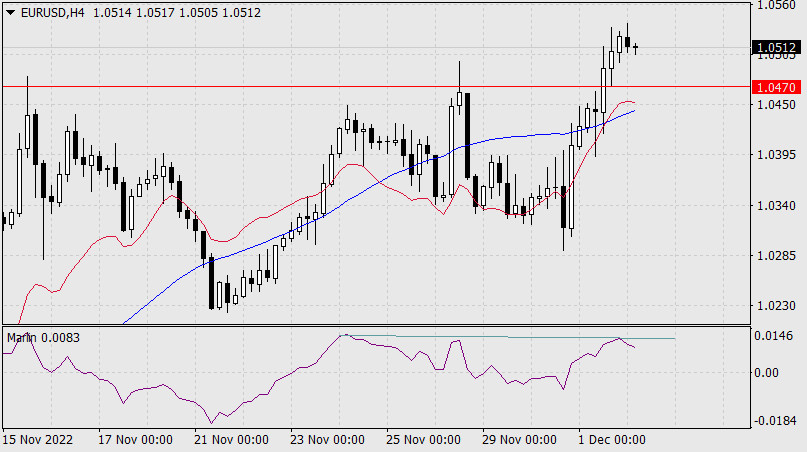
And it's puzzling why the market didn't find anything interesting in them when we consider all the information and data received. As a result, the pair is still relatively close to the moving average line, and it is still determining the direction of its future movement. For the past week and a half, we have been anticipating a significant downward correction, but this calls for a fix that is at least below the moving average. Formally, the consolidation was visible on Tuesday, but 20 points hardly qualify as a confident result. We focus on the second rebound from Murray level "6/8"-1.0498. Two rebounds from this level could signal the start of a corrective movement. As you can see, traders were unmoved by yesterday's data, so we now have to wait for Friday's nonfarm payrolls and unemployment figures.

In the third quarter, US GDP increased.

Since the GDP report typically includes three estimates, as we mentioned above, traders know what to expect before the second or third estimate is released. However, yesterday's report caught some people off guard because, contrary to expectations of +2.6–2.7% q/q, the actual value was 2.9%. This strong deviation should have benefited the value of the US dollar. Not only was the EU inflation report disregarded, but so was a rather significant GDP with an unexpected value. Even the ADP report received no response. Therefore, even though we think traders still have access to the factors supporting the US currency, they are not yet eager to repurchase the dollar.

As a result, the third quarter of the American economy displays very positive dynamics and can easily compensate for the "disadvantages" of the first two quarters. If this occurs, the Fed will have many more opportunities to raise interest rates as much as it wants. It is again good for the dollar because if inflation stops falling, the Fed will still have opportunities to tighten monetary policy more than expected. It will then become very difficult to talk about a recession in the US economy. Additionally, the fact that there isn't a recession is excellent news for the American economy. Similar to how it is for every other economy in the world. For instance, it is unlikely that the European economy will be spared from such "happiness." Additionally, a slower inflation rate in the Eurozone might encourage the ECB to raise the key rate gradually over the next few months. The euro currency may experience the same fate as the dollar, which has been declining for several months due to the Fed's potential decision to raise interest rates more gradually than previously. Although there are more and more signs pointing to a new rise in the dollar's value, more precise technical signals are still needed to test this theory. We will only analyze Jerome Powell's speech today because it is crucial to know how the market will respond.

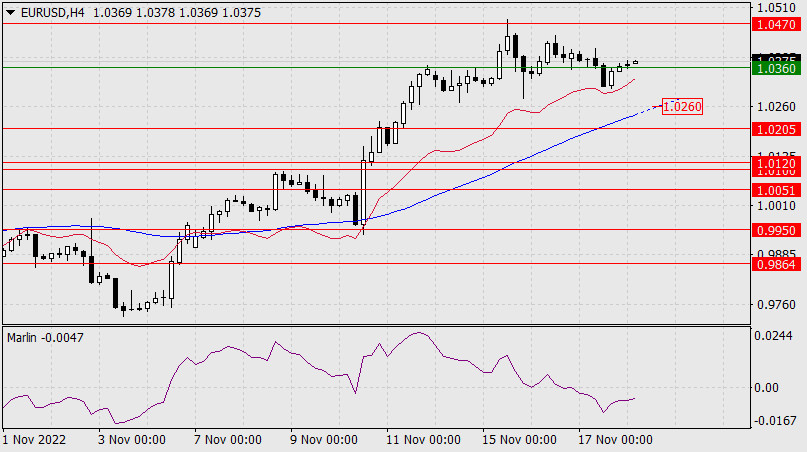
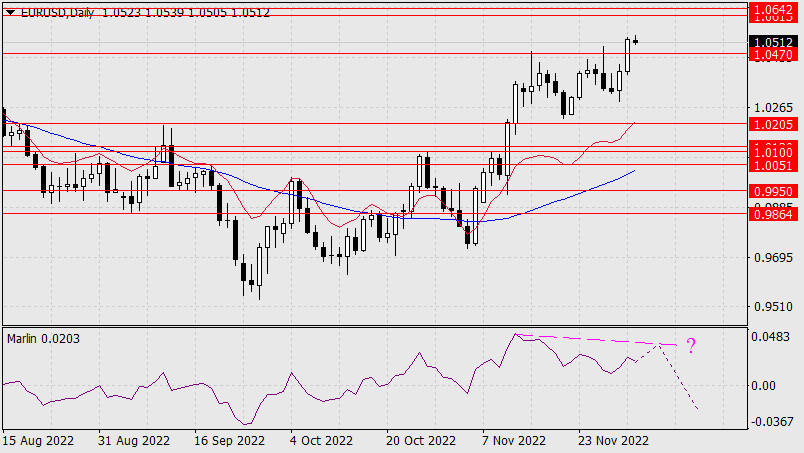
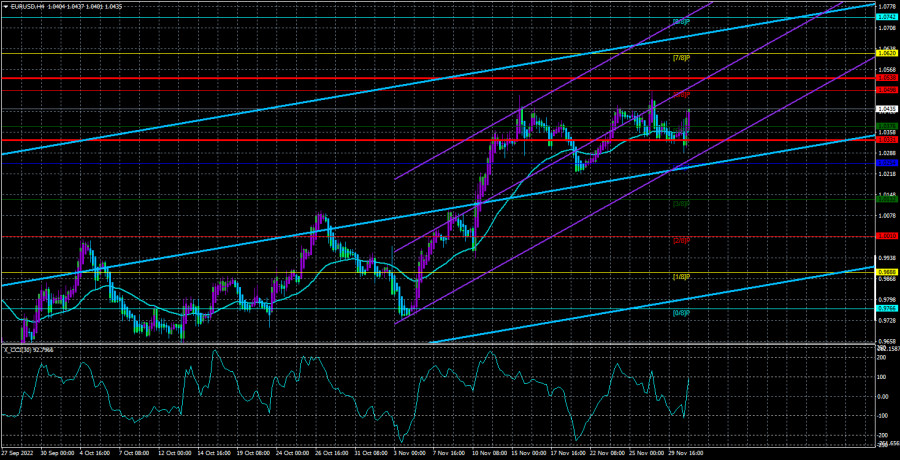
As of December 1, the euro/dollar currency pair's average volatility over the previous five trading days was 103 points, considered "high." So, on Thursday, we anticipate the pair to fluctuate between 1.0331 and 1.0538 levels. The Heiken Ashi indicator's turning downward indicates a new phase of the corrective movement.

Nearest levels of support
S1 – 1.0376
S2 – 1.0254
S3 – 1.0132

Nearest levels of resistance
R1 – 1.0498
R2 – 1.0620
R3 – 1.0742

Trading Suggestions:

The EUR/USD pair is still positioned close to the moving average. To avoid the Heiken Ashi indicator turning down, new long positions with targets of 1.0498 and 1.0538 should now be considered. Only after fixing the price below the moving average line with targets of 1.0254 and 1.0132 will sales become significant.

Explanations of the illustrations:

Linear regression channels help determine the current trend. The trend is strong if both are directed in the same direction.

The moving average line (settings 20.0, smoothed) determines the short-term trend and the direction to trade now.

Murray levels are target levels for movements and corrections.

Volatility levels (red lines) are the likely price channel in which the pair will spend the next day, based on current volatility indicators.

The CCI indicator – its entry into the oversold area (below -250) or into the overbought area (above +250) means that a trend reversal in the opposite direction is approaching.

Analysis are provided by InstaForex.

Read More

Best regards, PR Manager / Learn more about InstaForex Company at http://instaforex.com

Re: InstaForex Analysis

Forex Analysis & Reviews: Forecast for EUR/USD on December 2, 2022

In anticipation of today's US jobs data, on the back of Federal Reserve Chairman Jerome Powell's seemingly not obvious dovish speech, the euro rose 119 pips yesterday. The price crossed the target level of 1.0470, the peak of November 28, and is now heading to the target range of 1.0015/42. The range is defined by the highs of June and May. So far, the price is going with our scenario with forming a divergence when the target range is reached.

https://forex-images.ifxdb.com/userfiles/20221202/analytics63896f9e723b8.jpg

On the four-hour chart, there is a sign that a double divergence is forming with the Marlin oscillator. In the current market sentiment, it may mean a pause in growth in anticipation of new important information. That will be the U.S. employment data for November. Forecast is 200,000 new jobs, compared to 261,000 in October.

The improving dynamics of weekly unemployment claims and yesterday's drop of the ISM Manufacturing Employment subindex from 50.0 to 48.4 might be weaker than expected. Traders will be waiting for this situation to become clearer.

https://forex-images.ifxdb.com/userfiles/20221202/analytics63896fc1dd5c9.jpg

Analysis are provided by InstaForex.

Read More

Best regards, PR Manager / Learn more about InstaForex Company at http://instaforex.com

Re: InstaForex Analysis

Forex Analysis & Reviews: Technical Analysis of Daily Price Movements of Crude Oil Commodity Assets, Monday, December 05 2022.

https://forex-images.ifxdb.com/userfiles/20221205/analytics638d460e85bcc.jpg

On the daily chart, the Crude Oil commodity asset can be seen that Friday's bar has a Close that overlaps with the PL Dots so that it forms a Support/Block area at Friday's low to push up Crude Oil's movement on Monday Dec 05, 2022 as for Crude Oil on Monday is predicted to be pushed by market players to the Projection High area at the 81.57 level. If this level is successfully broke, then the 82.20 level which is the Sacrosanct Level / Halo will be the main target to be broke upwards as long as the 79.66 block area is not penetrated below.

*The market analysis posted here is meant to increase your awareness, but not to give instructions to make a trade.

Analysis are provided by InstaForex.

Read More

Best regards, PR Manager / Learn more about InstaForex Company at http://instaforex.com

Re: InstaForex Analysis

Forex Analysis & Reviews: Forecast for AUD/USD on December 6, 2022

By the end of Monday the dollar index gained 0.78%, oil prices fell by 3.66% and the Australian dollar fell by 1.37%. The price overcame the support at 0.6730 and now it is trying to increase in today's Asian session, but without losing the opportunity to settle below the level.

https://forex-images.ifxdb.com/userfiles/20221206/analytics638eaaa4951d1.jpg

The price can reach the target support at 0.6642, in case it overcomes yesterday's low at 0.6688, in which case the signal line of the Marlin oscillator will break through the zero line and move into the territory of the downtrend. Divergence continues to exert its effect on the price.

https://forex-images.ifxdb.com/userfiles/20221206/analytics638eaa93ce5b0.jpg

On the four-hour chart, the price settled under the MACD line and under the level of 0.6730. Also, the Marlin oscillator settled in the negative territory. By cumulative circumstances of both charts, the bears have advantages. We wait for things to progress and AUD to reach the target support at 0.6642.

*The market analysis posted here is meant to increase your awareness, but not to give instructions to make a trade.

Analysis are provided by InstaForex.

Read More

Best regards, PR Manager / Learn more about InstaForex Company at http://instaforex.com

Re: InstaForex Analysis

Forex Analysis & Reviews: Technical Analysis of Daily Price Movement of the GBP/AUD Cross Currency Pair Wednesday, December 07, 2022.

https://forex-images.ifxdb.com/userfiles/20221207/analytics6390051d4314f.jpg

With the GBP/AUD price movement on the daily chart still moving above its 50 MA and the formation of the Bullish 123 pattern followed by Ross Hook (RH) it can be seen that buyers are still dominating this cross currency pair but it seems that in the near future it will be corrected slightly to the level 1.7916 but please pay attention as long as the downward correction does not exceed the 1.7700 level, then you can be sure that GBP/AUD is still in a bullish condition and will try to test the 1.8256 level. (Disclaimer)

*The market analysis posted here is meant to increase your awareness, but not to give instructions to make a trade.

Analysis are provided by InstaForex.

Read More

Best regards, PR Manager / Learn more about InstaForex Company at http://instaforex.com

Re: InstaForex Analysis

Forex Analysis & Reviews: Trading Signal for GOLD (XAU/USD) on December 08-09, 2022: buy above $1,775-1,781 (+1/8 Murray - uptrend channel)

https://forex-images.ifxdb.com/userfiles/20221208/analytics639166a594105.jpg

XAU/USD is trading around 1,782, above the 21 SMA showing a bullish bias. It is likely that if gold consolidates above this area, it could reach the zone of 1,803 and even reach +2/8 Murray located in 1,812.

Investors are worried as Vladimir Putin said the threat of nuclear war is growing, suggesting they would use nuclear weapons in response to an attack on his country. This news could increase risk aversion and investors could take refuge in gold. hence, the price could reach levels of 1,850, even quickly climbing as high as the landmark level of 1,900.

Risk aversion could increase, causing investors to be very cautious. This is due to negative data from China, raising concerns about a global recession. This assures investors to take refuge in gold and the price could increase only if it consolidates above the psychological level of 1,800 -1,812.

Yesterday in the American session, gold quickly rose above the uptrend channel, breaking the 21 SMA (1,780) and reaching the swing high of 1,788.06.

The asset is currently consolidating above the key level of 1,781 (21 SMA), suggesting that if it settles above this area, the price could resume the bullish cycle in the next few hours.

In the next few hours, we expect XAU/USD to trade above 1,781 and reach the resistance of 1,803 and even the high of Dec 5 at 1,810. On the other hand, in case of a technical bounce around the uptrend channel formed since November 22, we will have an opportunity to buy around 1,775.

A close on the 4-hour chart below 1,770 and a sharp break of the uptrend channel are critical to trigger further declines in gold. The metal could quickly reach the 8/8 Murray (1,750) and even the 200 EMA located at 1,736.

Our trading plan for the next few hours is to buy gold above 1,781 or in case of a technical bounce around 1,775, with targets at 1,803 and 1,812. *The market analysis posted here is meant to increase your awareness, but not to give instructions to make a trade.

Analysis are provided by InstaForex.

Read More

Best regards, PR Manager / Learn more about InstaForex Company at http://instaforex.com

Re: InstaForex Analysis

Forex Analysis & Reviews: Technical Analysis of GBP/USD for December 9, 2022

Technical Market Outlook: The GBP/USD pair has been seen bouncing up from the technical support located at 1.2106 and is moving closer to the swing high located at 1.2343. The momentum remains strong and positive which supports the short-term bullish outlook for GBP. The nearest technical support is still seen at 1.2106, so in a case of an unexpected breakout lower, the next target for bears is seen at 1.1897 (30th November low). Also, please notice the Bearish Divergence between the price and the momentum indicator that might have an impact on the next bearish movement.

https://forex-images.ifxdb.com/userfiles/20221209/analytics6392f97159916.jpg

Weekly Pivot Points:
WR3 - 1.24283
WR2 - 1.23713
WR1 - 1.23415
Weekly Pivot - 1.23143
WS1 - 1.22845
WS2 - 1.22573
WS3 - 1.22003

Trading Outlook:
The bulls are temporary in control of the market and the 50% Fibonacci retracement of the last big wave down located at 1.2293 had been tested, so a down trend resumption is possible. On the other hand, the level of 1.0351 has not been tested since 1985, so the down trend is strong. In order to terminate the down trend, bulls need to close the weekly candle above the level of 1.2275 (swing high from August 10th).

*The market analysis posted here is meant to increase your awareness, but not to give instructions to make a trade.

Analysis are provided by InstaForex.

Read More

Best regards, PR Manager / Learn more about InstaForex Company at http://instaforex.com

Posts: 1,201 to 1,225 of 1,547

Pages Previous 1 47 48 49 50 51 62 Next

You must login or register to post a reply

Forex Software → Market Analysis → InstaForex Analysis

Similar topics in this forum