forex software

Create and Test Forex Strategies

forex software

Skip to forum content

Forex Software

Create and Test Forex Strategies

You are not logged in. Please login or register.


(Page 25 of 62)

Forex Software → Market Analysis → InstaForex Analysis

Pages Previous 1 23 24 25 26 27 62 Next

You must login or register to post a reply

RSS topic feed

Posts: 601 to 625 of 1,547

Re: InstaForex Analysis

Forecast for EUR/USD on July 13, 2020

EUR/USD
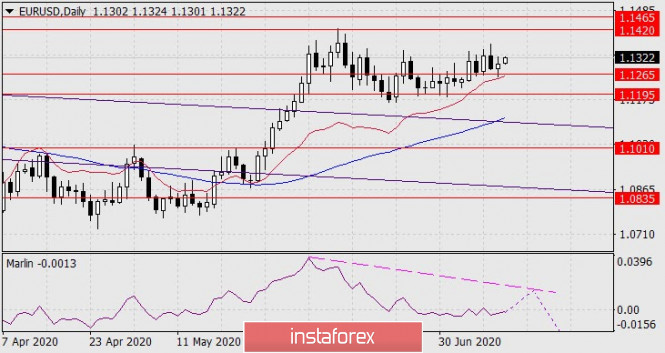
The euro closed Friday with growth. The price found strong support at 1.1265. The growth continues this morning, the Marlin oscillator is in a hurry to move to the growth zone – in the upper half of its own window. The divergence option, in which the euro will show a new high (1.1465), is gaining more and more strength.

https://forex-images.ifxdb.com/userfiles/20200713/analytics5f0bdd5b3fd4b.jpg

The price overcomes the signal level of 1.1315 on the four-hour chart, the Marlin oscillator moved to the growing trend zone, and the nearest growth target is the level of 1.1353. Overcoming the level opens the way to 1.1420, then to 1.1465. The recently formed divergence is considered fulfilled, the price has taken a course for a new short-term trend.

https://forex-images.ifxdb.com/userfiles/20200713/analytics5f0bdd6e0e463.jpg

Analysis are provided byInstaForex.

Re: InstaForex Analysis

Forecast for EUR/USD on July 14, 2020

EUR/USD
The euro showed the expected growth on Monday, but the structure of this growth was tricky, there was a potential for the price to turn down, in a deep correction, for example, to the target level of 1.1195. This warning signal is weak on the daily chart. This is the probability of a reversal of the signal line of the Marlin oscillator from the border of the growth territory. Consolidating the price above yesterday's high will continue to develop in the market according to the main scenario – the euro's growth in the target range of 1.1420/65 with a divergence forming on Marlin.

https://forex-images.ifxdb.com/userfiles/20200713/analytics5f0bdd5b3fd4b.jpg

The risk of a downward price reversal is stronger on the four-hour chart - this is a double divergence on the Marlin oscillator. Leaving the price below 1.1265 opens the remaining path to 1.1195. After falling below this level, the price will face a difficult task of reaching the target level of 1.1010 – it will face both difficult supports and weak dynamics on the discharged oscillators.

https://forex-images.ifxdb.com/userfiles/20200714/analytics5f0d31c45ee28.jpg

Analysis are provided byInstaForex.

Re: InstaForex Analysis

Technical Analysis of GBP/USD for July 15, 2020:

Technical Market Outlook:

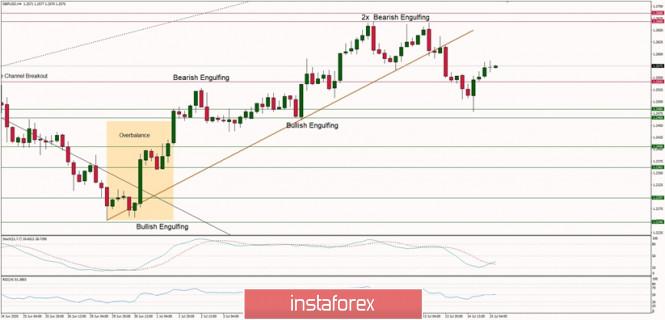
After the GBP/USD pair had made a Double Top price pattern at the level of 1.2668, the bears have managed to push the prices towards the level of 1.2484 which is the key short-term technical support for the market. The price has bounced from support, but no new high was made yet ( the local high was made at the level of 1.2586. The bulls might try to test the trend line from below, but this move would require more momentum in order to get to the level of 1.2640. The RSI indicator shows the momentum is neutral, so neither bulls not bears are in control of the market (on the short-term time frame like H4). Any violation of the level of 1.2466 will accelerate the sell-off towards the next technical support seen at the level of 1.2406.

Weekly Pivot Points:WR3 - 1.2915WR2 - 1.2796WR1 - 1.2712Weekly Pivot - 1.2585WS1 - 1.2508WS2 - 1.2378

WS3 - 1.2304

Trading Recommendations:

On the GBP/USD pair the main trend is down, which can be confirmed by the down candles on the weekly time frame chart. The key long-term technical support has been recently violated (1.1983) and the new one is seen at the level of 1.1404. The key long-term technical resistance is seen at the level of 1.3518. Only if one of these levels is clearly violated, the main trend might reverse (1.3518) or accelerate (1.1404). The market might have done a Double Top pattern at the level of 1.2645, so the price might move even lower in the longer-term. *The market analysis posted here is meant to increase your awareness, but not to give instructions to make a trade.

https://forex-images.ifxdb.com/userfiles/20200715/analytics5f0e9df41e99d.jpg

*The market analysis posted here is meant to increase your awareness, but not to give instructions to make a trade.

Re: InstaForex Analysis

Technical Analysis of EUR/USD for July 16, 2020:

Technical Market Outlook:
Another Bearish Engulfing candlestick pattern has been made at the top of the last move up at the level of 1.1452, but bulls are not giving up. This is the seventh attempt to rally above the supply zone located between the levels of 1.1406 - 1.1419. The RSI indicator shows the positive and strong momentum, so the market participants should wait for a Pin Bar like candlestick around the level of 1.1400. If there is this kind of a reversal candlestick pattern, then the bulls might continue the local up trend towards the level of 1.1497.

Weekly Pivot Points:
WR3 - 1.1497
WR2 - 1.1428
WR1 - 1.1365
Weekly Pivot - 1.1301
WS1 - 1.1233
WS2 - 1.1170
WS3 - 1.1101

Trading Recommendations:
On the EUR/USD pair, the main long-term trend is down, but the local up trend continues. The key long-term technical support is seen at the level of 1.0336 and the key long-term technical resistance is seen at the level of 1.1540. Only if one of this levels is clearly violated, the main trend might reverse (1.1540) or accelerate (1.0336).

https://forex-images.ifxdb.com/userfiles/20200716/analytics5f0fea30cb07d.jpg

Analysis are provided byInstaForex.

Re: InstaForex Analysis

Control zones for AUDUSD on 07/17/20

Previously opened purchases must be kept. The first goal for growth is to renew weekly and monthly highs. It is important to understand that a reversal model will only form in case closing of trades occur below the WCZ 1/2 0.6949-0.6940. Until this happens, buying is the best strategy. Yesterday's decline made it possible for us to get favorable prices to open a long position.

https://forex-images.ifxdb.com/userfiles/20200717/analytics5f1139f154cbb.jpg

Closing today's trading above the week's local high will make it possible for us to talk about growth lasting until next week.

Testing the WCZ 1/2 0.6949-0.6940 will be required to obtain more favorable prices for purchasing the instrument. If this happens, then the entrance will require any absorption pattern to form on a time frame of at least m30. It is necessary to close today's trading below the WCZ 1/2 to break the upward pattern. This will allow you to exit all long positions and consider sales on Monday.

https://forex-images.ifxdb.com/userfiles/20200717/analytics5f113a0393290.jpg

Daily CZ - daily control zone. The area formed by important data from the futures market, which changes several times a year.
Weekly CZ - weekly control zone. The zone formed by important marks of the futures market, which changes several times a year.
Monthly CZ - monthly control zone. The zone, which is a reflection of the average volatility over the past year.

Analysis are provided byInstaForex.

Re: InstaForex Analysis

Technical Analysis of GBP/USD for July 20, 2020:

Technical Market Outlook:
The GBP/USD pair has been seen trading inside of the narrow consolidation zone located between the levels of 1.2482 - 1.2668 for all the last week and nothing has changed yet. The volatility has decreased and the momentum is hovering around the level of fifty, so no clues from this indicator either. Only a sustained breakout above of below certain level can provide a clue regarding the next market move.

Weekly Pivot Points:
WR3 - 1.2834
WR2 - 1.2735
WR1 - 1.2648
Weekly Pivot - 1.2555
WS1 - 1.2463
WS2 - 1.2373
WS3 - 1.2271

Trading Recommendations:
On the GBP/USD pair the main trend is down, which can be confirmed by the down candles on the weekly time frame chart. The key long-term technical support has been recently violated (1.1983) and the new one is seen at the level of 1.1404. The key long-term technical resistance is seen at the level of 1.3518. Only if one of these levels is clearly violated, the main trend might reverse (1.3518) or accelerate (1.1404). The market might have done a Double Top pattern at the level of 1.2645, so the price might move even lower in the longer-term.

https://forex-images.ifxdb.com/userfiles/20200720/analytics5f15336017af4.jpg

Analysis are provided byInstaForex.

Re: InstaForex Analysis

Technical Analysis of BTC/USD for July 21, 2020:

Crypto Industry News:
The underground of the Internet, or darknet, is that part of the web that is beyond the reach of traditional browsers and search engines. There are tons of digital markets in this network where all kinds of illegal goods are traded and paid for with cryptocurrencies.

In a State of Crypto Crimes report released earlier this year, blockchain analyst Chainalysis investigated crimes committed using cryptography, among them darknet transactions, which were the most consistent. In 2019, revenues from online underground markets hit a new record of $ 790 million.

While indicators on all financial fronts for these markets are rising, one aspect that remains much more consistent is the choice of cryptocurrency.

"The most popular cryptocurrency used by the darknet is Bitcoin," said Kim Grauer, head of research, and Carles Lopez-Penalver, senior cybercrime analyst at Chainlysis.

Among the altcoins used are Litecoin, Bitcoin Cash, and Monero. Even though only one of the three cryptos listed above has privacy features, the popular altcoins are widely used. However, some markets have seen exclusive use of Monero because of its encrypted web features, Chainalysis management said.

Altcoins are even more distant as operations grow in size and scale. According to Bitfury's Crystal Blockchain report, in the first quarter of 2020, darknet entities received more than $ 384 million in Bitcoin and more than $ 411 million was sent, where the recipients of these transactions are exchanges divided between those that have verification requirements and those that do not.

Unlike high-value Bitcoin transactions, Grauer and Lopez-Penalver added that altcoins are only used for smaller darknet transactions.

Technical Market Outlook:
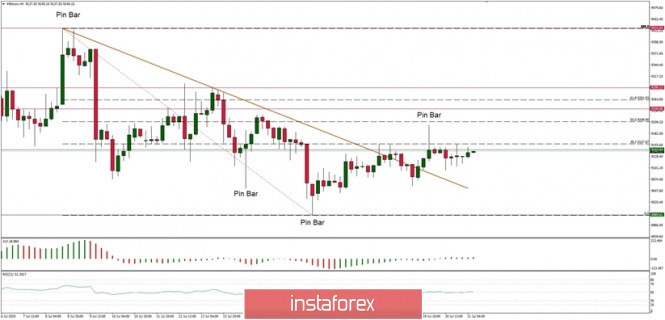
The BTC/USD pair has been trading around the 38% Fibonacci retracement of the last wave down that is located at the level of $9,157. The bears had pushed the price down from the local high made at the level of $9,201, but the price did not come back under the short-term trend line. The momentum remains neutral which indicates another sideways day. The next targets for bulls are seen at the levels of $9,209 and $9,261. The nearest technical support is located at $9,095.

Weekly Pivot Points:
WR3 - $9,569
WR2 - $9,411
WR1 - $9,271
Weekly Pivot - $9,117
WS1 - $8,968
WS2 - $8,812
WS3 - $8,862

Trading Recommendations:
The volatility on Bitcoin has been subdued for more than two months now, so the larger time frame trend remains down and as long as the level of $10,791 is not violated, all rallies will be treated as a counter-trend corrective moves. This is why the short positions are now more preferred until the level of $10,791 is clearly violated. The key mid-term technical support is located at the level of $7,897.
https://forex-images.ifxdb.com/userfiles/20200721/analytics5f16857442a1d.jpg

Analysis are provided byInstaForex.

Re: InstaForex Analysis

Forecast for EUR/USD on July 22, 2020

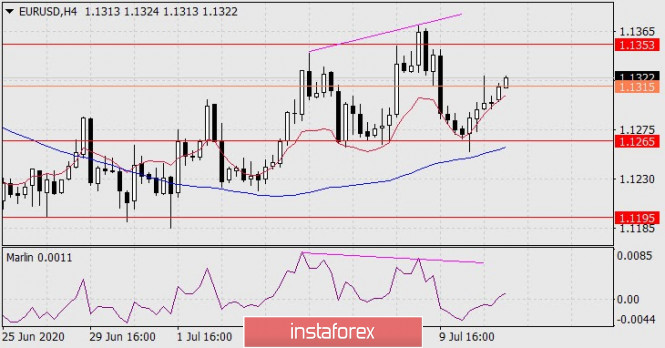
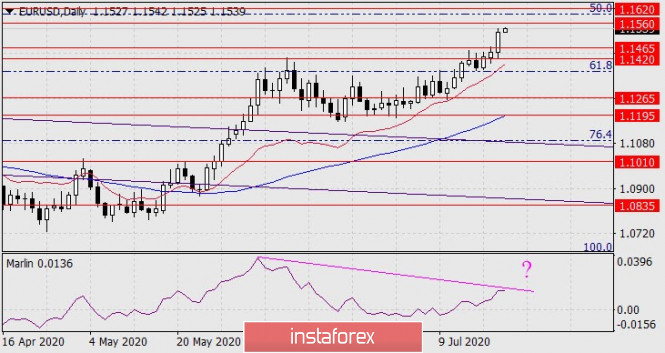
EUR/USD The euro rose by 78 points yesterday due to information that the 750 billion euro fund for the EU's recovery from coronavirus has finally been created. The momentum that the euro received could still grow towards the yet-to-be-reached target of 1.1560, possibly to 1.1620, but along with the fading news itself and local market overheating, which is signaled by the Marlin oscillator forming a divergence with the price, a subsequent reversal of the euro down into the range of 1.195-1.1265 is likely.

https://forex-images.ifxdb.com/userfiles/20200722/analytics5f17b2b701661.jpg

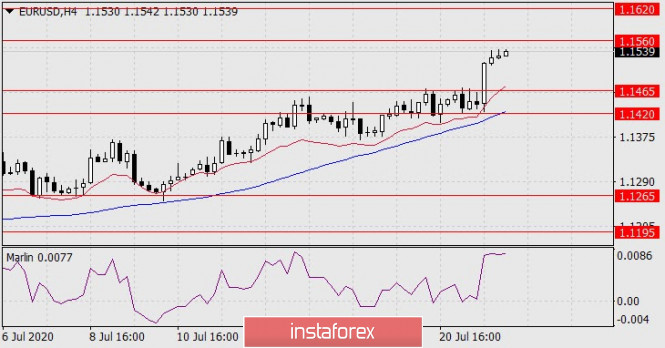
The price is growing above the balance and MACD lines on the H4 chart, the Marlin oscillator is actively growing and is close to overbought.

The current situation in the euro is such that it is no longer advisable to buy, and too early to sell. Even if we assume the option with a further medium-term rise of the single currency, it is better to wait for the price to pull back, which will occur, at least, in the range of 1.1420/65.

https://forex-images.ifxdb.com/userfiles/20200722/analytics5f17b2c9cc2c3.jpg

Analysis are provided byInstaForex.

Re: InstaForex Analysis

European Economics Preview: Germany GfK Consumer Confidence Data Due

https://forex-images.ifxdb.com/analysts/big_preview/obwii_obzor_rinok/7.jpg

Consumer confidence from Germany is due on Thursday, headlining a light day for the European economic news.

At 2.00 am ET, Germany's Gfk consumer confidence survey results are due. The forward-looking consumer sentiment index is expected to rise to -5 in August from -9.6 in July.

In the meantime, unemployment data is due from Statistics Norway. At 2.45 am ET, the statistical office Insee is scheduled to release France's business confidence survey data. Economists forecast the index to climb to 85 in July from 77 in June.

At 3.30 am ET, Statistics Sweden publishes unemployment data for June.

Half an hour later, unemployment data is due from Poland. The jobless rate is seen at 6.2 percent in June versus 6 percent in May.

At 6.00 am ET, the Confederation of British Industry is slated to issue Industrial Trends survey data. The order book balance is forecast to improve to -38 in July from -58 in June.

At 7.00 am ET, Turkey's central bank is set to announce its interest rate decision. The bank is expected to hold its one-week repo rate at 8.25 percent.

At 10.00 am ET, Eurozone flash consumer confidence survey data is due. The sentiment index is seen rising to -12 in July from -14.7 in June.

[url=https://www.instaforex.com/forex-news]News are provided by
InstaForex.[/url]

Re: InstaForex Analysis

Technical Analysis of EUR/USD for July 24, 2020:

https://forex-images.ifxdb.com/userfiles/20200724/analytics5f1a8297a2b14.jpg

Technical Market Outlook:
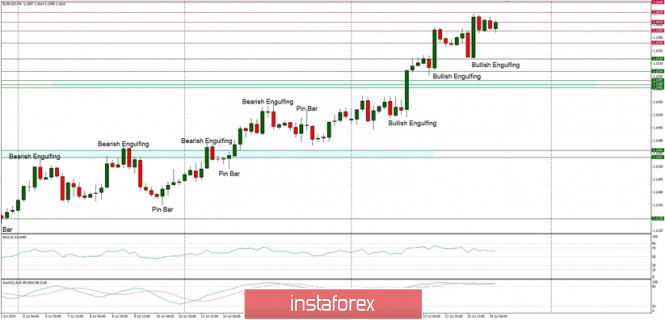
After the EUR/USD pair had broken through the long-term technical resistance located at the level of 1.1540, the up trend has been confirmed and it is being continued. Currently, the market is trying to extend the rally towards the level of 1.1629 or higher towards the level of 1.1648. The momentum is still strong and positive, but the market conditions are now overbought, so please keep in mind the pull-back scenario during the trading activities. If the support zone seen at the levels of 1.1497 - 1.1483 is clearly violated, then the bigger correction can take place with a target at the level of 1.1361 - 1.1347.The most important for bulls will be the weekly (2 days left) and monthly close (6 days left).

Weekly Pivot Points:
WR3 - 1.1642
WR2 - 1.1541 WR1 - 1.1496
Weekly Pivot - 1.1397
WS1 - 1.1342
WS2 - 1.1243
WS3 - 1.1193

Trading Recommendations:
The key long-term technical resistance is seen at the level of 1.1540 has been violated, so the EUR/USD pair confirmed the up trend. The next targets in the long-term are seen at the levels of 1.1813 - 1.1851. There is no indication of any bigger correction to come, so all the dips should be bought until the level of 1.1347 is clearly violated.

Analysis are provided byInstaForex.
Re: InstaForex Analysis

Technical Analysis of GBP/USD for July 27, 2020:

https://forex-images.ifxdb.com/userfiles/20200727/analytics5f1e6a87711e7.jpg

Technical Market Outlook:
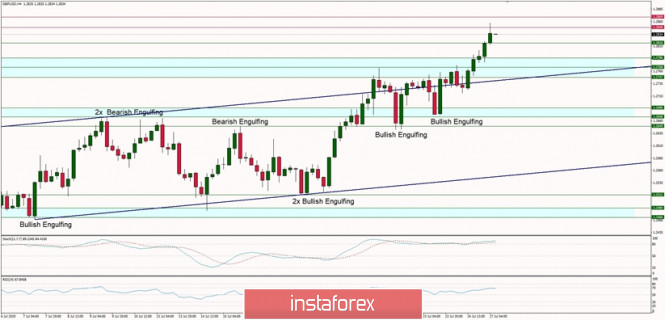
The GBP/USD pair has been moving up since the market opened after the weekend, so the new temporary swing high was made at the level of 1.2857. Moreover, the bulls had broken out from the ascending channel, which is rather another confirmation of the positive sentiment despite the overbought market conditions. The next target for bulls is seen at the level of 1.2869 and 1.2900. The nearest support is seen at the level of 1.2816 and 1.2786.

Weekly Pivot Points:
WR3 - 1.3215
WR2 - 1.2993
WR1 - 1.2929
Weekly Pivot - 1.2717
WS1 - 1.2632
WS2 - 1.2427
WS3 - 1.2355

Trading Recommendations:
On the GBP/USD pair the main trend is down, which can be confirmed by the down candles on the weekly time frame chart. The key long-term technical support is seen at the level of 1.1404. The key long-term technical resistance is seen at the level of 1.3518. Only if one of these levels is clearly violated, the main trend might reverse (1.3518) or accelerate (1.1404).

Analysis are provided byInstaForex.
Re: InstaForex Analysis

Forecast for EUR/USD on July 28, 2020

EUR/USD
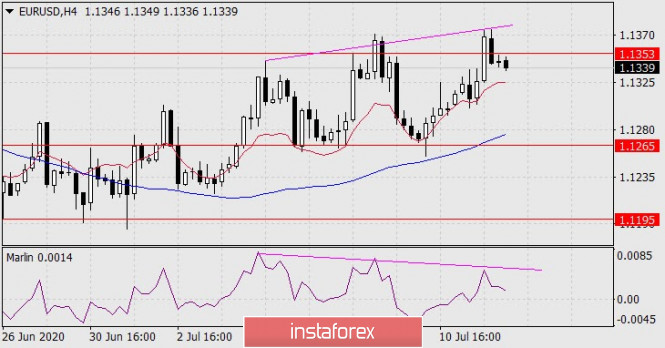
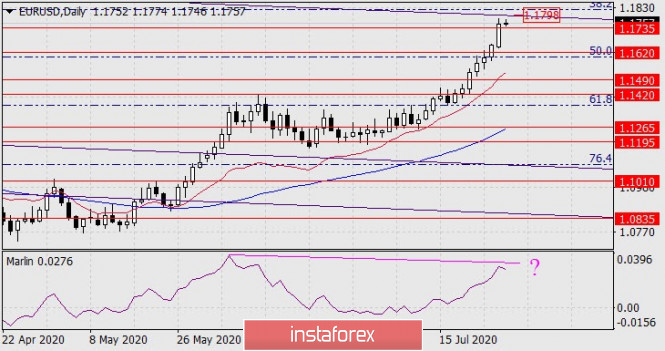
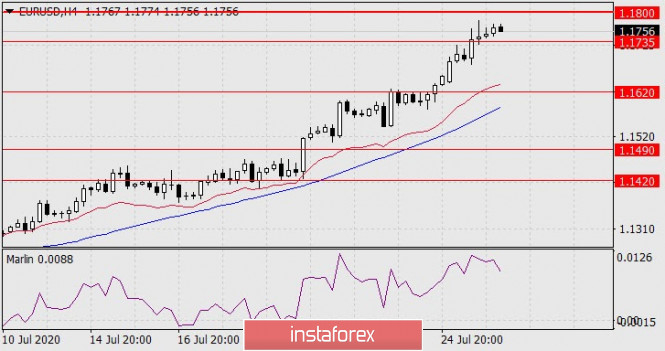
The euro decided to play its role to the end. Yesterday the price exceeded the target level of 1.1735, closing the day by gaining 96 points. Now the price should reach the upper border of the price channel around 1.1800. With the price level and the Marlin oscillator developing, divergence persists, respectively, we are waiting for the price to reverse down in the medium term. The timing may coincide that a reversal from such a key level will occur tomorrow, that is, on the day of the Federal Reserve's announcement of its decision on monetary policy.

https://forex-images.ifxdb.com/userfiles/20200728/analytics5f1fae44af51f.jpg

The oscillator shows a timid attempt to reverse against the rising price on the four-hour chart. This could be noise, or it could be warning a reversal. But since the Fed announces its decision tomorrow, the situation will be resolved on Wednesday.

https://forex-images.ifxdb.com/userfiles/20200728/analytics5f1fae5770b65.jpg

The main issue that concerns investors is the Fed's intention to target the yield curve for government bonds. If they hint that this is not necessary, the dollar will get a fresh dose of optimistic mood.


Analysis are provided byInstaForex.
Re: InstaForex Analysis

Control zones for USDCAD on 07/29/20

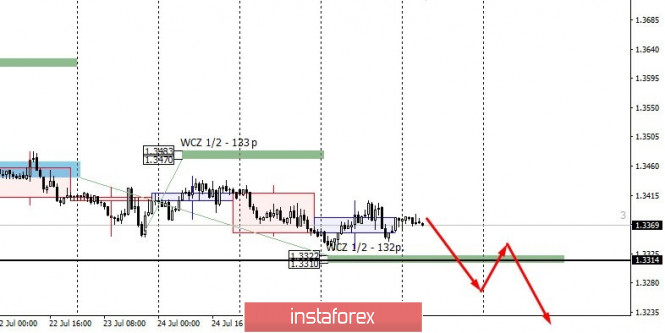
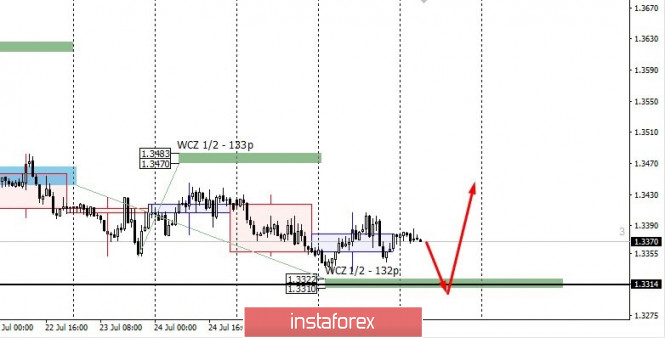
The fall of the pair is a priority, so keeping sales will be beneficial. The 1.3314 level is within the average daily move, which is the June low. A test of this level will increase the likelihood of a large demand.

https://forex-images.ifxdb.com/userfiles/20200729/analytics5f21051c10a9e.jpg

It is important to note that the June low coincides with WCZ 1/2 1.3322-1.3310. This indicates the importance of the range for making trading decisions.

An alternative pattern of continuing the fall will develop if the close of today's trading occurs below 1.3314. This will increase the likelihood of the Canadian dollar strengthening even further

https://forex-images.ifxdb.com/userfiles/20200729/analytics5f21052de1310.jpg

Daily CZ - daily control zone. The area formed by important data from the futures market, which changes several times a year.

Weekly CZ - weekly control zone. The zone formed by important marks of the futures market, which changes several times a year.

Monthly CZ - monthly control zone. The zone, which is a reflection of the average volatility over the past year.

Analysis are provided byInstaForex.
Re: InstaForex Analysis

Forecast for EUR/USD on July 30, 2020

EUR/USD
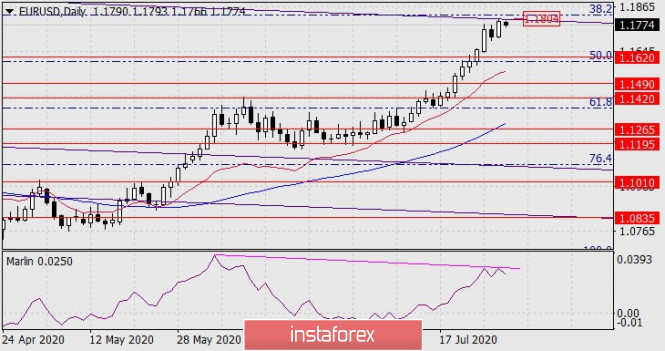
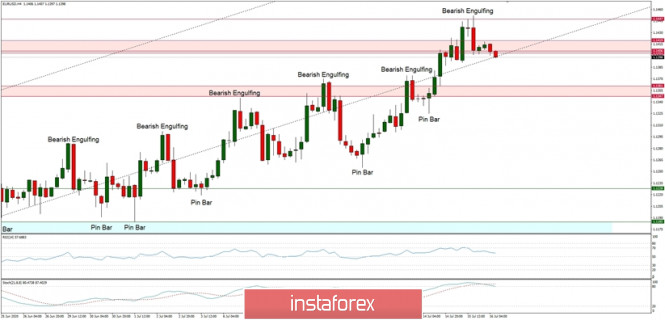
Yesterday, the euro fulfilled its irresistible and inextinguishable desire to work out the border of the global price channel at around 1.1804. This channel originates from the July 2008 high. The price begins to form a divergence with the Marlin Oscillator. The first target of the decline is 1.1620.

https://forex-images.ifxdb.com/userfiles/20200730/analytics5f223d5f4bc6b.jpg

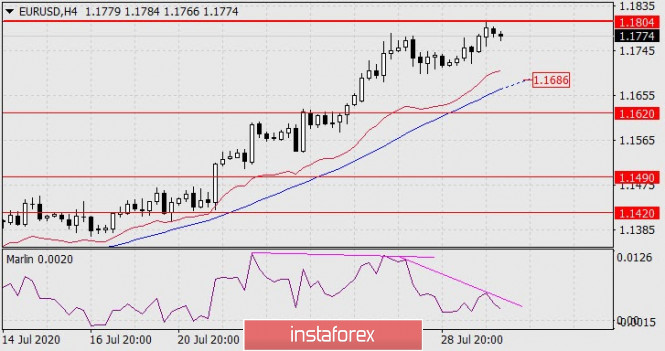
The Marlin divergence looks unambiguous on the four-hour chart, and it was created twice in a row. We are waiting for the price to move to the target level of 1.1620. On the way to it, the price will face an obstacle in the form of the MACD line in the area of 1.1686.

https://forex-images.ifxdb.com/userfiles/20200730/analytics5f223d7396a69.jpg

Analysis are provided byInstaForex.
Re: InstaForex Analysis

Technical Analysis of EURUSD for August 3, 2020:

https://forex-images.ifxdb.com/userfiles/20200803/analytics5f27a7b239fba.jpg

Technical Market Outlook:
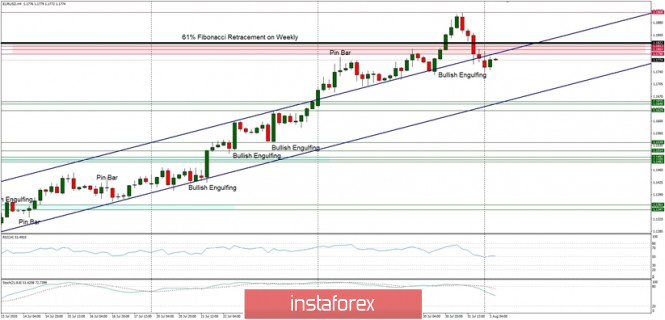
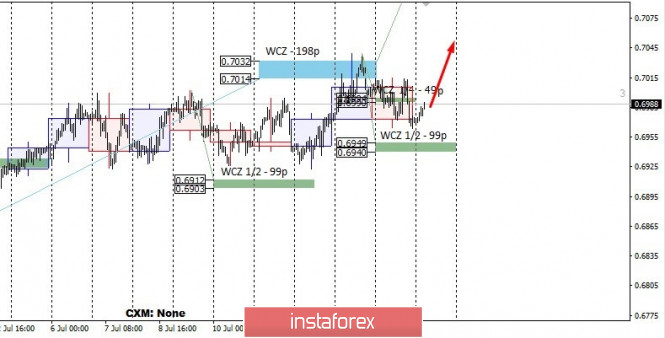
The EUR/USD pair has made a new swing low at the level of 1.1908, but the Bearish Engulfing candlestick pattern was made at the top of the move. The market has returned then below 61% Fibonacci retracement on weekly time frame chart (seen at 1.1822) and is now back in the ascending main channel. The momentum is neutral and the market is coming off the overbought conditions, so the next target for bears is seen at the level of 1.1655 - 1.1629. If the market hits this level, then the healthy correction is completed and the up trend might be resumed.

Weekly Pivot Points:
WR3 - 1.2175
WR2 - 1.2036
WR1 - 1.1886
Weekly Pivot - 1.1756
WS1 - 1.1625
WS2 - 1.1507
WS3 - 1.1369

Trading Recommendations:
The EUR/USD pair confirmed the up trend, so all pull-backs and corrections should be used to acumulate the EUR. The next targets in the long-term are seen at the levels of 1.2000 - 1.2089. There is no indication of any bigger correction to come, so all the dips should be bought until the level of 1.1347 is clearly violated.

Analysis are provided byInstaForex.
Re: InstaForex Analysis

Forecast for AUD/USD on August 4, 2020

AUD/USD
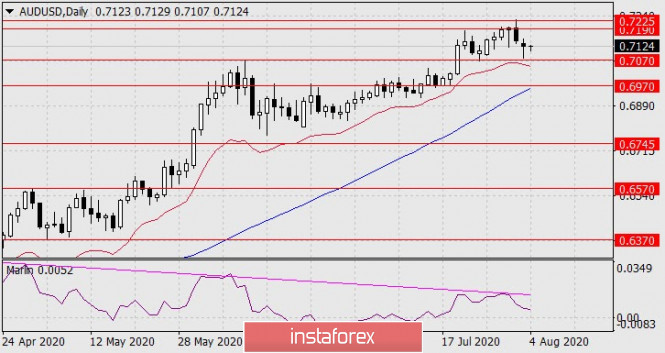
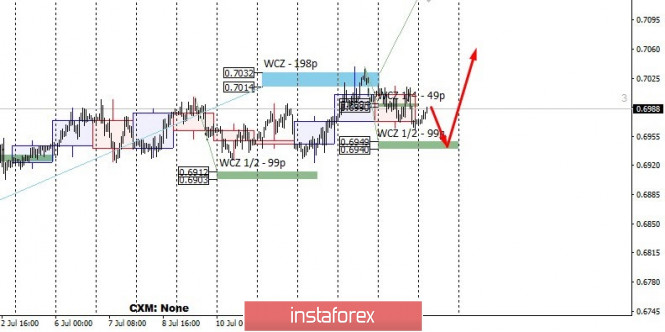
The Australian dollar nearly hit its first bearish target of 0.7070 on Monday. And since the technical situation is still decreasing, even intensified somewhat, today we expect the price to attack support at 0.7070. Success will contribute to further decline to the target level of 0.6970, which was approached by the MACD indicator line. Thus, the level acquires strategic importance - breaking it will trigger a mid-term decline of the aussie": the target is 0.6570 - the high on April 30.

https://forex-images.ifxdb.com/userfiles/20200804/analytics5f28d4e3e20c4.jpg

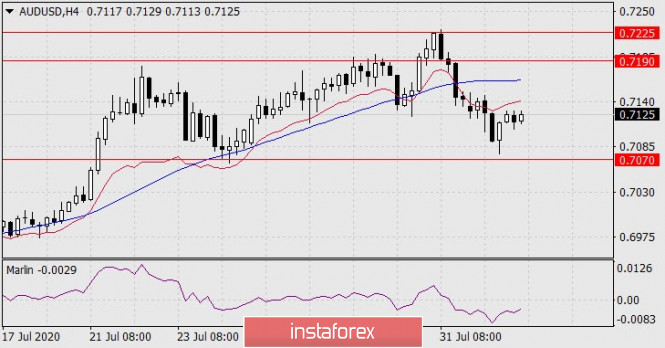
The price is developing under the balance and MACD indicator lines on the four-hour chart, Marlin in the downward trend zone. There are no signs of a reversal, we are waiting for the price to try to gain a foothold below the 0.7070 level.

https://forex-images.ifxdb.com/userfiles/20200804/analytics5f28d4f69c004.jpg

Analysis are provided byInstaForex.
Re: InstaForex Analysis

Technical Analysis of GBP/USD for August 5, 2020:

Technical Market Outlook:
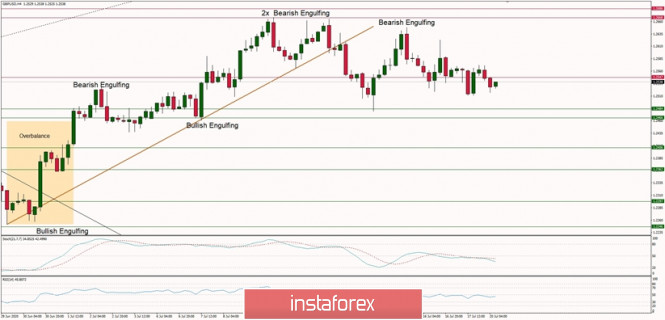
The up trend on GBP/USD pair is developing despite some local pull-backs as the bulls has broken through the short-term trend line resistance located around the level of 1.3080. The local high was made at the level of 1.3098 so far, but the market is bouncing from the oversold conditions, so the bulls might try to attack the recent swing high located at the level of 1.3169 soon. Only a sustained breakout below the level of 1.2980 would change the short-term market sentiment and deepen the correction towards the level of 1.2869.

Weekly Pivot Points:
WR3 - 1.3655
WR2 - 1.3405
WR1 - 1.3252
Weekly Pivot - 1.2996
WS1 - 1.2877
WS2 - 1.2627
WS3 - 1.2492

Trading Recommendations:
On the GBP/USD pair the main trend is down, which can be confirmed by the down candles on the weekly time frame chart. The key long-term technical support is seen at the level of 1.1404. The key long-term technical resistance is seen at the level of 1.3518. Only if one of these levels is clearly violated, the main trend might reverse (1.3518) or accelerate (1.1404).

https://forex-images.ifxdb.com/userfiles/20200805/analytics5f2a48d292b58.jpg

Analysis are provided byInstaForex.

Re: InstaForex Analysis

Technical Analysis of ETH/USD for August 6, 2020:

Crypto Industry Outlook:
The launch of the Ethereum Medalla test network, scheduled for 1pm, did not go as smoothly as expected. While the network was successfully launched and offered a sufficient number of blocks at its supposed time of construction, the participation rate was only 57% - well below the expected 80%.

This means that only 57% of the rate is implemented for network validation. This is a serious problem because block finality cannot be achieved until the network starts cutting off validators that are offline. Finality means that the block history is irreversible, which is equivalent to the block confirmation threshold in Ethereum 1.0. According to the developers, this could be because many validators signed up by paying 32 ETH without running the validation software. However, customer issues with Nimbus and Lodestar could account for around 10% of that participation gap, said Danny Ryan of the Ethereum Foundation.

The network is expected to fix the problem on its own as inactive validators are kicked out, however it may take at least several hours to restore the finality. Meanwhile, developers investigate customer issues.

Technical Market Outlook:
The ETH/USD pair has broken out from the narrow range located between the levels of $379.59 - $392.79 and made a new local high at the level of $407.03. For now the price is trading close to the recent ATH, around the level of $400 again and the up trend is still being continued. The next target for bulls is seen at the level of $414 and $425.25. The key short-term support is seen at the level of $300. The momentum is still strong and positive, which supports the short-term bullish outlook.

Weekly Pivot Points:
WR3 - $532.98
WR2 - $470.84
WR1 - $423.16
Weekly Pivot - $365.99
WS1 - $312.04
WS2 - $255.55
WS3 - $208.47

Trading Recommendations:
Due to the violation of the level of $351, Ethereum is now in the up trend on the long-term time frame. The next target for bulls is seen at the level of $500. The key long-term technical support is located at the level of $86.10, but the zone around $300 - $308 is an important technical support as well.

https://forex-images.ifxdb.com/userfiles/20200806/analytics5f2ba21351e3a.jpg

Analysis are provided byInstaForex.
Re: InstaForex Analysis

Technical Analysis of BTC/USD for August 7, 2020:

https://forex-images.ifxdb.com/userfiles/20200807/analytics5f2ce852e5e04.jpg

Crypto Industry News:
Someone with access to 119,756 Bitcoins stolen from the Bitfinex cryptocurrency exchange in 2016 transferred $ 12 million to unknown wallets in the last six days.

According to a series of tweets posted by Whale Alert on Twitter on August 3, wallet addresses known to be linked to one of the largest attacks in the history of cryptocurrency exchanges resulted in the transfer of 620 Bitcoins - with a current value of around $ 7 million - using 4 transactions. On July 29, nearly $ 5 million - or 448 BTC - was transferred in a single transaction. Coupled with the last move of $ 39 million from July 27-28, this is about $ 51 million in Bitcoin that was transferred in over 17 transactions during the week.

On August 2, 2016, hackers compromised Bitfinex by stealing 119,756 BTC - worth $ 72 million at the time. After four years and recent growth movements, their total value is now $ 1.3 billion.

However, despite the recent movement of $ 51 million, burglars only transferred 1-2% of stolen funds. This suggests that criminals may struggle as they enforce the new anti-money laundering (AML) laws.

Technical Market Outlook:
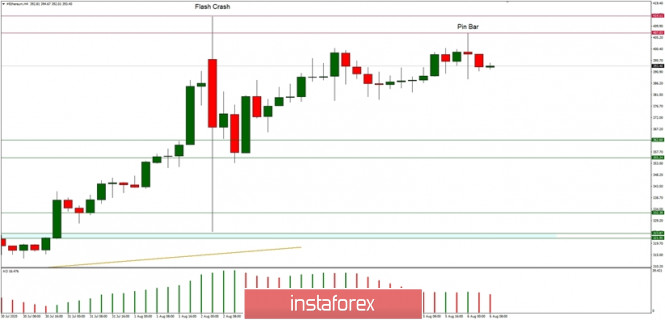
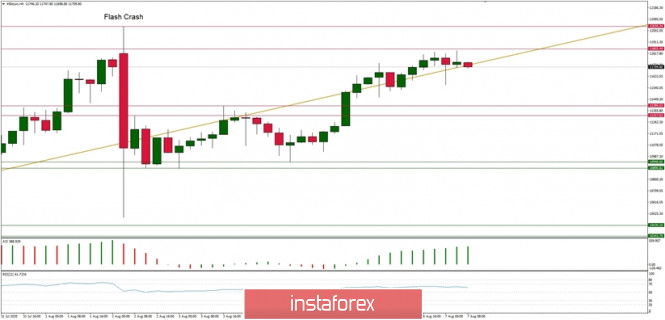
The BTC/USD pair keeps hovering around this year's highs and the market sentiment is clearly bullish. The price has broken out from a narrow zone located between the levels of $10,895 - $11,317 and then the local high was made at the level of $11,738 on increased momentum, so bulls are showing their strength. The next target for bulls is of course the last yearly high seen at the level of $12,035. The immediate support for the intraday traders are seen at the levels of $11,646, $11,395 and $11, 317. The volatility is now quite subdued, but it might increase again once any important technical level is tested and broken.

Weekly Pivot Points:
WR3 - $14,325
WR2 - $13,003
WR1 - $12,116
Weekly Pivot - $10,976
WS1 - $9,784
WS2 - $8,681
WS3 - $7,717

Trading Recommendations: Due to the level of $12,000 violation, the Bitcoin is now in the up trend on the long-term time frame. The next target for bulls is seen at the level of $13,712 and $15,000. The key long-term technical support is located at the level of $7,897, but the zone around $9,500 - $10,500 is an important technical support as well.

Analysis are provided byInstaForex.
Re: InstaForex Analysis

Technical Analysis of GBP/USD for August 10, 2020:

https://forex-images.ifxdb.com/userfiles/20200810/analytics5f30df8936cc7.jpg

Technical Market Outlook:
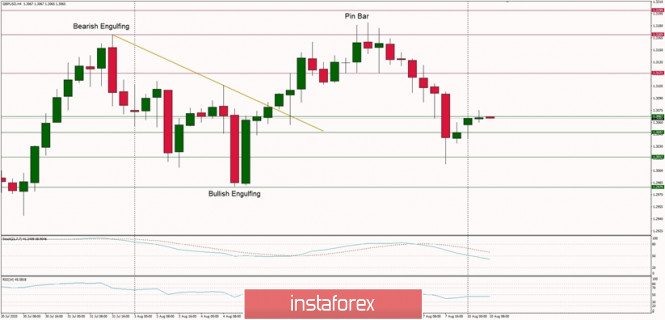
The GBP/USD pair has been seen moving lower in the recent pull-back. The bears has hit the level of 1.3008 and then the bulls has pushed the rate back towards the level of 1.3067. This is where the Pound starts the early Monday trading and overall is still consolidating the gains despite the recent local pull-backs. The key technical support is seen at the level of 1.2979, so as long as the market trades above it, the odds for another wave up are high.

Weekly Pivot Points:
WR3 - 1.3353
WR2 - 1.3261
WR1 - 1.3146
Weekly Pivot - 1.3060
WS1 - 1.2937
WS2 - 1.2860
WS3 - 1.2735

Trading Recommendations:
On the GBP/USD pair the main trend is down, which can be confirmed by the down candles on the weekly time frame chart. The key long-term technical support is seen at the level of 1.1404. The key long-term technical resistance is seen at the level of 1.3518. Only if one of these levels is clearly violated, the main trend might reverse (1.3518) or accelerate (1.1404).

Analysis are provided byInstaForex.

Re: InstaForex Analysis

Forecast for EUR/USD on August 11, 2020

EUR/USD
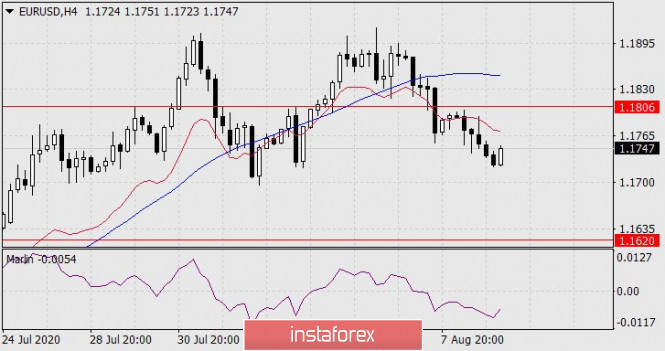
The euro is slowly moving towards its target at 1.1620 (high on October 16, 2018). The Marlin oscillator is declining, remaining in the positive trend zone. As the price moves below the target level of 1.1620, Marlin will obviously already be in a negative, that is, a downward trend. As a result, we are waiting for the new downward movement to strengthen in a new emerging trend. After the price leaves the area below 1.1620, the second target at 1.1490 will open, where the price can meet the MACD line.

https://forex-images.ifxdb.com/userfiles/20200811/analytics5f3217c1dcd94.jpg

The decline is taking its course on the four-hour chart; the price is below the balance indicator lines (the balance has strengthened in a downward direction), the MACD line is moving down, that is, the medium-term trend has changed to a downward one. Marlin is also slowly deepening into the zone of negative values, into the zone of the bears' possession.

https://forex-images.ifxdb.com/userfiles/20200811/analytics5f3217d4a35d4.jpg

Analysis are provided byInstaForex.
Re: InstaForex Analysis

Forecast for EUR/USD on August 12, 2020

EUR/USD
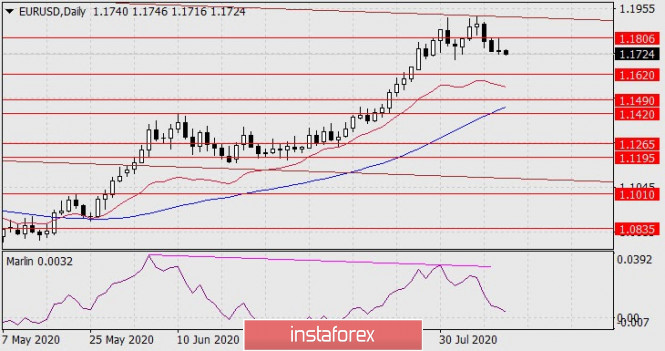
The euro and other counterdollar currencies rallied during the first half of Tuesday, on what appears to be profit taking in the first short sales since Friday. The ZEW economic sentiment index in Germany jumped from 59.3 to 71.5 in August against expectations of 58.0 points. The index was higher only in February 2004 (72.9). But this indicator, and especially at this time, has a strong psychological component; it is compiled on the basis of surveys of business representatives who, as always, expect an improvement in their prospects. This was confirmed by the index of current economic conditions ZEW, which showed a drop in the index from -80.9 to -81.3, and against the forecast of growth to -68.8.

https://forex-images.ifxdb.com/userfiles/20200812/analytics5f336b61daaf7.jpg

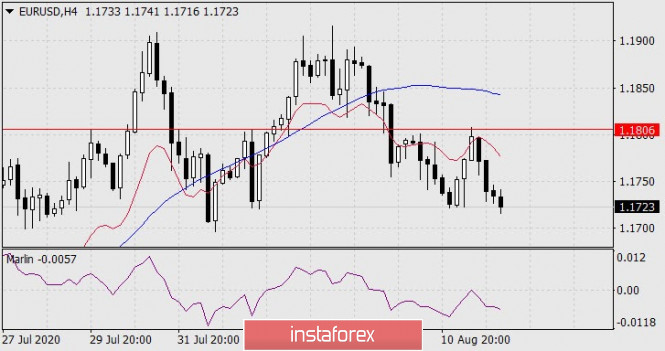
The dollar went on the offensive in the afternoon and as a result the euro closed the day at the opening price. The situation has not changed for the euro on the technical side, the price is heading towards its 1.1620 target. The Marlin oscillator is even closer to the border of the negative trend territory. Its introduction will ease the euro's fall.

https://forex-images.ifxdb.com/userfiles/20200812/analytics5f336b74624d7.jpg

Yesterday's growth stopped by the target level of 1.1806 on the four-hour chart. The level has confirmed its strength, now the price can have no doubts about choosing a direction. The first target is 1.1620.

Analysis are provided byInstaForex.
Re: InstaForex Analysis

Control zones for EURUSD on 08/13/20

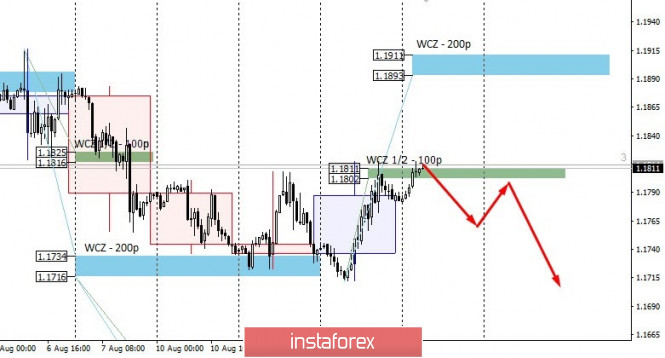
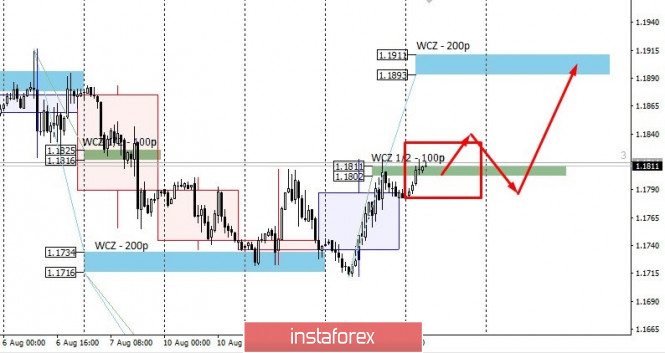
We are testing the WCZ 1/2 1.1811-1.1802 today, which is a defining moment when building a trading plan. If today's trade closes below the zone, then sales of the instrument will come to the fore, and the first target of the fall will be the current week's low.

https://forex-images.ifxdb.com/userfiles/20200813/analytics5f34d41d1e16a.jpg

Working in a downward direction will make it possible for us to continue forming a downward compensatory pattern, the goal of which is to return to the monthly control zone in July.

If today's trade closes above the WCZ 1/2, it will enable us to look for purchases at tomorrow's European session. The growth target will be the weekly CZ 1.1911-1.1893. Working in an upward direction will not violate the accumulation zone that has already formed. The main growth boundary is still the monthly high.

https://forex-images.ifxdb.com/userfiles/20200813/analytics5f34d42f11715.jpg

.Daily CZ - daily control zone. The area formed by important data from the futures market, which changes several times a year.

Weekly CZ - weekly control zone. The zone formed by important marks of the futures market, which changes several times a year.

Monthly CZ - monthly control zone. The zone, which is a reflection of the average volatility over the past year.

Analysis are provided byInstaForex.
Re: InstaForex Analysis

Forecast for EUR/USD on August 14, 2020

EUR/USD
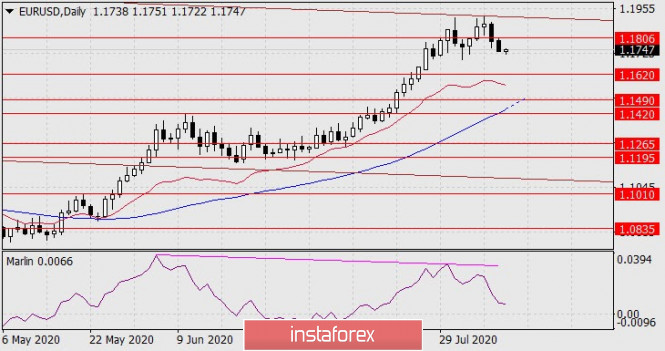
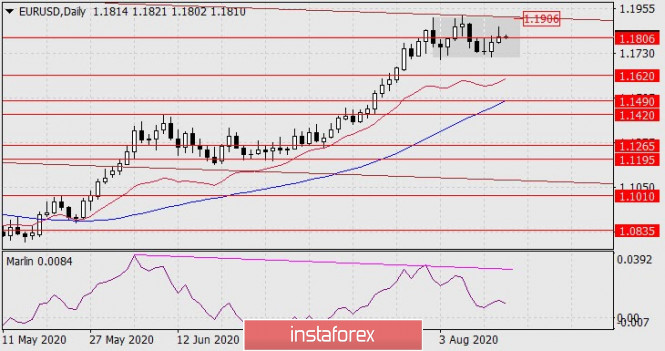
The euro's 28 points gain from yesterday plunged into a wide range of uncertainty and wandered through 1.1710-1.1906. The Marlin oscillator is directed downwards on the daily chart, and the price is exactly at the 1.1806 target level. The price could reach the upper border of the price channel at 1.1906 without a critical upward reversal of the oscillator. The price may even cross this border and a double divergence will not form according to the oscillator, which creates increased uncertainty for the currency pair.

https://forex-images.ifxdb.com/userfiles/20200814/analytics5f360a261bb4a.jpg

For a medium-term downward movement, it is no longer enough for the price to gain a foothold below the 1.1806 level, it should consolidate below the lower border of the 1.1710 range.

The situation is no less uncertain on the four-hour chart. The Marlin oscillator is in the growth zone, the price is above the balance line, but below the MACD line.

Trading the euro today and even on Monday is associated with increased risk.

Analysis are provided byInstaForex.
Re: InstaForex Analysis

Forecast for EUR/USD on August 17, 2020

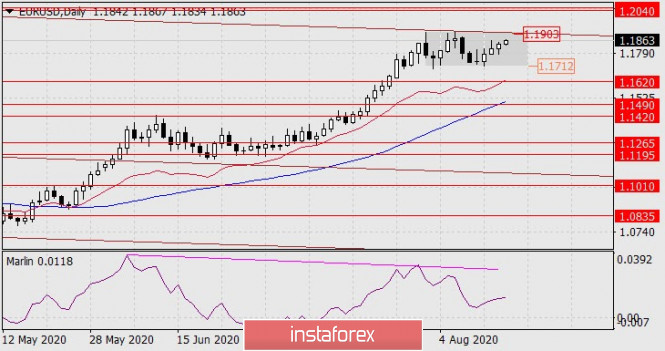
EUR/USD The euro continued to develop in the uncertain range of 1.1712-1.1903 on Friday. The euro will continue to increase if the price goes above the upper limit of the price channel at 1.1903, and in this case, the target range will be 1.2040/55. Historically, the range corresponds to the low of July 2012. The price reaching the specified range can also mean that a double diverenge on the Marlin oscillator can form. That is, the euro growing by two figures will not cancel the main scenario of a currency reversal in the medium and long term.

https://forex-images.ifxdb.com/userfiles/20200817/analytics5f39fdad08330.jpg

The price falling below the lower border of the range will mean that it is out of the free roaming zone and the first target will be the level of 1.1620, then 1.1490. The price divergence with the Marlin oscillator will increase, the signal line will enter the zone of negative values, and this will lead to an accelerated fall in the euro.

https://forex-images.ifxdb.com/userfiles/20200817/analytics5f39fdbf94c6e.jpg

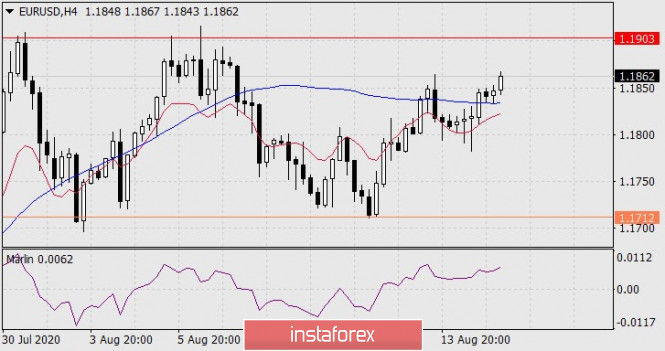
The price consolidated above the MACD indicator line on the four-hour chart, Marlin is also in the growth zone, which together maintains an increased probability of growth to 1.1903. Nevertheless, since the price is in the free roaming zone, it can once again go under this line, as it was on August 13-14. We are waiting for the development of events.

Analysis are provided byInstaForex.
Posts: 601 to 625 of 1,547

Pages Previous 1 23 24 25 26 27 62 Next

You must login or register to post a reply

Forex Software → Market Analysis → InstaForex Analysis

Similar topics in this forum