forex software

Create and Test Forex Strategies

forex software

Skip to forum content

Forex Software

Create and Test Forex Strategies

You are not logged in. Please login or register.


(Page 23 of 62)

Forex Software → Market Analysis → InstaForex Analysis

Pages Previous 1 21 22 23 24 25 62 Next

You must login or register to post a reply

RSS topic feed

Posts: 551 to 575 of 1,547

Re: InstaForex Analysis

Forecast for GBP/USD on May 4, 2020

GBP/USD
The British pound lost 100 points on Friday, which strengthened the reversal potential and the convergence power of the Marlin oscillator on the daily chart.

https://forex-images.ifxdb.com/userfiles/20200504/analytics5eaf8e901362a.jpg

To completely form conditions for the price to go down, it is necessary to gain a foothold under the MACD line (1.2365), while the Marlin signal line must go into the zone of negative values.

https://forex-images.ifxdb.com/userfiles/20200504/analytics5eaf8ea3f3b98.jpg

Marlin is already in the decreasing trend zone on the four-hour chart, the price should overcome the support of the MACD line (1.2405). The support of the MACD line of the daily scope runs a little lower, in the region of 1.2365, therefore, the 1.2365-1.2405 range is transitional, it is possible to consolidate in this range.

An attempt to move the price under technical support may occur after a preliminary increase to 1.2540 or slightly lower without breaking convergence on a daily basis. The current situation is not defined under any scenario, the price can freely wander in the range of 1.2365-1.2540.

Analysis are provided byInstaForex.

Best regards, PR Manager / Learn more about InstaForex Company at http://instaforex.com

Re: InstaForex Analysis

Technical Analysis of GBP/USD for 05/05/2020:

https://forex-images.ifxdb.com/userfiles/20200505/analytics5eb0fac37ffa8.jpg

Technical Market Outlook:
The GBP/USD pair has made a local low at the level of 1.2406, just above the 61% Fibonacci retracement located at 1.2397. Any violation of this level will open the road towards the next target for bears seen at 1.2310. There is a short-term ascending trend line close to this level, so it might get tough for bears to violate it in one go. Please notice, the market is coming off the overbought levels and the momentum indicator is neutral, but when it turn south, then the sell-off might accelerate towards 1.2246 level.

Weekly Pivot Points:
WR3 - 1.2909
WR2 - 1.2757
WR1 - 1.2605
Weekly Pivot - 1.2476
WS1 - 1.2324
WS2 - 1.2200
WS3 - 1.2054

Trading Recommendations:
The fear of the coronavirus consequences is very strong among the global investors and it rules on the financial markets. On the GBP/USD pair the main trend is down, but the reversal is possible when the corona virus pandemic will be tamed. The key long-term technical support has been recently violated (1.1983) and the new one is seen at the level of 1.1404. The key long-term technical resistance is seen at the level of 1.3518. Only if one of this levels is clearly violated, the main trend might reverse (1.3518) or accelerate (1.1404). The market might have done a Double Top pattern at the level of 1.2645, so the price might move lower in the longer-term.

Analysis are provided byInstaForex.

Best regards, PR Manager / Learn more about InstaForex Company at http://instaforex.com

Re: InstaForex Analysis

Technical Analysis of EUR/USD for 06/05/2020:

https://forex-images.ifxdb.com/userfiles/20200506/analytics5eb244fff3ec7.jpg

Technical Market Outlook:
The EUR/USD bears have manage to push the prices through the short-term support located at the level of 1.0893 and through the trend line support as well. The momentum is now negative, so the odds for another dynamic wave up are decreasing. If the 61% Fibonacci retracement gets clearly violated, then the next technical support is seen at the level of 1.0779 and if broken, the sell-off might accelerate towards 1.0727.

Weekly Pivot Points:
WR3 - 1.1279
WR2 - 1.1141
WR1 - 1.1073
Weekly Pivot - 1.0940
WS1 - 1.0861
WS2 - 1.0728
WS3 - 1.0662

Trading Recommendations:
The fear of the coronavirus consequences is very strong among the global investors and this fear still rules on the financial markets. On the EUR/USD pair the main long term trend is down, but the reversal is possible when the coronavirus pandemic will be tamed. The key long-term technical support is seen at the level of 1.0336 and the key long-term technical resistance is seen at the level of 1.1540. Only if one of this levels is clearly violated, the main trend might reverse (1.1540) or accelerate (1.0336).

Analysis are provided byInstaForex.

Best regards, PR Manager / Learn more about InstaForex Company at http://instaforex.com

Re: InstaForex Analysis

Technical Analysis of GBP/USD for 07/05/2020:

https://forex-images.ifxdb.com/userfiles/20200507/analytics5eb39f51932e3.jpg

Technical Market Outlook:
The GBP/USD pair has broken below the short-term trend line support and below the technical support from the level of 1.2406. Please notice, the momentum indicator is now negative, so the sell-off might accelerate towards 1.2246 level. It looks like bulls are not strong enough to push the price above the level of 1.2485 again and the price is consolidating in a narrow zone before the plunge.

Weekly Pivot Points:
WR3 - 1.2909
WR2 - 1.2757
WR1 - 1.2605
Weekly Pivot - 1.2476
WS1 - 1.2324
WS2 - 1.2200
WS3 - 1.2054

Trading Recommendations:
The fear of the coronavirus consequences is very strong among the global investors and it rules on the financial markets. On the GBP/USD pair the main trend is down, but the reversal is possible when the corona virus pandemic will be tamed. The key long-term technical support has been recently violated (1.1983) and the new one is seen at the level of 1.1404. The key long-term technical resistance is seen at the level of 1.3518. Only if one of this levels is clearly violated, the main trend might reverse (1.3518) or accelerate (1.1404). The market might have done a Double Top pattern at the level of 1.2645, so the price might move lower in the longer-term.

Analysis are provided byInstaForex.

Best regards, PR Manager / Learn more about InstaForex Company at http://instaforex.com

Re: InstaForex Analysis

Technical Analysis of ETH/USD for 08/05/2020:

https://forex-images.ifxdb.com/userfiles/20200508/analytics5eb4ec047b913.jpg

Crypto Industry News:
The Commodity and Futures Commission (CFTC) has charged US and Israeli companies with alleged fraud of $ 15 million, including cryptocurrencies and binary options. Court documents mention two major frauds, the first of which occurred between October 2013 and November 2016 and concerns binary options. The second concerns digital resources such as Bitcoin and Ethereum, which took place from November 2013 to August 2018.

CFTC charged Tal Valariola and Itayea Baraka of Digital Platinum Limited for helping the American company All In Publishing (AIP) to create and promote numerous misleading investment programs among US and foreign investors.

During the allegedly misleading marketing campaign, as many as 51.917 users opened a binary options account and deposited a total of almost $ 13 million. In addition, 8,043 users opened a digital asset trading account, depositing a total of over $ 2 million.

Technical Market Outlook:
The ETH/USD pair has again bounced from 38% Fibonacci retracement located at the level of $195.94 and violated the short-term trend line resistance around the level of $205.23. The bulls are continuing the rally towards the level of $214.67, but so far were rejected from this level. There is a Bearish Engulfing pattern made around this level, so the rally might be temporary postponed. The nearest technical support is now seen at the level of $209.89.

Weekly Pivot Points:
WR3 - $296.61
WR2 - $243.36
WR1 - $224.05
Weekly Pivot - $205.69
WS1 - $188.49
WS2 - $168.64
WS3 - $150.80

Trading Recommendations:
The fear of the coronavirus consequences is very strong among the global investors and it rules on the financial markets. So far the global investors are not so keen to invest in cryptocurrency, because they are being perceived as risky assets. The larger time frame trend on Ethereum remains down and as long as the level of $288 is not violated, all rallies will be treated as a counter-trend corrective moves. This is why the short positions are now more preferred.

Analysis are provided byInstaForex.

Best regards, PR Manager / Learn more about InstaForex Company at http://instaforex.com

Re: InstaForex Analysis

Technical Analysis of ETH/USD for 11/05/2020:

https://forex-images.ifxdb.com/userfiles/20200511/analytics5eb8e51c91aed.jpg

Crypto Industry News:
Vitalik Buterin believes that Ethereum can play a role in the future global crisis as a glue that helps unite nations.

Ethereum co-founder was interviewed at Ethereal Summit 2020. Describing the current global crisis as more than financial, Buterin said that levels of political discord and distrust between countries highlighted the need for a network like Ethereum.

"I strongly believe that the role of Blockchain chains - in particular Ethereum - is to play the role of a neutral global player for systems, currencies and applications for interaction. I think that anything created and maintained by nation states cannot play this role" - he said

Describing the current situation as financial only "one-third", co-founder Ethereum also discussed the current situation compared to the global financial crisis in 2008 and whether the event could help fuel a new wave of cryptocurrency. Buterin said that cryptocurrencies like Ethereum could grow this time, solving "non-financial problems" in the world.

Technical Market Outlook:

The ETH/USD pair has dropped significantly towards the level of $177.50, which is a 61% Fibonacci retracement for the price and is currently hovering around this level. The momentum remains weak and negative, so the next target for bears is seen at the level of $164.45. The immediate technical resistance is seen at the level of $188.86 and $193.78. Please bear in mind, that there is only 13 hours left to the halving, which is highly anticipated event for all cryptoenthusiasts.

Weekly Pivot Points:
WR3 - $241.59
WR2 - $228.78
WR1 - $204.66
Weekly Pivot - $191.03
WS1 - $168.45
WS2 - $154.83
WS3 - $130.49

Trading Recommendations:
The fear of the coronavirus consequences has decreased among the global investors on the financial markets, nevertheless the global investors are not so keen to invest in cryptocurrency, because they are being perceived as risky assets. The larger time frame trend on Ethereum remains down and as long as the level of $288 is not violated, all rallies will be treated as a counter-trend corrective moves. This is why the short positions are now more preferred.

Analysis are provided byInstaForex.

Best regards, PR Manager / Learn more about InstaForex Company at http://instaforex.com

Re: InstaForex Analysis

Technical Analysis of BTC/USD for 12/05/2020:

https://forex-images.ifxdb.com/userfiles/20200512/analytics5eba39623ab6b.jpg

Crypto Industry News:
The South Korean government plans to create a blockchain-based platform for storing and verifying the identity of digital independent vehicles in the city of Sejong, which is a testing ground for the introduction of new technologies.

Asian media has announced that South Korea's Ministry of Science and ICT, along with the national internet technology supervisory body, Korea Internet & Security Agency, will guide the development of an identity management and verification platform. Although autonomous vehicles are still far from the mainstream, Sejong has already started preparing to fight the crimes associated with these advances.

The LG Group technology wing, LG CNS and the Korean independent vehicle manufacturer will work with the authorities of the city of Sejong to develop a blockchain-based encrypted identifier, called a decentralized identifier or DID. This can help prevent illegal identity copying or hacking into independent vehicles. The report explains that the identity verification system will implement multiple layers of data encryption shared between cars and road objects using vehicle-to-everything or V2X communication.

Although previously the government was uncertain about crypto, it did show consistent efforts to legitimize cryptocurrencies and develop favorable regulations. It is worth recalling that the Bank of Korea has launched a pilot program for assessing the logistics of the digital currency of the central bank or CBDC

Technical Market Outlook:
The BTC/USD pair has dipped 15% just before the halving and now, after the halving is done, there is no sign of the shopping frenzy behavior. Still the key level of support is still seen at $7,943, but the nearest technical support is currently seen at the level of $8,464. Any violation of this level will deepen the correction towards the level of $7,934 which is a key short-term technical support for bulls. Weak and negative momentum supports the short-term bearish outlook about 13 hours before halving.

Weekly Pivot Points:
WR3 - $11,485
WR2 - $10,709
WR1 - $9,512
Weekly Pivot - $8,760
WS1 - $7,652
WS2 - $6,835
WS3 - $5,708

Trading Recommendations:
The recent rally in Bitcoin was made in anticipation of Bitcoin halving and it is a classic pump and dump scheme. The larger time frame trend remains down and as long as the level of $10,791 is not violated, all rallies will be treated as a counter-trend corrective moves. This is why the short positions are now more preferred until the level of $10,791 is clearly violated.

Analysis are provided byInstaForex.

Best regards, PR Manager / Learn more about InstaForex Company at http://instaforex.com

Re: InstaForex Analysis

Technical Analysis of EUR/USD for May 13, 2020:

https://forex-images.ifxdb.com/userfiles/20200513/analytics5ebb8e13e2cec.jpg

Technical Market Outlook:
The EUR/USD was rejected for the second time at the level of 38% Fibonacci located at 1.0862 after a Shooting Star candlestick pattern was mad around the level of 1.0878. The bears are pushing the price towards the level of 1.0767 again. The bulls hasn't made a new local high yet, so the next target for them is still seen at the level of 38% Fibonacci retracement at 1.0862 and 1.0878. This level must be clearly violated in order to rally towards higher levels. The momentum remains neutral, but might turn negative any time now.

Weekly Pivot Points:
WR3 - 1.1136
WR2 - 1.1058
WR1 - 1.0936
Weekly Pivot - 1.0853
WS1 - 1.0718
WS2 - 1.0627
WS3 - 1.0520

Trading Recommendations:
The fear of the coronavirus consequences has decreased among the global investors on the financial markets. On the EUR/USD pair the main long term trend is down, but the reversal is possible when the coronavirus pandemic will be tamed. The key long-term technical support is seen at the level of 1.0336 and the key long-term technical resistance is seen at the level of 1.1540. Only if one of this levels is clearly violated, the main trend might reverse (1.1540) or accelerate (1.0336).

Analysis are provided byInstaForex.

Best regards, PR Manager / Learn more about InstaForex Company at http://instaforex.com

Re: InstaForex Analysis

Technical Analysis of EUR/USD for May 14, 2020:

https://forex-images.ifxdb.com/userfiles/20200514/analytics5ebcdda75f208.jpg

Technical Market Outlook:
The EUR/USD was rejected at the level of 50% Fibonacci located at 1.0892 after a Bearish Engulfing candlestick pattern was made at the end of the wave up. The bears are pushing the price towards the level of 1.0767 again. The bulls hasn't made a new local high yet, so the next target for them is still seen at the level of 61% Fibonacci retracement at 1.0921. This level must be clearly violated in order to rally towards the swing high at 1.1017. The momentum remains neutral, but might turn negative any time now.

Weekly Pivot Points:
WR3 - 1.1136
WR2 - 1.1058
WR1 - 1.0936
Weekly Pivot - 1.0853
WS1 - 1.0718
WS2 - 1.0627
WS3 - 1.0520

Trading Recommendations:
The fear of the coronavirus consequences has decreased among the global investors on the financial markets. On the EUR/USD pair the main long term trend is down, but the reversal is possible when the coronavirus pandemic will be tamed. The key long-term technical support is seen at the level of 1.0336 and the key long-term technical resistance is seen at the level of 1.1540. Only if one of this levels is clearly violated, the main trend might reverse (1.1540) or accelerate (1.0336).

Analysis are provided byInstaForex.

Best regards, PR Manager / Learn more about InstaForex Company at http://instaforex.com

Re: InstaForex Analysis

Technical Analysis of GBP/USD for May 15, 2020:

https://forex-images.ifxdb.com/userfiles/20200515/analytics5ebe2c44ba36c.jpg

Technical Market Outlook:
The GBP/USD pair has broken below another technical support located at the level of 1.2246 and made a new local low at the level of 1.2165. Despite the oversold market conditions the momentum remains negative well and the odds for another wave down might be higher. The nearest technical resistance is seen at the level of 1.2246 and 1.2297 and the nearest technical support is located at the level of 1.2165. If the level of 1.2165 is clearly violated, then the next target for bears is seen at the level of 1.2012.

Weekly Pivot Points:
WR3 - 1.2730
WR2 - 1.2608
WR1 - 1.2508
Weekly Pivot - 1.2380
WS1 - 1.2283
WS2 - 1.2157
WS3 - 1.2054

Trading Recommendations:
The fear of the coronavirus consequences has decreased among the global investors on the financial markets. On the GBP/USD pair the main trend is down, but the reversal will be possible when the coronavirus pandemic is tamed. The key long-term technical support has been recently violated (1.1983) and the new one is seen at the level of 1.1404. The key long-term technical resistance is seen at the level of 1.3518. Only if one of these levels is clearly violated, the main trend might reverse (1.3518) or accelerate (1.1404). The market might have done a Double Top pattern at the level of 1.2645, so the price might move lower in the longer-term.

Analysis are provided byInstaForex.

Best regards, PR Manager / Learn more about InstaForex Company at http://instaforex.com

Re: InstaForex Analysis

Technical Analysis of ETH/USD for May 18, 2020:

https://forex-images.ifxdb.com/userfiles/20200518/analytics5ec224a8508d0.jpg

Crypto Industry News:
Visa has applied for the creation of a digital currency on Blockchain at the United States Patent and Trademark Office.

According to the published application, inventors Simon Hurry and Alexander Pierre of the Visa International Service Association in San Francisco applied for a patent for the digital currency registered on Blockchain and controlled by the computer of the central unit. The application cites Ethereum as a possible network, and the cryptocurrency itself would be a stablecoin. The application lists two points, one of which would indicate that "a digital currency was created for the amount associated with the denomination for the public key associated with the digital wallet." The second entry is about "removing physical currency from circulation in the currency system."

While the US dollar is specifically mentioned as one of the fiat functional currencies to be used, the application said that the patent could apply to other central bank digital currencies such as pounds, yen and euros: "The physical currency of the central bank anywhere in the world can be digitized. "

Technical Market Outlook:
The ETH/USD pair has broken through the short-term trend line resistance around the level of $205 and made a new local high during the rally at the level of $216 (at the time of writing the article). The momentum behind the move up is strong, but the market conditions are extremely overbought on the daily time frame chart, so the rally might be short-lived. Nevertheless, the next target for bulls is seen at the level of $217.65 and $225.84.

Weekly Pivot Points:
WR3 - $259.01
WR2 - $231.70
WR1 - $222.59
Weekly Pivot - $197.56
WS1 - $188.48
WS2 - $163.94
WS3 - $154.56

Trading Recommendations:
The larger time frame trend on Ethereum remains down and as long as the level of $288 is not violated, all rallies will be treated as a counter-trend corrective moves. This is why the short positions are now more preferred.

Analysis are provided byInstaForex.

Best regards, PR Manager / Learn more about InstaForex Company at http://instaforex.com

Re: InstaForex Analysis

Forecast for EUR/USD on May 19, 2020

EUR/USD
The euro grew by 94 points on several controversial factors yesterday - on the one hand, oil rose by 10.5% to 32.83 dollars and overall risk appetites increased, on the other hand, the EU summit considered a package of assistance to the affected sectors and regions, which is half as much, than expected - 500 billion against the expected 1 trillion. Moreover, it will be a fund, and not direct help, which creates additional bureaucratic difficulties. As often happens, the expected but not realized optimism worked on the market, that is, the euro's growth as a result occurred on speculation. The growth occurred on volumes equal to Friday, which indirectly confirms the speculative nature of yesterday's growth in the thin market.

https://forex-images.ifxdb.com/userfiles/20200519/analytics5ec3503cbe799.jpg

The price reached the price channel line just above the MACD line on the daily chart. The Marlin Oscillator is growing in the zone of positive values, so there is still a growth potential. Overcoming yesterday's high may send the euro to the upper border of the 1.5-month trading range of 1.0767-1.0995.

It is possible to turn down prices directly from current levels, indicators will quickly return to the downward trend, the euro will go to the lower border of the range of 1.0767.

https://forex-images.ifxdb.com/userfiles/20200519/analytics5ec3504fc2648.jpg

The situation is not clarified on the four-hour chart. The price is above the indicator lines, Marlin is in the growth zone. All that remains is to wait for speculation to cool and then it will become clear what the market really intended.

Analysis are provided byInstaForex.

Best regards, PR Manager / Learn more about InstaForex Company at http://instaforex.com

Re: InstaForex Analysis

Technical Analysis of BTC/USD for May 20, 2020:

https://forex-images.ifxdb.com/userfiles/20200520/analytics5ec4ce40d5f03.jpg

Crypto Industry News:
Robert Kiyosaki, businessman and author of the book Rich Dad, Poor Dad, again visited Twitter to announce his bullish position to Bitcoin. In a published tweet, Kiyosaki states that fear of a dying economy led him to buy more three assets, which he considers valuable outside of the traditional financial system: gold, silver and Bitcoin. The author's tweet describes how valuable he thinks every resource will be in the coming years.

"I bought more silver and Bitcoin gold. GOLD [currently] at $ 1,700. I forecast $ 3,000 in 1 year. Silver [currently] at $ 17. I predict $ 40 for 5 years. Bitcoin [currently] at $ 9,800. I anticipate $ 75,000 in three years. "

In numerical terms, this forecast reflects the expected annual increase of around 76%, 19% and 97% for gold, silver and Bitcoin, respectively. This indicates, at least according to Kiyosaki's calculations, that Bitcoin has the most favorable profit potential out of three.

This is not the first time Robert Kiyosaki has used his platform to explain the benefits of Bitcoin and Blockchain. In recent months, the businessman has repeatedly talked about his faith in the future of these technologies.

Technical Market Outlook:
The BTC/USD pair has been seen hovering around the level of $10,000, which is the key short-term technical resistance for the bulls. The recent local high was made at the level of $9,884, so any violation of this level will lead to the local up trend extension towards the level of $10,227 - $10,430. The nearest technical support is seen at the level of $9,381. The nearest technical support is seen at the level of $9,382. Please notice, the market conditions on daily time frame chart are extremely overbought.

Weekly Pivot Points:
WR3 - $12,194
WR2 - $10,994
WR1 - $10,553
Weekly Pivot - $9,337
WS1 - $8,765
WS2 - $7,555
WS3 - 7,013

Trading Recommendations:
The larger time frame trend remains down and as long as the level of $10,791 is not violated, all rallies will be treated as a counter-trend corrective moves. This is why the short positions are now more preferred until the level of $10,791 is clearly violated.

Analysis are provided byInstaForex.

Best regards, PR Manager / Learn more about InstaForex Company at http://instaforex.com

Re: InstaForex Analysis

European Economics Preview: Eurozone Flash PMI Data Due

https://forex-images.ifxdb.com/analysts/big_preview/eurozone/2.jpg

Flash Purchasing Mangers' survey results from euro area and the UK are due on Thursday, headlining a busy day for the European economic news.

At 3.15 am ET, IHS Markit is scheduled to issue France's PMI data. Economists forecast the composite output index to improve to 32.0 in May from 11.1 a month ago.

At 3.30 am ET, Germany's flash PMI data is due. The composite index is seen at 34.1 in May versus 17.4 in the previous month.

At 4.00 am ET, Eurozone composite PMI data is due. The index is expected to advance to 25.0 in May from 13.6 in April.

In the meantime, industrial production and producer prices are due from Poland. Economists forecast industrial output to fall 10 percent annually in April, faster than the 2.3 percent decrease in March.

At 4.30 am ET, IHS Markit/CIPS publishes UK flash composite PMI data. Economists forecast the composite indicator to rise to 25.0 in May from 13.8 in April.

At 6.00 am ET, the Confederation of British Industry releases Industrial Trends survey data. The order book balance is forecast to fall to -59 percent in May from -56 percent in the preceding period.

At 7.00 am ET, Turkey's central bank interest rate announcement is due. Economists expect the central bank to cut its one-week repo rate to 8.25 percent from 8.75 percent.

[url=https://www.instaforex.com/forex-news]News are provided by
InstaForex.[/url]

Best regards, PR Manager / Learn more about InstaForex Company at http://instaforex.com

Re: InstaForex Analysis

Forecast for EUR/USD on May 22, 2020

EUR/USD
The euro grew during the first half of Thursday due to optimistic rates of European business activity for the current month: Manufacturing PMI of the euro area grew from 33.4 to 39.5, Services PMI showed even greater dynamics - an increase from 12.0 to 28.7. The euro has decisively reversed since the US session opened. US PMIs came out better than expected, but not as much as we expected: Manufacturing PMI grew from 36.1 to 39.8 against 39.3, Services PMI grew from 26.7 to 36.9 with 32.6 expected. Nevertheless, the trading volumes were comparable to those observed on May 18, which indicates a massive closure of purchases and even the opening of sales. A more interesting story awaits us next week, when sales of new housing, orders for durable goods, incomes and expenses of consumers will be published in the US.

https://forex-images.ifxdb.com/userfiles/20200522/analytics5ec74bfc0b7a9.jpg

The price was re-marked at the upper border of the price range and with the turn of the oscillator, Marlin headed down on the daily chart. The closest support for the price is the price channel line at 1.0918, below it is the MACD indicator line at 1.0888, overcoming it will confirm the euro's intention to go much deeper down to 1.0767 and 1.0578.

https://forex-images.ifxdb.com/userfiles/20200522/analytics5ec74c0ed851a.jpg

The signal line of the Marlin oscillator penetrated into the downward trend zone after forming a double divergence on the four-hour chart. The closest target is the 1.0888 level, at which the MACD lines coincide on both scopes. Consolidation under the level opens the way to the lower border of the range 1.0767.

*The market analysis posted here is meant to increase your awareness, but not to give instructions to make a trade.

Analysis are provided byInstaForex.

Best regards, PR Manager / Learn more about InstaForex Company at http://instaforex.com

Re: InstaForex Analysis

Technical Analysis of BTC/USD for May 26, 2020:

https://forex-images.ifxdb.com/userfiles/20200526/analytics5eccac6fe73ae.jpg

Crypto Industry News:
New strict rules, in which many ways of using digital resources are punishable by a fine or imprisonment, may soon become law in Russia.

New bills specifying how Russia should regulate cryptocurrencies were sent to the parliament of the country, the State Duma, earlier this week. Although the official site for the planned regulations has not yet been updated, both documents were published in the OrderCom telegram channel and were confirmed as authentic by the sources of the Russian news channel RBK.

Legislative proposals were reportedly written by employees of the Digital Economy think tank and the Skolkovo business accelerator. They are looking for a new version of the Digital Resources Act that has been stuck in the Duma for over two years, as well as cryptocurrency-oriented additions to the national criminal code.

The first bill would regulate digital currencies in Russia, or more precisely, prohibit the issuance and operation of digital currencies. It would even be forbidden to disseminate information on such activities.

Individuals and companies will not be able to accept digital currencies as payments, unless they are inherited, transferred to the debtors of a bankrupt company or confiscated as a result of a court decision. People with cryptocurrency should declare it at the tax office, as well as provide information on how to buy.

A second draft would introduce a new article in the Criminal Code imposing sanctions for illegal operations using digital resources. If the regulations are adopted, the issue of digital assets in Russia without permission to enter in the register, which is yet to be created in the central bank of this country, will result in a fine of up to two million rubles (almost $ 28,000). The same level of penalty is suggested for organizing operations with digital resources and cryptocurrencies without permission, while people would face fines of up to $ 2,800.

Buying a cryptocurrency for cash or a bank transfer from a Russian bank would be subject to a fine of up to one million Russian rubles ($ 14,000) or up to seven years in prison, depending on the scale of the contract. A similar penalty would apply to those who accept crypto for goods and services.

If such a business brings "particularly large" profits or particularly large damage to citizens and the state, the proposal would cause the person (s) involved to be imprisoned for up to seven years, or even forced labor.

Mention of the central bank register suggests that legislators are free to some officially sanctioned entities to issue and use digital assets, while most general operations would be banned.

According to the RBK report, Anatoly Aksakov, head of the Duma of the Financial Markets Commission, confirmed the authenticity of the documents, but stated that they had not been finalized.

Technical Market Outlook:
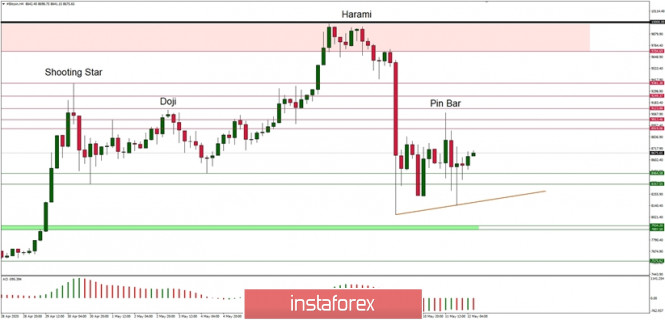
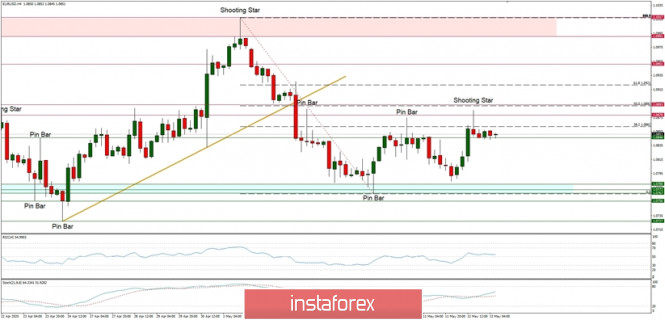
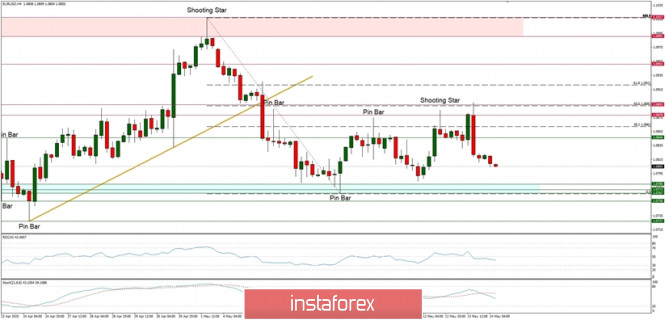
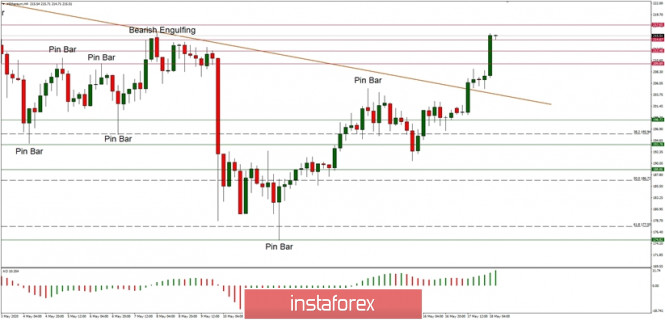
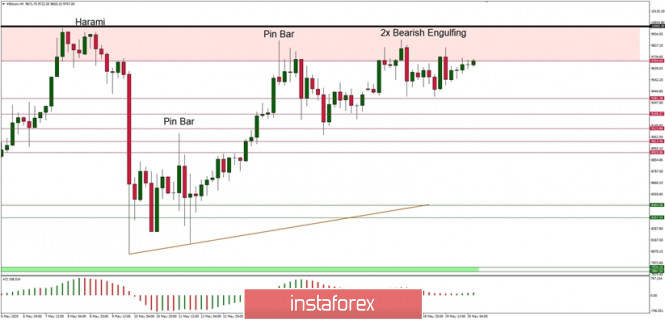
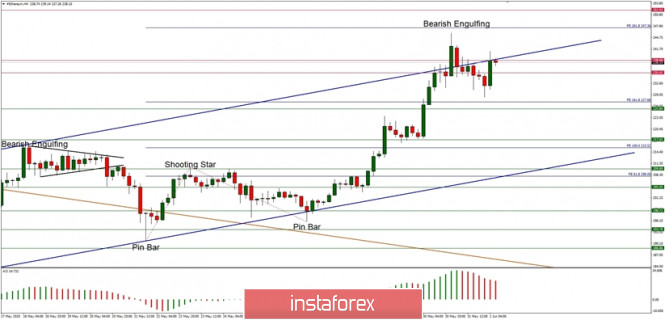
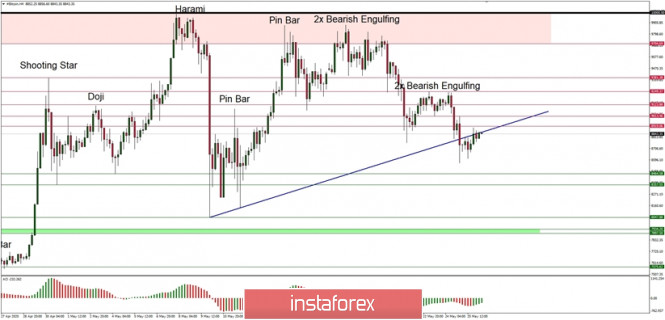
The BTC/USD pair has bounced from the level of $8,576 after breaking through the key trend line support located around the level of $8,800. The bounce is so far very shallow and the next the nearest resistance is located at the level of $8,919 and $9,013. On the other hand, the next technical support is seen at the level of $8,464 and $8,357.The momentum remains weak and negative, so the odds for another wave down are high.

Weekly Pivot Points:
WR3 - $10,568
WR2 - $10,245
WR1 - $9,478
Weekly Pivot - $9,098
WS1 - $8,333
WS2 - $7,968
WS3 - 7,231

Trading Recommendations:
The larger time frame trend remains down and as long as the level of $10,791 is not violated, all rallies will be treated as a counter-trend corrective moves. This is why the short positions are now more preferred until the level of $10,791 is clearly violated. The key mid-term technical support is located at the level of $7,897.

*The market analysis posted here is meant to increase your awareness, but not to give instructions to make a trade.

Analysis are provided byInstaForex.

Best regards, PR Manager / Learn more about InstaForex Company at http://instaforex.com

Re: InstaForex Analysis

Elliott wave analysis of EUR/GBP for May 27, 2020

https://forex-images.ifxdb.com/userfiles/20200527/analytics5ecdf9a65e032.jpg

EUR/GBP is finally back to test the neckline support at 0.8866. This former resistance which now acts as support should be able to protect the downside for renewed upside pressure through minor resistance at 0.8930 indicating the next impulsive rally towards 0.9065 on the way higher to and above the peak at 0.9495.

In the short-term, we should see a final dip to test the key-support at 0.8866 before EUR/GBP will be ready to turn higher again.
R3: 0.9000
R2: 0.8955
R1: 0.8930
Pivot: 0.8910
S1: 0.8880
S2: 0.8866
S3: 0.8844

Trading recommendation:
We are long EUR from 0.8760 and our stop is placed at 0.8815.

*The market analysis posted here is meant to increase your awareness, but not to give instructions to make a trade.

Analysis are provided byInstaForex.

Best regards, PR Manager / Learn more about InstaForex Company at http://instaforex.com

Re: InstaForex Analysis

Forecast for GBP/USD on May 28, 2020

GBP/USD
The British pound lost 70 points on Wednesday due to investors' concerns regarding the Bank of England's lower rates towards the negative area. The current rate of the BoE is 0.10%. In addition, UK Brexit negotiator David Frost announced the country's refusal to extend the transition period ending at the end of this year and actually reported the failure of the current stage of negotiations.

https://forex-images.ifxdb.com/userfiles/20200528/analytics5ecf326ddfa9b.jpg

The pound's growth on the daily chart was suspended on the balance indicator line. Currently, the price is at the Fibonacci level of 161.8%. But the price is higher than the MACD indicator line, consolidated above it, and if the signal line of the Marlin oscillator moves to the zone of positive values, the upward trend can be restored with the immediate target of 1.2540 at the Fibonacci level of 123.6%.

The price may return to the downward trend after the price goes below the MACD line (1.2165 - match with the April 7 low). Decreasing goals are also determined by Fibonacci levels: 1.1935, 1.1750.

https://forex-images.ifxdb.com/userfiles/20200528/analytics5ecf326ddfa9b.jpg

The price develops between two signal levels on the H4 chart: its exit above 1.2362 - yesterday's high, opens up the prospect of growth to 1.2540, consolidation below 1.2165 opens the first bearish target of 1.1935.

*The market analysis posted here is meant to increase your awareness, but not to give instructions to make a trade.

Analysis are provided byInstaForex.

Best regards, PR Manager / Learn more about InstaForex Company at http://instaforex.com

Re: InstaForex Analysis

Forecast for EUR/USD on May 29, 2020

EUR/USD
Yesterday, investors' expectations for positive US data did not materialize. The volume of orders for durable goods fell by 17.2% in April after a previous drop of 14.7%. The forecast was -19.0%, but of -17.2% optimism, of course, does not cause. The second estimate of GDP for the first quarter was revised down from -4.8% to -5.0% against the forecast without change (i.e. -4.8%). As a result, the dollar index lost -0.47%, the euro grew by 68 points, the S&P 500 fell by 0.21%. Macro statistics do not have to wait for optimism to an even greater extent today. The forecast for personal incomes of consumers for April is -7.0%, for personal expenses -12.6% versus the March contraction of -7.5%. The index of business activity in the manufacturing sector of the Chicago region in May is expected to increase from 35.4 to 40.1, but here (in the spirit of the times) there is a great emotional component, so the data may turn out to be worse.

https://forex-images.ifxdb.com/userfiles/20200529/analytics5ed083b471dc3.jpg

The euro is moving towards its first target of 1.1140 on the daily chart. Whether there will be a price reversal from this level or the euro will continue to grow higher is currently not clear, since there are no prerequisites for technical signs in any direction. Price in a local situation is a leading factor, indicators in a guided position.

https://forex-images.ifxdb.com/userfiles/20200529/analytics5ed083c771609.jpg

The price and indicators are growing on the H4 chart, there are no signs of a reversal. We are waiting for the price on the embedded line of the price channel of 1.1140.

*The market analysis posted here is meant to increase your awareness, but not to give instructions to make a trade.

Analysis are provided byInstaForex.

Best regards, PR Manager / Learn more about InstaForex Company at http://instaforex.com

Re: InstaForex Analysis

Technical Analysis of ETH/USD for June 1, 2020:

https://forex-images.ifxdb.com/userfiles/20200601/analytics5ed49e03b5357.jpg

Company does not offer investment advice and the analysis performed does not guarantee results. The market analysis posted here is meant to increase your awareness, but not to give instructions to make a trade.

Crypto Industry News:
The Cyble Research Team has conducted research that showed that data on more than 80,000 credit cards around the world has been put up for sale at Darknet.

According to the information, the data leakage concerned credit card users from various countries, such as the United States (33,000), France (14,000), Australia (5,000), United Kingdom (5,000), Canada (2,000) .), Singapore (1.2 thousand) and India (1.3 thousand). According to the message from Cyble, these are both Visa and Matercard. Each of them contains the cardholder's surname, CVV number and expiry date. The price of these cards is $ 5 in crypto, and is independent of their value in a world outside of Darknet.

According to research, information about the countries where the cards come from was disclosed due to a billing data leak. This information included the address of each cardholder, making it easier for cyber security companies to determine the country of origin of each card.

It's not entirely clear where the hackers stole their card details, but Cyble thinks they may come from a phishing site or online stores that the hackers attacked. Cybele created a special search engine so that people could check if their personal data leaked into Darknet. In total, the company's database contains over 40 billion records.

Technical Market Outlook:
The ETH/USD pair has been hovering around the level of $235 for all the weekend and made a new local high at the level of $241.06. This level is just in line with the upper parallel channel line, so it might act as a dynamic resistance despite the fact that it was violated recently. The momentum is not increasing at the alarming rate, so some kind of a corrective pull-back is expected. The target level for correction is seen at $225.84, but the larger time-frame trend remains up. The next target for bulls is seen at 261% Fibonacci extension at $247.36.

Weekly Pivot Points:
WR3 - $307.85
WR2 - $277.87
WR1 - $257.91
Weekly Pivot - $226.70
WS1 - $208.30
WS2 - $176.78
WS3 - $157.13

Trading Recommendations:
The larger time frame trend on Ethereum remains down and as long as the level of $288 is not violated, all rallies will be treated as a counter-trend corrective moves. This is why the short positions are now more preferred. The next key technical support is seen at the level of $174.82.

Analysis are provided byInstaForex.

Best regards, PR Manager / Learn more about InstaForex Company at http://instaforex.com

Re: InstaForex Analysis

Technical Analysis of EUR/USD for June 2, 2020:

https://forex-images.ifxdb.com/userfiles/20200602/analytics5ed5ef05a22d0.jpg

Technical Market Outlook:
The EUR/USD pair has been consolidating the recent gains in a narrow zone located between the levels of 1.1148 - 1.1100. The bulls are hovering just below the lower supply zone boundary located between the levels of 1.1148 - 1.1190. Please notice, the market conditions are now overbought and despite the positive and strong momentum the price might start a corrective pull-back towards the nearest technical support located at the level of 1.1050.

Weekly Pivot Points:
WR3 - 1.1499
WR2 - 1.1307
WR1 - 1.1241
Weekly Pivot - 1.1045
WS1 - 1.0959
WS2 - 1.0772
WS3 - 1.0680

Trading Recommendations:
On the EUR/USD pair the main long term trend is down, but the local up trend continues. The key long-term technical support is seen at the level of 1.0336 and the key long-term technical resistance is seen at the level of 1.1540. Only if one of this levels is clearly violated, the main trend might reverse (1.1540) or accelerate (1.0336).

Company does not offer investment advice and the analysis performed does not guarantee results. The market analysis posted here is meant to increase your awareness, but not to give instructions to make a trade.

Analysis are provided byInstaForex.

Best regards, PR Manager / Learn more about InstaForex Company at http://instaforex.com

Re: InstaForex Analysis

Forecast for EUR/USD on June 3, 2020

EUR/USD
Risk appetites continue to grow despite protests and riots in the US: S&P 500 gained 0.82% yesterday, gold fell 0.69%, yield on 5-year US government bonds rose from 0.31% to 0, 32% The euro grew by 35 points, gaining a foothold on the daily chart over the trend line of the price channel. Target of 1.1250/65 is open.

https://forex-images.ifxdb.com/userfiles/20200603/analytics5ed7179e06f06.jpg

The price is growing in a stable trend on the four-hour chart, but the Marlin oscillator has formed a divergence. With an increase in the price of another 15 points, the divergence can be reorganized into a regular pullback of the indicator (indicator discharge) with the resumption of growth. We are waiting for the price in the specified target range, where it is possible to form a more stable reversal pattern.

https://forex-images.ifxdb.com/userfiles/20200603/analytics5ed717b0ab50a.jpg

Analysis are provided byInstaForex.

Best regards, PR Manager / Learn more about InstaForex Company at http://instaforex.com

Re: InstaForex Analysis

Forecast for EUR/USD on June 4, 2020

EUR/USD
Yesterday, the euro reached the target range of 1.1250/65 and today, with the support of the Marlin oscillator turning down, it is ready to head for a correction. The purpose of the correction is the embedded line of the price channel in the region of 1.1133. Consolidating the price below it opens a deeper target 1.1019 (May 1 high). If the price goes above the upper boundary of the target range of 1.1265, the second bullish target at 1.1342 will open.

https://forex-images.ifxdb.com/userfiles/20200604/analytics5ed872a18c431.jpg

The divergence on the Marlin oscillator still formed on the four-hour chart (yesterday we questioned the formation of this reversal pattern). Target level at 1.1133 coincides with the MACD line, which it is aiming for. Working out this correction level is our main scenario.

https://forex-images.ifxdb.com/userfiles/20200604/analytics5ed872b46d5ce.jpg

Analysis are provided byInstaForex.

Best regards, PR Manager / Learn more about InstaForex Company at http://instaforex.com

Re: InstaForex Analysis

Forecast for USD/JPY on June 5, 2020

USD/JPY The dollar continued to grow against the yen yesterday (23 percentage points) despite the decline in stock indices: the S&P 500 was down -0.34%, while the Nikkei 225 is losing -0.32% in the Asian session today. It seems that investors are counting on good US employment data today and continued growth in related markets. If such expectations are met, then with the price overcoming the first target level of 109.50, growth will continue to the second target level of 110.83 (November 2017 low).

https://forex-images.ifxdb.com/userfiles/20200605/analytics5ed9ba3cadeb8.jpg

A weak divergence has formed on the Marlin oscillator on the four-hour chart, the structure is more similar to the indicator discharging before further growth. But this pattern is also a harbinger of increased intraday volatility, which is quite consistent with today's release of important US data.

https://forex-images.ifxdb.com/userfiles/20200605/analytics5ed9ba4fee1a2.jpg

We are waiting for a clarification of the situation - whether investors will change their minds to buy risk.

Analysis are provided byInstaForex.

Best regards, PR Manager / Learn more about InstaForex Company at http://instaforex.com

Re: InstaForex Analysis

Forecast for AUD/USD on June 8, 2020

AUD/USD The Australian dollar is moving sideways at a target level of 0.6975 since Friday last week as well this morning. The sideways movement increased the technical divergence on the Marlin oscillator. We are waiting for the movement to the first support of 0.6830.

https://forex-images.ifxdb.com/userfiles/20200608/analytics5eddaf1ae110f.jpg

The Marlin divergence has also developed on the four-hour chart, the signal line of the oscillator is attacking the border of the downward trend territory. If the price consolidates below 0.6830, the price will also go under the MACD indicator line, respectively, the fall will likely continue towards the lower target of 0.6680.

https://forex-images.ifxdb.com/userfiles/20200608/analytics5eddaf2e3eab6.jpg

Analysis are provided byInstaForex.

Best regards, PR Manager / Learn more about InstaForex Company at http://instaforex.com

Posts: 551 to 575 of 1,547

Pages Previous 1 21 22 23 24 25 62 Next

You must login or register to post a reply

Forex Software → Market Analysis → InstaForex Analysis

Similar topics in this forum