Technical Analysis of BTC/USD for July 1, 2020:
Crypto Industry News:
Anxiety in the cryptocurrency community is growing every day. No change in Bitcoin prices, trade between $ 9,000 to $ 9,500, for almost two months is currently not perceived as a feature of the strongest cryptocurrency in the world, but rather its relationship with larger financial markets.
Bitcoin, for most of this year, when the pandemic began shifting markets, acted against itself. According to the "uncorrelated" status, the cryptocurrency reached enormous highs when both the stock market and the commodity market collapsed, losing millions. This is despite the fact that Bitcoin lost over 50% of its value in one day in March and increased its supply by 50% in May.
However, now that price and supply have normalized, the unstable asset is stable from the outset, and some cryptocurrency community members suggest that the reason is that it has not yet separated from the stock market.
Bitcoins and the larger cryptocurrency market, despite being called 'decentralized', have often exerted an impact on macroeconomic activities, usually affecting traditional markets. Last year, Bitcoin saw movement in the gold market on various isolated occasions, mainly because of the safe harbor narrative in times of economic or political turmoil.
Now the prices on the stock market offset the negative effects of the slowdown of global economies by a pandemic and the inflow of liquidity from central banks. At this time, Bitcoin is actually moving according to the highest stock index, S & P500. Market data indicate that the 1-month correlation of Bitcoins with S & P500 is the highest in over a year, and is currently estimated at over 42.6%.
Because Bitcoin is "coupled" with S & P500, this presents a different set of short-term fate for cryptocurrency in the future. Given the likelihood of a second package of government assistance in the United States, another injection of freshly minted dollars may again positively affect Bitcoin, as it did in May. Another scenario is the second wave of COVID-19 cases that could cause another liquidation madness.
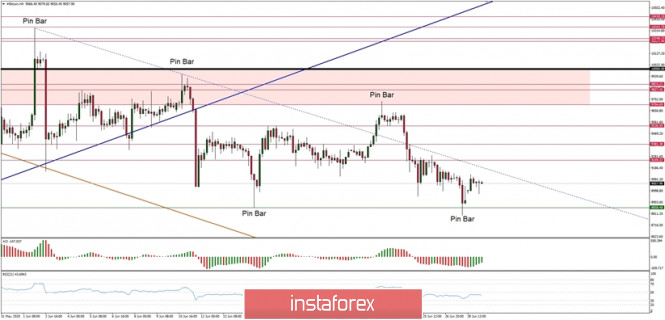
Technical Market Outlook:
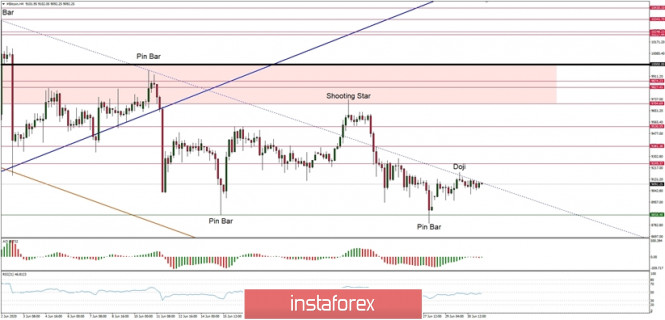
The BTC/USD pair has made a new local high at the level of $9,129, but there is a Doji candlestick pattern made at the top of this move, so if the intraday support located at the level of $8,971 is clearly violated, the odds for another low are high. The momentum is still weak and negative, but is getting closer to the level of fifty, which is a neutral level for the momentum indicator. The next target for bears is seen at the level of $8,565, but in a case of an upside breakout, the next target for bulls is seen at the level of $9,249 (technical resistance level).
Weekly Pivot Points:
WR3 - $10,465
WR2 - $10,072
WR1 - $9,509
Weekly Pivot - $9,126
WS1 - $8,593
WS2 - $8,191
WS3 - 7,623
Trading Recommendations:
The larger time frame trend remains down and as long as the level of $10,791 is not violated, all rallies will be treated as a counter-trend corrective moves. This is why the short positions are now more preferred until the level of $10,791 is clearly violated. The key mid-term technical support is located at the level of $7,897.
Analysis are provided byInstaForex.
Best regards, PR Manager / Learn more about InstaForex Company at http://instaforex.com