forex software

Create and Test Forex Strategies

forex software

Skip to forum content

Forex Software

Create and Test Forex Strategies

You are not logged in. Please login or register.


(Page 27 of 62)

Forex Software → Market Analysis → InstaForex Analysis

Pages Previous 1 25 26 27 28 29 62 Next

You must login or register to post a reply

RSS topic feed

Posts: 651 to 675 of 1,547

Re: InstaForex Analysis

Forecast for EUR/USD on September 22, 2020

EUR/USD
There was a slight panic in the market on Monday. Due to the development of the second wave of coronavirus in Europe and the United States, investors began to fear the widespread closure of economies, as the UK intends to do from today. The maximum restrictions in England are introduced from the 28th. The British stock index FTSE 100 fell 3.38%. The European EuroStoxx 50 index lost 3.74%, while the US S&P 500 was down -1.16%. Investors started buying the dollar as a defensive currency and the euro fell 68 points.

https://forex-images.ifxdb.com/userfiles/20200922/analytics5f6971b82b7b7.jpg

The price attacked the lower border of the two-month consolidation range at 1.1760, now it is ready to reach the nearest target at 1.1650. Then (after a local correction), we expect it to fall towards 1.1550.

https://forex-images.ifxdb.com/userfiles/20200922/analytics5f6971bb2914e.jpg

The decline occurs without reversal signals on the four-hour chart. We are waiting for the price to settle under 1.1760 and further progress towards the indicated targets.

Analysis are provided byInstaForex.

Best regards, PR Manager / Learn more about InstaForex Company at http://instaforex.com

Re: InstaForex Analysis

Elliott wave analysis of EUR/JPY for September 23, 2020

https://forex-images.ifxdb.com/userfiles/20200923/analytics5f6acd0509c25.jpg

We are still expecting a final dip closer to our ideal target at 122.15 to complete wave 2/ and set the stage for a new impulsive rally in wave 3/ to above the former peak at 127.07. In the short-term, a minor triangle is developing as the penultimate wave and this should ultimate give away for the final dip to 122.15 to complete wave 2/.

Only a direct break above minor resistance at 123.42 wil indicate that wave 2/ already has completed while a break above resistance at 124.01 will confirm that wave 3/ is in motion.
R3: 124.40
R2: 124.01
R1: 123.66
Pivot: 123.30
S1: 122.87
S2: 122.53
S3: 122.15

Trading recommendation:
We are short EUR from 123.90 and we will buy+revers our short position to a long EUR-position at 123.25 or upon a break above 123.45

Analysis are provided byInstaForex.

Best regards, PR Manager / Learn more about InstaForex Company at http://instaforex.com

Re: InstaForex Analysis

Forecast for USD/JPY on September 24, 2020

USD/JPY
The Japanese yen broke through the price channel line and reached the intermediate Fibonacci level of 110.0% on Wednesday. The powerful convergence of the price and the Marlin oscillator continues to work, now the yen is aiming for the Fibonacci level of 106.00, or slightly higher, where the MACD line passes. But the main goal of the USD/JPY pair is the upper line of the price channel (also embedded) around the area of the 106.40 level, since overcoming it will guarantee a medium-term price growth (targets 107.35, 108.20 and higher).


https://forex-images.ifxdb.com/userfiles/20200924/analytics5f6c121604525.jpg

The four-hour chart shows that the price has firmly settled in the area above the balance and MACD indicator lines. The signal line of the Marlin oscillator falls into the horizon, which may be a harbinger of a local price decline in the 105.00/15 range, formed by support of the MACD line (H4) and the price channel line (daily).

https://forex-images.ifxdb.com/userfiles/20200924/analytics5f6c1219cc04d.jpg

Analysis are provided byInstaForex.

Best regards, PR Manager / Learn more about InstaForex Company at http://instaforex.com

Re: InstaForex Analysis

Evening review on September 24, 2020

https://forex-images.ifxdb.com/userfiles/20200924/analytics5f6c94ae81d8e.jpg

The EURUSD pair prospects possible decline.

The unemployment claims in the US for the long-term practically remain unchanged at 12.6 million. Note that there was a notable decrease of 700,000 just a week earlier.

Nevertheless, the euro continues to decline.
You may keep selling from 1.1735 with a stop at 1.1760.

Analysis are provided byInstaForex.

Best regards, PR Manager / Learn more about InstaForex Company at http://instaforex.com

Re: InstaForex Analysis

Technical Analysis of GBP/USD for September 28, 2020

https://forex-images.ifxdb.com/userfiles/20200928/analytics5f717a7ee99fa.jpg

Technical Market Outlook:
The GBP/USD pair has hit the level of 1.2697 (low was made at 1.2674) and after a short period of consolidation the market is starting to bounce. This corrective bounce higher should be capped very soon, because there is a wide supply zone located between the level of 1.2747 - 1.2869 and only a sustained breakout above the level of 1.2869 would indicate the whole corrective cycle termination. Moreover, the market is bouncing from the oversold conditions on the H4 time frame chart and the momentum is slowly accelerating as well. The weekly time frame trend remains up.

Weekly Pivot Points:
WR3 - 1.3187
WR2 - 1.3072
WR1 - 1.2894
Weekly Pivot - 1.2783
WS1 - 1.2601
WS2 - 1.2494
WS3 - 1.2312

Trading Recommendations:
On the GBP/USD pair the main, multi-year trend is down, which can be confirmed by the down candles on the monthly time frame chart. The key long-term technical resistance is still seen at the level of 1.3518. Only if one of these levels is clearly violated, the main trend might reverse (1.3518 is the reversal level) or accelerate towards the key long-term technical support is seen at the level of 1.1903 (1.2589 is the key technical support for this scenario).

Analysis are provided byInstaForex.

Best regards, PR Manager / Learn more about InstaForex Company at http://instaforex.com

Re: InstaForex Analysis

Forecast for EUR/USD on September 29, 2020

EUR/USD
The euro slightly increased on Monday amid rising risk appetite in the stock market and ahead of the first debate of presidential candidates Trump and Biden on Wednesday. Technically, the growth was reflected in consolidation at the target level of 1.1650. The observed consolidation is likely to continue today. The price must settle below the 1.1650 level in order for a significant downward movement to appear. The first target is 1.1550 (November 2017 low).

https://forex-images.ifxdb.com/userfiles/20200929/analytics5f72af6fbd983.jpg

The price shows an intention to fall from the September 24 and 25 highs. It would be like forming a narrow consolidation, which in turn will act as a technical figure for the trend to continue, that is, a decline. The euro's consolidation growth may continue up to the MACD indicator line at 1.1712. We are waiting for the development of events, the main scenario is decreasing.

Analysis are provided byInstaForex.

Best regards, PR Manager / Learn more about InstaForex Company at http://instaforex.com

Re: InstaForex Analysis

Forecast for AUD/USD on September 30, 2020

AUD/USD
The Australian dollar has created a dual growth situation this morning, which suggests a reversal towards the 0.7190 level without achieving this target. This circumstance is due to the delta in the upper lines of the trading channel of the Marlin oscillator of the daily chart. The signal line of the oscillator can make a reversal from any of them, either from the blue line or from the green line. This shows us how false the growing movement can be if it begins to develop. The price staying above 0.7190 with Marlin entering the zone of positive values will be a sign of price growth. The first target will be the 0.7270 level .

https://forex-images.ifxdb.com/userfiles/20200930/analytics5f74039333fae.jpg

The price has settled above the MACD line on the four-hour chart, but the Marlin oscillator is marking a reversal, at the moment its signal line is moving horizontally. In a short amount of time, the price may return to the area under this line and settle below it. In this case, and this is the main scenario, the aussie will aim for 0.7065. Consolidating below it opens the second target at 0.6970.

https://forex-images.ifxdb.com/userfiles/20200930/analytics5f7403965d288.jpg

Analysis are provided byInstaForex.

Best regards, PR Manager / Learn more about InstaForex Company at http://instaforex.com

Re: InstaForex Analysis

Forecast for USD/JPY on October 1, 2020

USD/JPY
USD/JPY fell by 18 points while investors were temporarily confused on Wednesday, stopping at the 110.0% Fibonacci level on the daily chart. The pair is planning to go up from this level during the Asian session. The Marlin oscillator is staying in the growth zone. We are waiting for the next branch of growth at the target of 106.00 - at the Fibonacci level of 100.0% and the MACD line coinciding with it.

https://forex-images.ifxdb.com/userfiles/20201001/analytics5f7554fe174f2.jpg

The price is held by the balance indicator line on the four-hour chart, the general trend is growing. The Marlin oscillator has been declining for a long time while the price increases, you can look at this as the indicator easing from the overbought zone before it grows further. We are waiting for the price to reach the designated target.

https://forex-images.ifxdb.com/userfiles/20201001/analytics5f755500d7ccc.jpg

Analysis are provided byInstaForex.

Best regards, PR Manager / Learn more about InstaForex Company at http://instaforex.com

Re: InstaForex Analysis

Forecast for EUR/USD on October 2, 2020

EUR/USD The euro rose by 26 points yesterday, a stronger movement was prevented from developing the signal level of 1.1754, created by the lows of August 21 and September 9. The Marlin oscillator is showing the first signs of a reversal. Perhaps with the release of US employment data, this reversal will intensify. The US unemployment rate for September is expected to fall from 8.4% to 8.2%. The first target for the euro is 1.1650, then 1.1550.

https://forex-images.ifxdb.com/userfiles/20201002/analytics5f76a4ba7deef.jpg

The price formed a divergence with the oscillator on the four-hour chart. In order to confidently decline, The price needs to settle below the MACD line below 1.1688. We are waiting for the development of events.

https://forex-images.ifxdb.com/userfiles/20201002/analytics5f76a4bd657dd.jpg

Analysis are provided byInstaForex.

Best regards, PR Manager / Learn more about InstaForex Company at http://instaforex.com

Re: InstaForex Analysis

Technical Analysis of BTC/USD for October 5, 2020

Crypto Industry News:
Estonian central bank - Eesti Pank - has announced the launch of a research program to test how to build a digital currency infrastructure.

According to the statement, Eesti Pank will collaborate on the research project with technology companies SW7 Group and Guardtime. The initiative aims to test whether a blockchain-based keyless signature (KSI) solution can help create virtual currency.

It is worth adding that Estonia is already using blockchain and KSI technology in its e-government services. The bank's project will also address new payment solutions "that may be possible through the use of electronic identifiers and other Estonian e-government solutions."

The project will consist of several phases and will last approximately two years. The first phase will be to create a scalable, practical and secure platform that meets the requirements of CBDC. At the same time, it was emphasized that the platform is to operate quickly, securely and ensure privacy.

Rainer Olt, head of the bank's Payment Systems Department, said:

"As a small central bank, Eesti Pank carefully selects the development projects of the Eurozone central banks to which we can make a significant contribution. Over the years, Estonia has developed unique know-how in maintaining a secure, private and efficient eGovernment. Estonia's unique wealth of experience is a good impetus to launch the project with technology companies SW7 and Guardtime to explore [new] technological opportunities. "

The bank emphasized that it is constantly striving to develop its financial environment and payment system in order to keep up with the times and respond to the needs of citizens.

Technical Market Outlook:
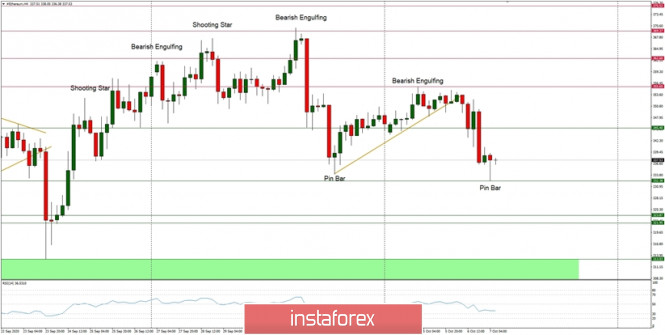
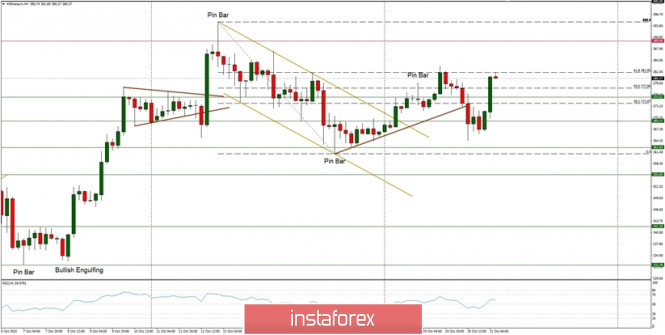
The BTC/USD pair has been slowly moving up towards the level of $10,679, which is the 61% Fibonacci retracement of the last wave down. There is a change for the market to continue to move higher if the level of $10, 697 is clearly violated. The next target for bulls is seen at the level of $10,890, which is the last swing high. On the other hand, the nearest technical support is seen at the level of $10,586 and $10,547.

Weekly Pivot Points:
WR3 - $11,471
WR2 - $11,178
WR1 - $10,858
Weekly Pivot - $10,602
WS1 - $10,300
WS2 - $10,024
WS3 - $9,715

Trading Recommendations:
The weekly trend on the BTC/USD pair remains up and there are no signs of trend reversal, so buy orders are preferred in the mid-term. All the dynamic corrections are still being used to buy the dips. The next mid-term target for bulls is seen at the level of $13,712. The key mid-term technical support is seen at the level of $10,000.

Analysis are provided by InstaForex

Best regards, PR Manager / Learn more about InstaForex Company at http://instaforex.com

Re: InstaForex Analysis

The Central European Bank supports the growth of the Euro

After forming a small accumulation zone, the Euro continued to grow rapidly against the US Dollar and other currencies. This makes it possible to hold a long position. Any downward movement of the pair will allow you to re-enter purchases at more favorable prices. The nearest target for the current growth phase is 1.1830. The probability of reaching this mark is at 75%. When the goal is reached, you must fully or partially exit the position. This will allow you to record purchases at a favorable price.

https://forex-images.ifxdb.com/userfiles/20201006/analytics5f7be3ba15e3a.jpg

Areas of the Central Bank where liquidity increase is likely to be used to fix transactions. The probability of continuing growth after the next test of the zone without correction is below 30%, so we should expect the formation of a downward model in the second half of this week. This movement will be corrective, so sales can only be considered as a short-term investment with a quick fix within the average daily course.

Analysis are provided byInstaForex.

Best regards, PR Manager / Learn more about InstaForex Company at http://instaforex.com

Re: InstaForex Analysis

Technical Analysis of ETH/USD for October 7, 2020

https://forex-images.ifxdb.com/userfiles/20201007/analytics5f7d5638363d9.jpg

Crypto Industry News:
According to a recent SEC disclosure by the Greyscale Ethereum Trust, or ETHE, Ethereum's impending shift to proof-of-stake consensus is a risk that could have a "material adverse effect" on its stock.

ETHE has recently applied to the regulator to become a SEC reporting company. Such companies are required to discuss risk factors that may adversely affect their results in all quarterly and annual reports.

In one section, which aims to outline the potential threats to the fund's future, it was noted that upgrading to ETH 2.0 may cause some difficulties for investors:

"The digital asset network's consensus mechanism is an essential aspect of its source code, and any failure to properly implement such a change could have a significant negative impact on the ETH value."

The report mentions that the inability to properly implement these changes may result in a temporary or permanent bifurcation which could have a negative impact on ETHE's stock.

It seems that the upcoming modernization so far does not diminish investors' interest in the fund. On the contrary, the assets of the Trust it manages have grown exponentially over the past year, from $ 67 million to over $ 800 million at the time of publication.

Technical Market Outlook:
The ETH/USD pair had failed to break through the 61% Fibonacci retracement of the last wave down and suddenly reversed all the previous gains. The local trend line support had been violated as well and the pair made a new local low seen at the level of $332.46. There was some Pin Bar candlestick made at the end of the move down, so a small bounce is possible up to the level of $345.20. If this local technical resistance is not clearly broken, then the down move should resume and head towards the next target seen at the level of $322.87 - $321.95.

Weekly Pivot Points:
WR3 - $403.75
WR2 - $387.38
WR1 - $368.10
Weekly Pivot - $351.05
WS1 - $333.15
WS2 - $315.51
WS3 - $296.13

Trading Recommendations:
The weekly and monthly time frame trend on the ETH/USD pair remains up and there are no signs of trend reversal, so buy orders are preferred in the mid-term. The key mid-term technical support is currently seen at the level of $305.20 - $321.95, so all the dynamic corrections are still being used to buy the dips. The next mid-term target for bulls is seen at the level of $500.

Analysis are provided byInstaForex.

Best regards, PR Manager / Learn more about InstaForex Company at http://instaforex.com

Re: InstaForex Analysis

Forecast for USD/JPY on October 8, 2020

USD/JPY
The Japanese yen was able to overcome the resistance of two indicator lines at once - balance and MACD, and today it continues to rise above them. The Marlin oscillator continues to grow in the zone of positive values, the nearest target at 106.34 is open, we are waiting for the moment we overcome this resistance - the embedded price channel line, and for the price to rise to the 106.96 level - to the high of August 28.

https://forex-images.ifxdb.com/userfiles/20201008/analytics5f7e88e37531a.jpg

The price continues to steadily grow above the indicator lines on the four-hour chart, while Marlin is rising in the zone where bulls are in control. We are waiting for the USD/JPY pair to grow further. Today's report on the balance of payments for the month of August, which showed growth from 0.96 trillion yen to 1.65 trillion yen, provides optimism for Japanese investors.

https://forex-images.ifxdb.com/userfiles/20201008/analytics5f7e88e66d8c7.jpg

Analysis are provided byInstaForex.

Best regards, PR Manager / Learn more about InstaForex Company at http://instaforex.com

Re: InstaForex Analysis

Technical Analysis of GBP/USD for October 9, 2020

https://forex-images.ifxdb.com/userfiles/20201009/analytics5f7ff42fef772.jpg


Technical Market Outlook:
Despite the recent bounce from the upper channel line seen at the level of 1.2848, the GBP/USD pair keeps trading below the key technical resistance located at the level of 1.2979 - 1.3017. The bounce indicated some bullish pressure at this level and the upper channel line is being guarded strongly, but after some time we can see the momentum decreased and the Pound is trading horizontally. However, if the price will enter the old main channel zone, then the sell-off might accelerate, so the key technical support is again seen at the level of 1.2848. The next target for bulls after the bounce is seen at the level of 1.2979.

Weekly Pivot Points:
WR3 - 1.3265
WR2 - 1.3116
WR1 - 1.3034
Weekly Pivot - 1.2892
WS1 - 1.2811
WS2 - 1.2658
WS3 - 1.2571

Trading Recommendations:
On the GBP/USD pair the main, multi-year trend is down, which can be confirmed by the down candles on the monthly time frame chart. The key long-term technical resistance is still seen at the level of 1.3518. Only if one of these levels is clearly violated, the main trend might reverse (1.3518 is the reversal level) or accelerate towards the key long-term technical support is seen at the level of 1.1903 (1.2589 is the key technical support for this scenario).

Analysis are provided byInstaForex.

Best regards, PR Manager / Learn more about InstaForex Company at http://instaforex.com

Re: InstaForex Analysis

Forecast for EUR/USD on October 12, 2020

EUR/USD
The euro pulled away from the 1.1754 level last Friday and went beyond the resistance of the balance indicator line on the daily chart. The Marlin oscillator has entered the positive zone, indicating the prospect of price growth. The growth target is the MACD line at the 1.1910 level, which coincides with the high on July 31 (blue mark).

https://forex-images.ifxdb.com/userfiles/20201012/analytics5f83d94318a53.jpg

The price settled above the signal level of 1.1810 on the four-hour chart, and even today's gap could not outwit this support. Marlin rises in the bullish zone. But the price forms a double or even, albeit not quite clear, triple divergence with the oscillator. And here, after slightly struggling above the signal level, a downward reversal is possible.

https://forex-images.ifxdb.com/userfiles/20201012/analytics5f83d9465f4da.jpg

Forming the final downward trend in the medium-term trend will progress if the price settles below the target level of 1.1754. It is possible that by the time the price attacks this level, the MACD line will also approach it.

The euro's growth looks strong on the daily chart, we will determine the probability of rising to 1.1910 at 60%, but the market can easily take advantage of the remaining 40% of the reversal scenario. The first condition for further growth is when the price settles above the Friday high. We are waiting for the development of events.

Analysis are provided byInstaForex.

Best regards, PR Manager / Learn more about InstaForex Company at http://instaforex.com

Re: InstaForex Analysis

AUD/USD forecast for October 13, 2020

AUD/USD
The Australian dollar did not close the gap at the opening of the week, so the current decline of 65 points from Friday's close may only be a correction from the growth of the previous days. According to Monday's review, the possible growth will also have the character of a correction from the movement starting September 1 and may end before reaching any of the target levels even at the nearest 0.7270.

https://forex-images.ifxdb.com/userfiles/20201013/analytics5f85262ba566e.jpg

The Marlin oscillator went into a downward trend zone. Formally, this means that the price is moving towards the first target level of 0.7055, but let's look at the situation on a smaller chart.

https://forex-images.ifxdb.com/userfiles/20201013/analytics5f85262eef02c.jpg

On the H4 chart, there is currently no price fixing under the level of 0.7190. The next candle should open under this level to achieve this. Also, the price remains above the Kruzenshtern indicator line at 0.7143 and even above the balance indicator line, i.e. the observed decline occurs within the growing short-term trend. Only the Marlin oscillator reminds the price that it is time to finish with growth but is still weak.

So, for the development of a downward scenario in the short term up to two weeks, the price should be fixed under the Kruzenshtern line below 0.7143. In the case of a medium-term decline in the AUD/USD currency pair, the impact of the gap (especially insignificant) can be ignored, sometimes they are closed only after a few years.

Analysis are provided byInstaForex.

Best regards, PR Manager / Learn more about InstaForex Company at http://instaforex.com

Re: InstaForex Analysis

Forecast for EUR/USD on October 14, 2020

EUR/USD
The S&P 500 lost 0.63% on Tuesday, on the news that Johnson & Johnson's anti-skin vaccine trial was suspended due to severe side effects, and so the euro fell by 66 points. This, as we see it, stopped the speculative growth over the euro that has been ongoing for the past two weeks. The price moved below the target level of 1.1754, having reversed from the resistance of the balance line on the daily chart. The Marlin oscillator is back in the negative territory. Now we are waiting for the price to drop to the target level of 1.1650, then to 1.1550 (November 2017 low).

https://forex-images.ifxdb.com/userfiles/20201014/analytics5f8678d09d50f.jpg

The price settled under the MACD line on the four-hour chart, while Marlin is in the negative zone. Conditions for a further decline have been formed, we are waiting for the price at the indicated levels.

https://forex-images.ifxdb.com/userfiles/20201014/analytics5f8678d3d203f.jpg

Analysis are provided byInstaForex.

Best regards, PR Manager / Learn more about InstaForex Company at http://instaforex.com

Re: InstaForex Analysis

Forecast for EUR/USD on October 15, 2020

EUR/USD
The situation has not changed for the euro over the past day. Trading was weak on Wednesday, the price is also settling below the 1.1754 level. The Marlin oscillator moves along the border that separates the growth zone from the decline zone on the daily chart. Outwardly, the situation is neutral, but the price is developing below the red balance indicator line, which means consolidating in a dynamic downward trend. The 1.1650 target is dominant, the probability of reaching it is 65-70%.

https://forex-images.ifxdb.com/userfiles/20201015/analytics5f87cf6fa46d1.jpg

The four-hour chart shows that yesterday's attempt to go beyond the area above the MACD line turned out to be weak, the price has already settled below it and is ready to continue its decline. The Marlin oscillator is growing in the downward trend zone, but this growth in structure is the indicator unloading before declining even deeper.

https://forex-images.ifxdb.com/userfiles/20201015/analytics5f87cf7291134.jpg

Analysis are provided byInstaForex.

Best regards, PR Manager / Learn more about InstaForex Company at http://instaforex.com

Re: InstaForex Analysis

Forecast for EUR/USD on October 16, 2020

EUR/USD
The euro opened and ended Thursday at 1.1754, the area which is below the key level of the lower boundary of the monthly range of the second half of August and the first half of September. This means that the initial condition for the medium-term downward trend has been met. We are waiting for the price to fall to 1.1315. But the euro's first target is the 1.1650 level, followed by the second target at 1.1550 - the November 2017 low. The Marlin oscillator has strengthened in the territory of the downward trend zone.

https://forex-images.ifxdb.com/userfiles/20201016/analytics5f89253c51ef6.jpg

According to the indicators, the trend is downward on the four-hour chart, but the signal line of the Marlin oscillator sharply turned upwards, which may indicate a deepening correction. The limit for the corrective growth is the 1.1754 level . The price will give a new downward momentum if the price moves below yesterday's low of 1.1688.

https://forex-images.ifxdb.com/userfiles/20201016/analytics5f89253f4bc6c.jpg

Analysis are provided byInstaForex.

Best regards, PR Manager / Learn more about InstaForex Company at http://instaforex.com

Re: InstaForex Analysis

Technical Analysis of EUR/USD for October 19, 2020

https://forex-images.ifxdb.com/userfiles/20201019/analytics5f8d306e6bafc.jpg

Technical Market Outlook:

The EUR/USD pair has been seen moving lower at the beginning of the trading week. The last lower low was made at the level of 1.1688, just below the technical support seen at the level of 1.1696 and this is the next target for the bears. The nearest technical resistance is seen at the level of 1.1746. Despite the oversold conditions, the momentum remains weak and negative, which support the short-term bearish outlook.

Weekly Pivot Points:
WR3 - 1.1924
WR2 - 1.1873
WR1 - 1.1783
Weekly Pivot - 1.1733
WS1 - 1.1641
WS2 - 1.1593
WS3 - 1.1509

Trading Recommendations:
Since the middle of March 2020 the main trend is on EUR/USD pair has been up, which can be confirmed by almost 10 weekly up candles on the weekly time frame chart and 4 monthly up candles on the monthly time frame chart. Nevertheless, weekly chart is recently showing some weakness in form of a several Pin Bar candlestick patterns at the recent top seen at the level of 1.2004. This means any corrections should be used to buy the dips until the key technical support is broken. The key long-term technical support is seen at the level of 1.1445. The key long-term technical resistance is seen at the level of 1.2555.

Analysis are provided byInstaForex.

Best regards, PR Manager / Learn more about InstaForex Company at http://instaforex.com

Re: InstaForex Analysis

Forecast for EUR/USD on October 20, 2020

EUR/USD
The euro has grown by 50 points on Monday. News agencies attribute the growth to hopes for a stimulus package in the United States before the presidential election and the imminent appearance of a coronavirus vaccine. As a rule, there are two cases why the media releases information: to cover up speculative operations, and when no one knows the reason. At the moment, we do not see any sense in speculative operations, respectively, this is how large players operate. Appetite for risk in the market has not increased, as US stock indexes lost around one and a half percent yesterday.

https://forex-images.ifxdb.com/userfiles/20201020/analytics5f8e62c3d7797.jpg

Nevertheless, the momentum is set, the price could slightly rise a little more before it decisively falls. The growth target could be the October 6 high at 1.1808. The price crossed the balance indicator line on the daily chart, while Marlin entered the growth zone. A delay above the levels will strengthen the bulls' position and the pair could grow to 1.1915 in the near future - to the MACD line on the daily timeframe. If the pair closes below 1.1754, which will also correspond to the close below the balance line, then a deeper movement down to the target levels 1.1650 and 1.1550 will begin tomorrow.

https://forex-images.ifxdb.com/userfiles/20201020/analytics5f8e62c6c6c8d.jpg

The price settled above both indicator lines on the four-hour chart, Marlin is in the positive zone, indicating a short-term downward reversal. Here the situation repeats the daily scenarios - the price settling below 1.1754, respectively, and below the MACD line, will become a platform for reaching 1.1650. Settling in the area above 1.1808 will not yet be a condition for rising to 1.1915 just yet, as there are other resistances along this speculative and volatile path. For example, 1.1831 is the peak on October 9.

Analysis are provided byInstaForex.

Best regards, PR Manager / Learn more about InstaForex Company at http://instaforex.com

Re: InstaForex Analysis

Technical Analysis of ETH/USD for October 21, 2020

https://forex-images.ifxdb.com/userfiles/20201021/analytics5f8fc941c4e60.jpg

Crypto Industry News:
Speculation about Ethereum 2.0 continues, and there are newer and newer leaks from insiders. One recent speculation is where the developer of Ethereum 2.0 predicts that a smart protocol contract allowing their Ethers to be deposited on 2.0 networks will be released in a matter of days. The staking process itself would start later this year.

ConsenSys developer Ben Edgington posted an entry that predicts the genesis of the ETH 2.0 beacon chain will take place in the next six to eight weeks.
In a post announcing the launch of the zero version for client 1.0, Edgington revealed that the protocol's smart contract feature should be announced this week. A smart escrow contract that allows ETH sending between Network 1.0 and Network 2.0 and is one of the few remaining updates needed to facilitate Ethereum 2.0 rollout in Phase 0. To complete Phase 0 launch, 500,000 Ethers will need to be staked once the beacon chain has started. After that, the network will prepare for the official launch for several weeks.

Technical Market Outlook:
The ETH/USD pair has extended the retracement towards the level of 61% located at $381.85, then the market pulled back towards the intraday support at $375.52 and bounced to the $381.85 again. The target for bulls is still seen at the level of $400 and the bulls are consolidating the recent gains. The nearest technical resistance is seen at the level of $389.90 and at the swing top at $394.95. On the other hand, the target for bears is seen at the level of $360.60 and $355.60 and the nearest technical support is seen at the level of $369.37.

Weekly Pivot Points:
WR3 - $424.52
WR2 - $408.88
WR1 - $391.97
Weekly Pivot - $376.47
WS1 - $357.63
WS2 - $341.22
WS3 - $328.22

Trading Recommendations:
The weekly and monthly time frame trend on the ETH/USD pair remains up and there are no signs of trend reversal, so buy orders are preferred in the mid-term. Moreover, bulls had bounced from the weekly trend line support last week and now are away from it. The key mid-term technical support is currently seen at the level of $305.20 - $321.95, so all the dynamic corrections are still being used to buy the dips. The next mid-term target for bulls is seen at the level of $500.

Analysis are provided byInstaForex.

Best regards, PR Manager / Learn more about InstaForex Company at http://instaforex.com

Re: InstaForex Analysis

Forecast for EUR/USD on October 22, 2020

EUR/USD
Yesterday, the effect of good expectations worked on the markets - according to Michel Barnier, investors sensed the possibility of an EU-UK deal and began to buy both the euro and the pound. As a result, the euro grew by 39 points, the pound by 198 points. The euro did not reach the target level of 1.1915 by around 35 points, which raises a difficult question, will it work out at all or not? The signal line of the Marlin oscillator has already begun to reverse.

https://forex-images.ifxdb.com/userfiles/20201022/analytics5f90fc8f3b5db.jpg

The Marlin is also turning around on the 4-hour timeline, but there are no actual reversal signals yet. It is very likely that the price will still reach the designated target, slightly going beyond it in order to reach the MACD line on the daily scale, and this will form a divergence reversal with Marlin.

https://forex-images.ifxdb.com/userfiles/20201022/analytics5f90fc928fd6b.jpg

So, we are waiting for the price to grow to the previously indicated level in the area of the MACD line on the daily chart at 1.191520.

Analysis are provided byInstaForex.

Best regards, PR Manager / Learn more about InstaForex Company at http://instaforex.com

Re: InstaForex Analysis

Technical Analysis of GBP/USD for October 23, 2020

https://forex-images.ifxdb.com/userfiles/20201023/analytics5f926fe08968e.jpg

Technical Market Outlook:
The GBP/USD pair keeps going lower as the corrective cycle from the local high at 1.3180 continues. The price has broken below the 38% Fibonacci retracement seen at 1.3074 and is heading towards the level of 50% located at 1.3041. The market is coming off the overbought levels, so the price might get below 1.3000 zome again. The key technical support is still seen at the level of 1.2982 - 1.3017. Moreover, it is worth to keep an eye on the upper channel line again for any indication of broken support.

Weekly Pivot Points:
WR3 - 1.3222
WR2 - 1.3147
WR1 - 1.3005
Weekly Pivot - 1.2924
WS1 - 1.2790
WS2 - 1.2718
WS3 - 1.2567

Trading Recommendations:
On the GBP/USD pair the main, multi-year trend is down, which can be confirmed by the down candles on the monthly time frame chart. The key long-term technical resistance is still seen at the level of 1.3518. Only if one of these levels is clearly violated, the main trend might reverse (1.3518 is the reversal level) or accelerate towards the key long-term technical support is seen at the level of 1.1903 (1.2589 is the key technical support for this scenario).

Analysis are provided byInstaForex.

Best regards, PR Manager / Learn more about InstaForex Company at http://instaforex.com

Re: InstaForex Analysis

Forecast for EUR/USD on October 26, 2020

EUR/USD
The euro fully recovered on Friday after falling on Thursday, now the price intends to reach the target level of 1.1917 - the highs of September 10 and August 6. Perhaps growth will be slightly higher in order to reach the MACD line. The highest peak is seen at the upper border of the price channel at 1.1960. The Marlin oscillator is growing, the bullish trend of the corrective plan continues.

https://forex-images.ifxdb.com/userfiles/20201026/analytics5f9645682cba1.jpg

The price rises after a false departure under the MACD line on the four-hour chart, which is its own sign of continuing the movement after a false price maneuver. The same maneuver was made by the Marlin oscillator, now the price is in a growing position for all indicators on this timeframe. We are waiting for the price to rise to the designated target of 1.1917.

https://forex-images.ifxdb.com/userfiles/20201026/analytics5f96456b6f864.jpg

Analysis are provided byInstaForex.

Best regards, PR Manager / Learn more about InstaForex Company at http://instaforex.com

Posts: 651 to 675 of 1,547

Pages Previous 1 25 26 27 28 29 62 Next

You must login or register to post a reply

Forex Software → Market Analysis → InstaForex Analysis

Similar topics in this forum