fsb:introduction
Table of Contents
Technical Introduction
Forex Strategy Builder (FSB) is a visual backtester, generator and optimizer of forex strategies. The program is completely free to use and distribute.
Goals
- To backtest forex strategies, fast and easy, without requiring thorough knowledge of forex technical analysis and programming;
- To guarantee maximum reliability of the simulated trade result and the calculated statistics;
- To allow deeper analysis and further improvement of the strategies.
Application
- The strategies prepared with FSB can be automatically traded with the help of Forex Strategy Trader at every MT4 broker.
Main Features
- Forex Strategy Builder works offline. It has to be installed on the user‘s computer.
- The program uses real Historical Forex Rates for calculation of the indicators and backtesting. However, the data files are locally stored and a user has to update them manually.
- The forex strategies are built by using a combination of different technical indicators with their parameters and logic of application. FSB also takes into account the trade size and the averaging rules.
- The graphic user interface allows direct access to all indicators, conditions and parameters. Therefore, a user does not need writing any mathematical formulas or scripts in the process of building and testing a strategy;
- Forex Strategy Builder calculates the backtest result in real time and correspondingly shows all the indicator charts, the virtual account balance, the statistics and the trade journals.
Unique Features
Forex Strategy Builder includes several unique tools:
- Strategy Generator - automatically generates or improves a strategy;
- Strategy Optimizer - optimizes the numeric parameters of the strategy indicators;
- Strategy Overview - summarizes the logic and statistics of the strategy;
- Method Comparator - calculates the strategy by using different bar interpolation methods and compare the results;
- Intrabar Scanner - uses all the available shorter data periods in order to provide more reliable bar interpolation and backtest;
- Bar Explorer - shows the price route within each bar.
How It Works
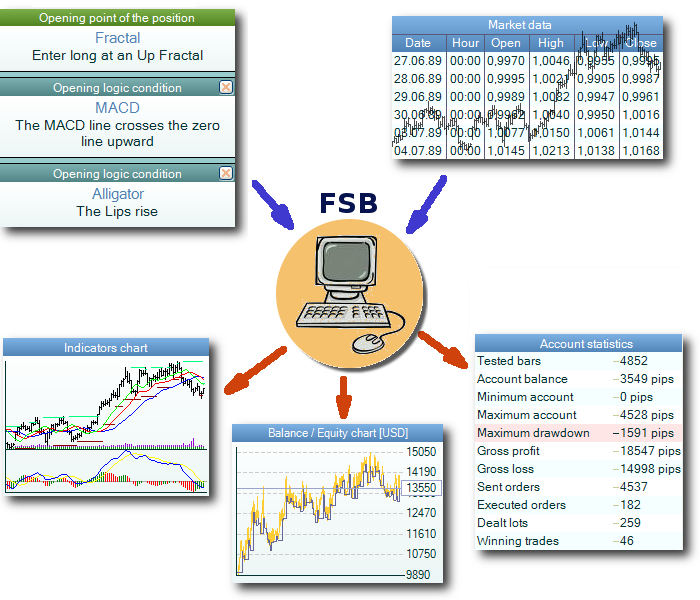
- The user chooses the financial instrument and FSB loads it from a data file;
- The user arranges his strategy using the available indicators and logic rules;
- The program instantly calculates the backtest result, draws the charts and shows the statistics and journals.
