Method Comparator
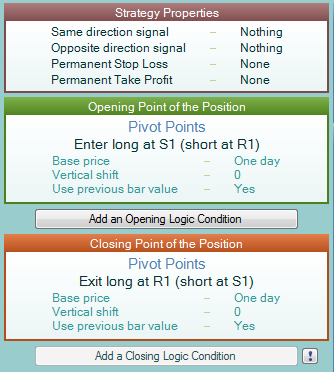
We are going to demonstrate how the comparator works using the demo strategy “Demo Scanner”. This strategy is included in the Forex Strategy Builder distribution. You con load it from File → Open menu command.

This strategy reveals about 200 - 300 Ambiguous Bars in the historical test. An ambiguous bar is any bar which allows different ways of executing the orders. In such cases, Forex Strategy Builder makes use of several Interpolation Methods. Each method traces a different price route. What is more, the orders are executed in a different sequence, which seriously affects the final result.
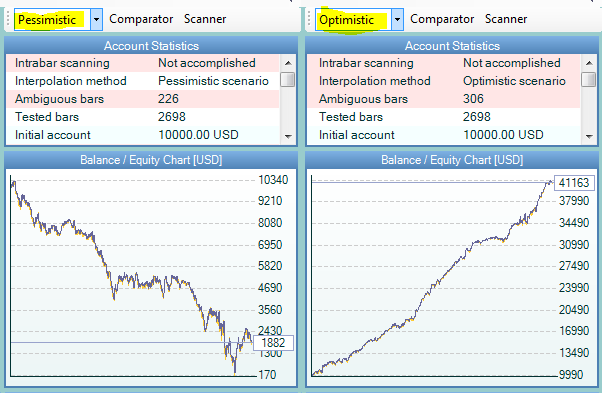
Following below are the balance charts of the strategy's test, performed using both the pessimistic and the optimistic interpolation methods. Initial account is $10,000
The pessimistic scenario leads to a final result of $1882, while the optimistic one results in $4163.

The charts emphasize the importance of choosing between the two scenarios when calculating a strategy which contains a large number of ambiguous bars.
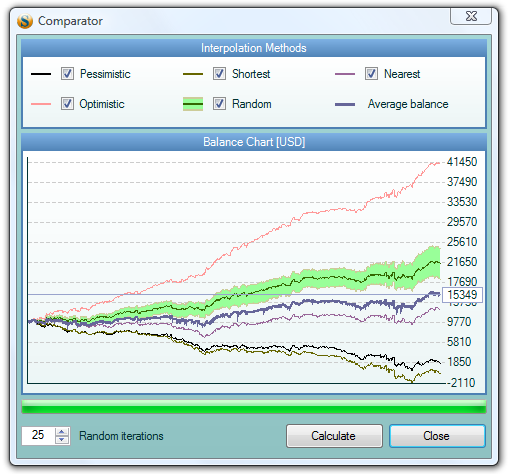
The Method Comparator tool serves to visualize the various scenarios for carrying out the historical test of the strategy on a single chart.

You can choose which methods should be visualized here. The comparator will calculate the average balance line. We assume that this average line is maximally close to the real strategy result.
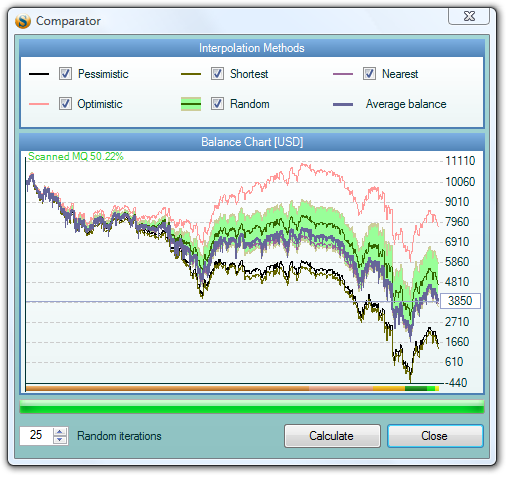
In order to improve the test's accuracy, you can use the automatic scan function. It can be activated from the Testing - Automatic Scan menu. After activating it, the program will load all available intrabar data. See the Intrabar Scanner article for more details.
Here are the charts of the same strategy with automatic scanning activated:

You can clearly see from the chart that the scanning option changes the testing result, making it more accurate. Therefore, we can conclude that for strategies which includes a number of ambiguous bars, the use of Comparator and Scanner is highly recommended.