Table of Contents
Intrabar Scanner
The scanner serves to improve the accuracy of the strategy backtest when Ambiguous Bars occur.

When Scanner starts it loads all available intrabar data for the respective financial instrument. Scanning is carried out automatically.
In case you have updated the data, you can use the Reload to reload it.
Once the intrabar data are loaded, you can switch on the Automatic Scan option. It will force Forex Strategy Builder to execute intrabar scanning at every strategy calculation.
Intrabar Data
The table contains information about the loaded data.
- Period - period of data.
- Bars - shows how many bars of the respective data have been loaded;
- From - shows the number of the time period bar from which the respective intrabar data begins;
- Until - shows the number of the time period bar up to which the respective intrabar data can be used. After that bar, data from a shorter period is available;
- Cover - shows how many bars from the main period are covered by this intrabar data;
- % - shows what percentage of the bars is taken up by this data;
- Label - shows the colour in which the data is presented.
The scanner loads all available data periods, starting from the main period of the strategy, and continues until the shortest period available. On the screen shot above, we see that the longest period loaded is 1 Day. That is because this particular strategy is built on a daily chart. We also see that the coverage of daily bars is zero. The reason is that the loaded four hours data fully cover all the daily bars.
The files containing the historical data need to be in the same folder on your disk. This is Forex Strategy Builder\Data folder by default. You can change this folder using the Market → Data Directory option.
How the Scanner Works
Let us take a strategy, which opens a long position at the beginning of the bar and has two close prices, at a profit and at a loss. Lets the data period be one day.
With this strategy, it is possible for the two exit prices to be within the same bar. We call such a bar ambiguous. It is not clear which of the two exit prices is reached first.
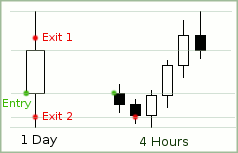
Here is an example of an ambiguous bar:

The open price of the position is marked Entry, the close-at-a-profit price is marked Exit 1, and the close-at-a-loss price is marked Exit 2. In that example, the day chart cannot determine at which price the position will close.
The solution here is scanning the bar using intrabar data. Using a four-hour chart, we can see that after opening the bar, the price starts moving downwards and reaches the Low price. Then the price rises to the High price of the day and goes down to the Close price. This data makes it clear that the position closes at price Exit 2 (at a loss), and the other exit order of price Exit 1 must be cancelled.
If four-hour data is not enough to determine what the correct sequence of order execution is, it can happen if both exit prices are located within a single four-hour bar, the scanner will also use a shorter data period. This process continues until the scanner check the shortest period available. If however, no intrabar period give a clear answer which order has to be execute first, Forex Strategy Builder will mark the bar ambiguous and will apply the chosen interpolating algorithm in order to decide what order to execute.
Scanning significantly reduces the number of ambiguous bars if there is enough intrabar data available.