forex software

Create and Test Forex Strategies

forex software

Skip to forum content

Forex Software

Create and Test Forex Strategies

You are not logged in. Please login or register.


(Page 67 of 75)

Forex Software → Market Analysis → Market Update by Solidecn.com

Pages Previous 1 65 66 67 68 69 75 Next

You must login or register to post a reply

RSS topic feed

Posts: 1,651 to 1,675 of 1,856

1,651

Re: Market Update by Solidecn.com

EURUSD's Next Move: Navigating Above 1.091 Key Support
https://i.postimg.cc/t4PzRq6y/EURUSD-H4.png

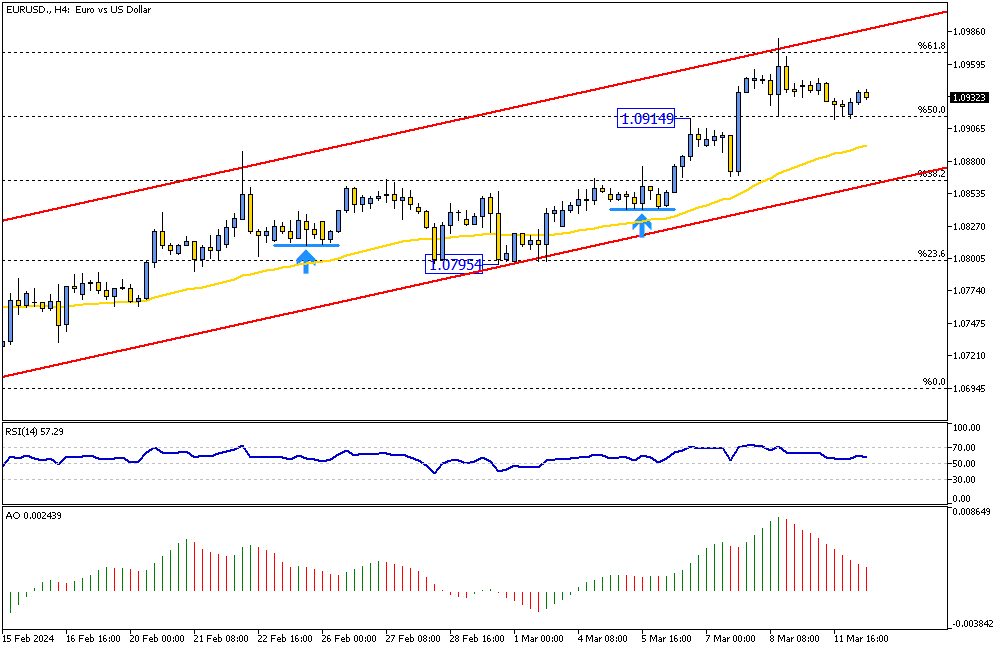
Solid ECN – The EURUSD formed a hammer candlestick pattern on the 4-hour chart, clinging to the 50% Fibonacci support level at the 1.0914 mark. As of writing, the pair is trading at about 1.093, slightly above the resistance. While the European currency gains ground against the U.S. dollar within the bullish channel, the technical indicators do not offer significant insights.

From a technical standpoint, the next target would be 1.1 if the price maintains its position above 50%.

Conversely, if the price dips below the 50% level, it will likely decline to the 38.2% level, coinciding with the lower band of the channel.

1,652

Re: Market Update by Solidecn.com

GBPUSD's Potential Downshift and Support Levels

https://i.postimg.cc/TwnjWkpy/GBPUSD-Daily.png

Solid ECN – The pound sterling has pulled back from a significant level, the 78.6% Fibonacci resistance against the U.S. Dollar, resulting in the pair trading below 1.2827. Concurrently, the RSI indicator has retreated from the overbought area and is heading toward the 50 level.

This downshift could extend to the EMA 50, which aligns with the rising trendline.

Traders should pay close attention to the 61.8% Fibonacci support, which could present buying opportunities. If this level holds, the GBPUSD price will likely rise and retest the 1.2893 resistance.

However, if the rising trendline breaks, it's a clear sign that the bullish scenario should be invalidated. In this case, the consolidation phase will likely extend to the 1.2599 mark, the 50% Fibonacci support.

Therefore, we suggest observing the market's behavior around the EMA 50.

1,653

Re: Market Update by Solidecn.com

Bearish Signals: AUDUSD Technical Indicators Review

https://i.postimg.cc/KcWZK39t/AUDUSD-H4.png

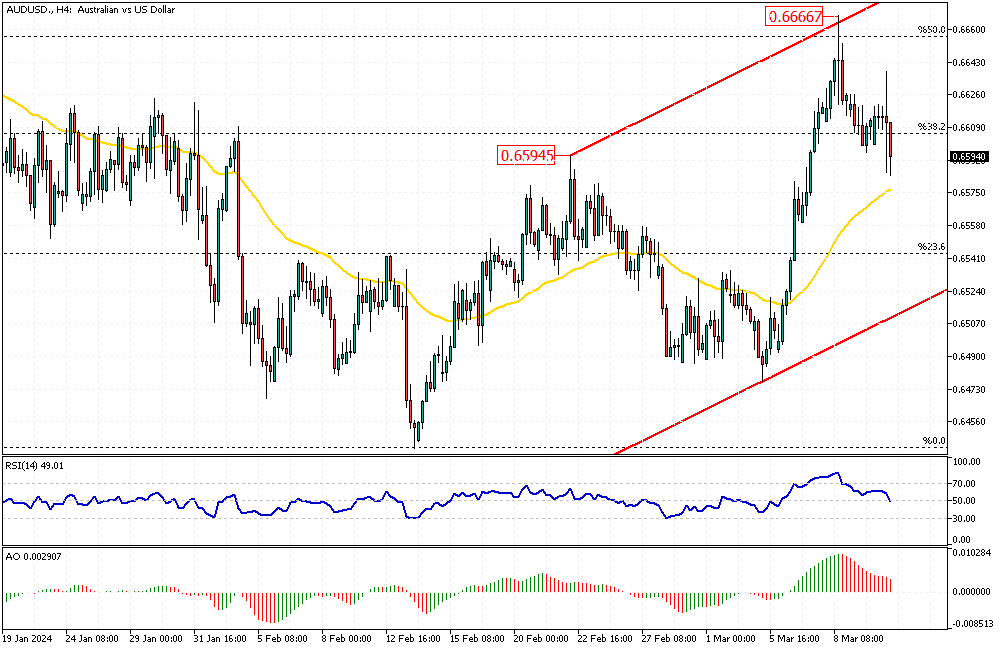
Solid ECN – The seller of the AUDUSD pair formed a long wick candlestick pattern on the 4-hour chart, close to the 50% Fibonacci resistance at the 0.666 mark. Consequently, the pair dipped below 38.2% and is testing the EMA 50 as of writing.

The technical indicators signal a bear market, with the RSI closing below 50 and the Awesome Oscillator bars being red and declining.

From a technical standpoint, the AUDUSD pair has created a new higher high since the beginning of the year, and this is the first time the value went as high as 0.666. Therefore, the Australian currency is bullish against the U.S. dollar. That said, if the EMA 50 can withstand today's selling pressure, the market will likely aim for the upper band of the rising flag, which is close to the 61.8% resistance level.

Conversely, if the AUDUSD dips below the EMA 50, the next support level is 23.6%. Traders should watch the EMA 50 closely and adjust their strategy accordingly.

1,654

Re: Market Update by Solidecn.com

NZDUSD's Critical Levels: EMA 50 as the Decisive Barrier

https://i.postimg.cc/sgrZv7hx/NZDUSD-Daily.png

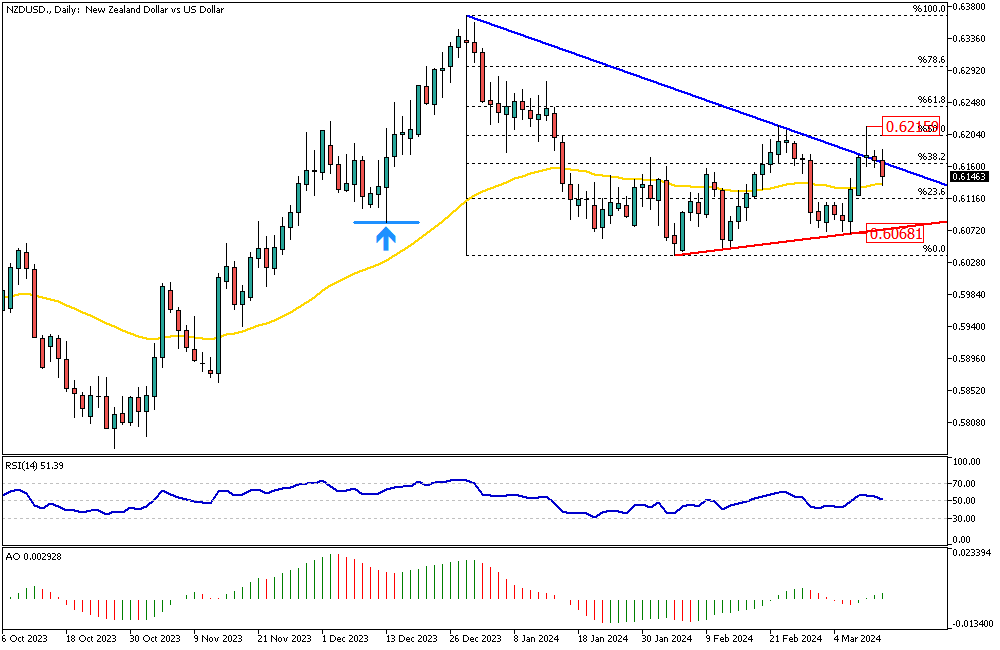
Solid ECN – The NZDUSD currency pair failed to stabilize the price above the 38.2% Fibonacci support level, and consequently, it dipped below the descending trendline depicted in blue. The EMA 50 is currently preventing the price from dipping further. If this price breaches the 50-exponential moving average, the next target will likely be 0.6068, followed by the February low.

The 0.6215 mark is the pivotal point between a bull and bear market. If the New Zealand dollar breaks this resistance against the U.S. Dollar, the previously mentioned forecast should be invalidated, and traders must reevaluate the market accordingly.

1,655

Re: Market Update by Solidecn.com

Canadian Dollar Dynamics: Economic Insights and Monetary Policy Updates

https://i.postimg.cc/DzcCc3k9/USDCAD-Daily.png

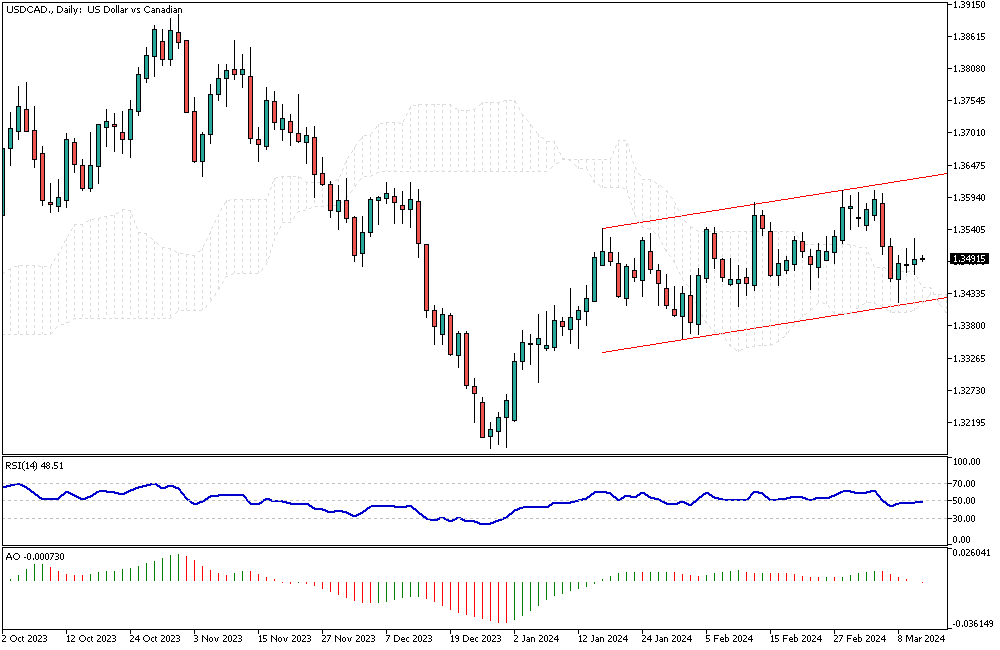
Solid ECN – The Canadian dollar is currently valued at around 1.35 per USD, returning from a one-month peak of 1.345 USD recorded on March 7. This drop is primarily due to the stability and strength of the US dollar. Meanwhile, the Federal Reserve is expected to hold interest rates steady at its upcoming March 19-20 meeting, with predictions leaning towards a rate cut in June. This decision comes after the consumer price index indicated a slight increase beyond expectations. Specifically, the overall inflation rate went up to 3.2%, surpassing forecasts, while the core inflation rate decreased slightly to 3.8% from 3.9%, still over the expected 3.7%.

In February, the unemployment rate in Canada increased to 5.8%, aligning with analysts' predictions. The country also witnessed an addition of 42,000 jobs, exceeding the anticipated numbers and showcasing a solid job market. Consequently, this strength allows the Bank of Canada to keep its monetary policy tight, helping curb further drops in the value of the Canadian dollar, also known as the loonie.

1,656

Re: Market Update by Solidecn.com

Significant Silver Price Dip from Three-Year High

https://i.postimg.cc/L6Jc00Nq/XAGUSD-H4.png

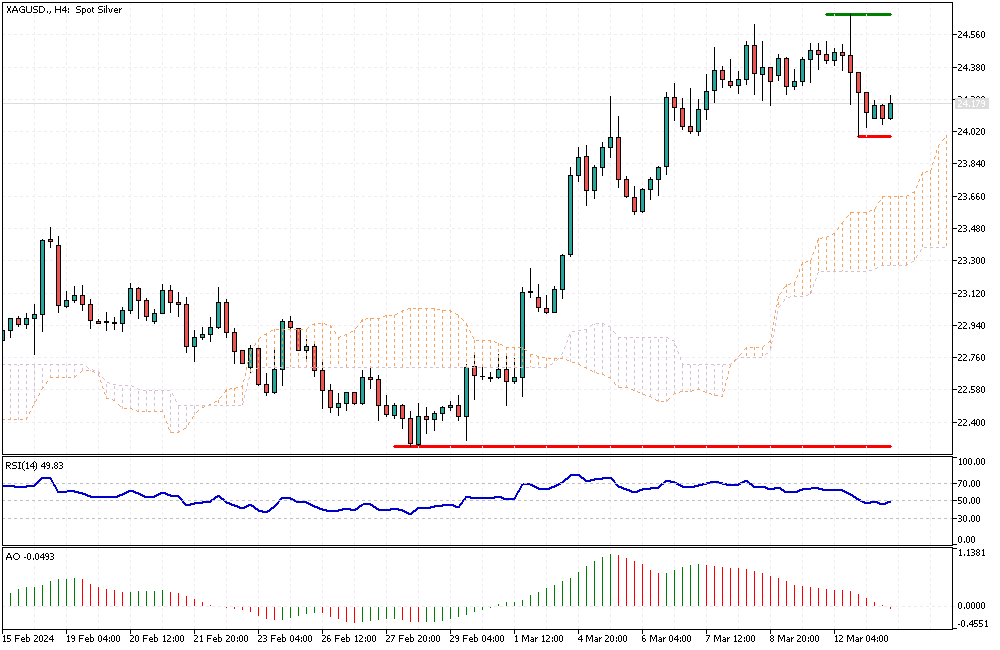
Solid ECN – Silver's price fell to approximately $24 per ounce, a slight decrease from the three-year peak of $24.4 per ounce in the prior session. This change occurred as investors closely monitored the possibility of the Federal Reserve lowering interest rates following the latest U.S. CPI (Consumer Price Index) figures.

These figures, which showed that the annual and core consumer inflation rates were slightly higher than expected, have significantly influenced the market's anticipation of the Federal Reserve cutting interest rates by June. Earlier, officials from the Federal Reserve and the European Central Bank hinted at potential rate decreases in 2024, which further increased the attractiveness of safe-haven assets like silver.

1,657

Re: Market Update by Solidecn.com

EURUSD's Bullish Momentum: Indicators and Support Levels

https://i.postimg.cc/4xh09VH7/EURUSD-H4.png

The EURUSD currency pair consolidates its recent gains above the 50% Fibonacci support level, the 1.091 mark, where it formed a hammer candlestick pattern.

As of writing, the Euro trades at about 1.092, with the RSI indicator hovering above 50, which can be interpreted as a signal for the continuation of the uptrend. The EMA 50 and the lower band of the bullish channel support the current uptick momentum. That said, the bull market is likely to extend and test 1.098 as its first barrier.

Conversely, the 38.2% level divides the bull market from the bear market. Therefore, if the price dips below this level, the bull market should be invalidated.

1,658

Re: Market Update by Solidecn.com

GBPUSD Uptrend Signals: RSI Indicator's Positive Shift

https://i.postimg.cc/269H6SHk/GBPUSD-H4.png

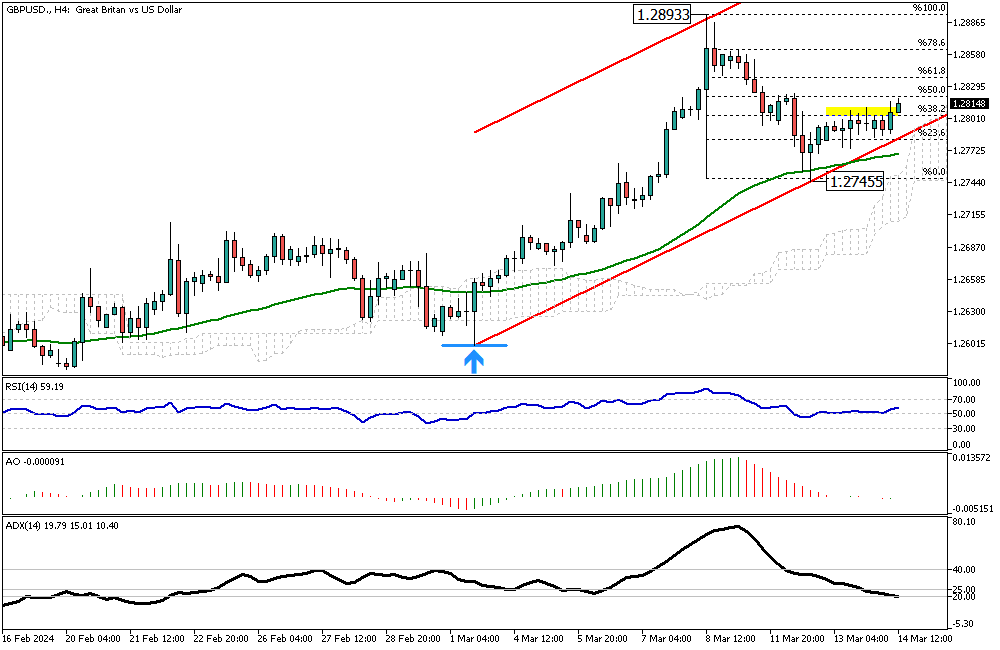
Solid ECN – The pound sterling is coming back from the 50 EMA, and as of writing, it is trading at about 1.279. The ascending trendline depicted in red provides support alongside the EMA 50. Interestingly, The RSI indicator has returned above the signal line, indicating that the uptrend will likely resume.

From a technical standpoint, as long as GBPUSD trades above the 1.2745 mark, the bull market will remain valid and will likely aim for the 50% Fibonacci resistance, followed by the 61.8%.

Conversely, a dip below the EMA 50 would invalidate the bullish market.

1,659 (edited by SolidECN 2024-03-13 17:25:53)

Re: Market Update by Solidecn.com

Mixed Indicators for the USDJPY

https://i.postimg.cc/3NqQ7Nfz/USDJPY-H4.png

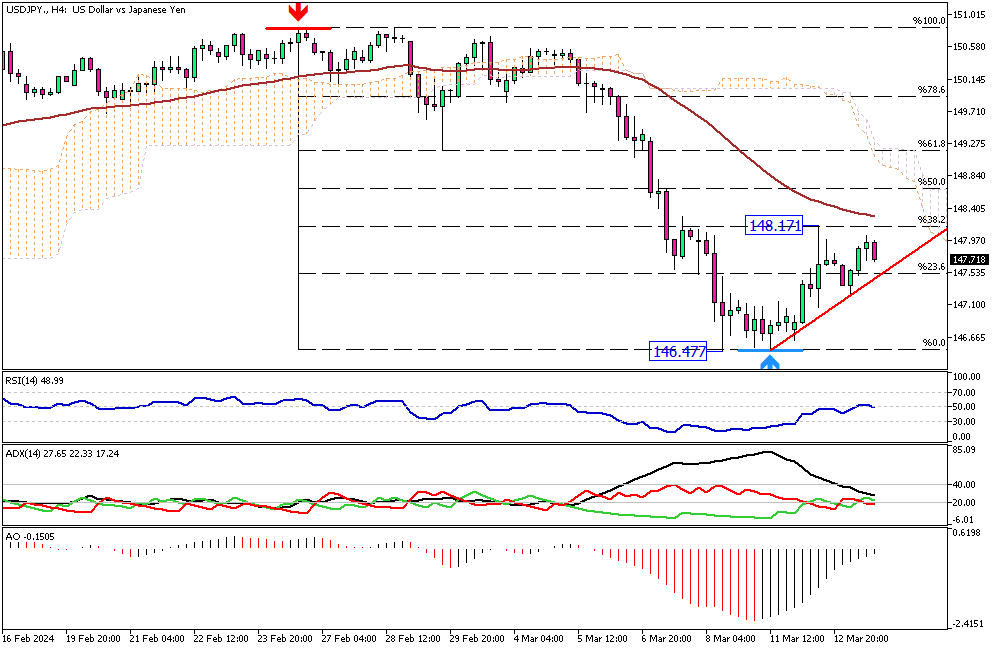
The U.S. dollar recovered from 146.4 and tested the 38.2% Fibonacci resistance at 148.1. The EMA 50 and the Ichimoku cloud reinforce this resistance level, making it more robust.

The RSI and the AO indicators signal a bull market; however, the ADX indicates a slowdown in market momentum, which could be interpreted as a halt in the recent uptick bias.

From a technical standpoint, we are in a bear market, and the current bullish wave could be a consolidation phase. Therefore, the market will likely decline if the price remains below the EMA 50. A break below the ascending trendline, depicted in red, can trigger selling pressures.

Conversely, if the USDJPY bulls can cross the EMA 50 and stabilize the price above it, the bear market should be invalidated, and traders should reevaluate the market.

1,660

Re: Market Update by Solidecn.com

EURUSD Bulls Await Consolidation

https://i.postimg.cc/fydr7Cwb/EURUSD-H4.png

Solid ECN – As expected, the Euro rose in the last day's trading session against the U.S. Dollar. The EMA 50 and the Ichimoku cloud maintained the bull market. However, we noticed a long wick candlestick pattern formed in today's trading session, which could be construed as the beginning of a consolidation phase since it is a higher low.

From a technical standpoint, the market is bullish, but it is best to wait for the consolidation phase to be over. Please note that the EURUSD price should exceed the trendline in black for the uptrend to resume. In this scenario, the bullish market will be triggered and will likely aim for the 1.1 mark.

The lower band of the channel plays a pivotal role between the bull and bear markets. For the uptrend to be invalidated, the price must dip below the 38.2% Fibonacci support.

1,661

Re: Market Update by Solidecn.com

GBPUSD's Next Move: A Crucial Phase Beyond Fibonacci Resistance

https://i.postimg.cc/90msBNnd/GBPUSD-H4.png

Solid ECN – As anticipated, the pound sterling is on an upward trajectory against the U.S. Dollar, and this uptrend persists. The RSI indicator remains above 50, while the ADX signal, hovering around the 20 level, does not indicate significant volatility. Apparently, the market awaits for the price to surpass 50% Fibonacci resistance before adding new bets on the current trend.

From a technical perspective, the bulls have already disregarded the previous day's high, and momentum is likely to continue rising after a minor struggle with the aforementioned Fibonacci level. If this scenario comes into play, the 78.6% level would be the next target.

Please note, dear traders, the bull market is robust, and for it to be invalidated, the price must dip below the Ichimoku cloud.

1,662

Re: Market Update by Solidecn.com

Australian Dollar Outlook: Bullish Trends and EMA 50 Support

https://i.postimg.cc/ZqbCyf0h/AUDUSD-H4.png

Solid ECN – The Australian dollar has stabilized above the 38.2% Fibonacci support level and the previously broken descending channel. Interestingly, the ADX indicator is making a return above the 25 level, interpreted as a sign that a new trend is on the horizon. This signal from the ADX aligns with the RSI, where it hovers above the 50 level.

From a technical standpoint, the EMA 50 supports the bullish bias on the currency pair. If the price stays above it, the next target for buyers would be the upper band of the bullish channel, which coincides with the 61.8% Fibonacci resistance level.

Conversely, the EMA 50 acts as the critical pivot between the bull and bear markets. The uptrend should be considered invalidated if the U.S. Dollar pushes the Australian dollar below the mentioned moving average.

1,663

Re: Market Update by Solidecn.com

Analyzing NZDUSD: The Battle within the Bearish Channel

https://i.postimg.cc/NG4DCFRB/NZDUSD-H4.png

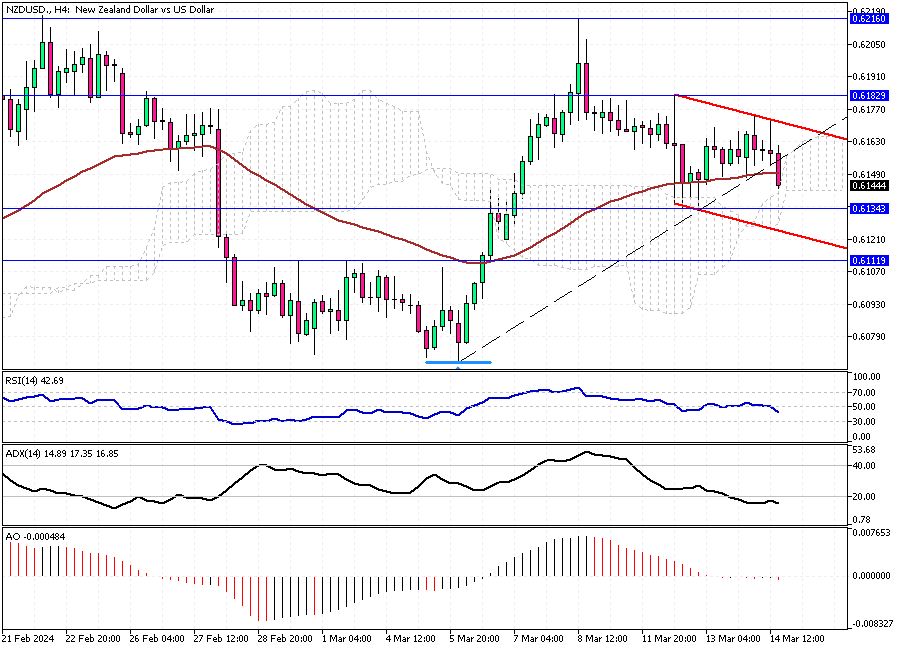
In this evening's trading session, the U.S. Dollar is pushing the price in its favor against New Zealand's currency. The technical indicators give mixed signals; therefore, we rely on the price action and the support and resistance areas.

From a technical standpoint, the pair trades within a narrow, bearish channel, which can be interpreted as a sideways market. The level at 0.613 acts as support; if this level is breached, the NZDUSD will likely dip to the next support, which is located at about 0.6111.

Conversely, the price must surpass 0.6182 for the uptrend to continue. In this case, March's higher high would be retested.

1,664

Re: Market Update by Solidecn.com

Analyzing the Potential Reversal in EURUSD Trends

https://i.postimg.cc/CxQMCM1y/EURUSD-H4.png

The U.S. Dollar has returned from the 1.096 resistance level against the European currency. This ceiling is supported by the 61.8% Fibonacci retracement level. As indicated in the 4-hour chart, the pair failed to surpass it on March 8.

As of writing, the EURUSD pair trades at about 1.088, close to the 1.086 support and slightly below the lower band of the bullish channel. Interestingly, this price is below the Ichimoku cloud and the EMA 50, which could be interpreted as a potential trend reversal.

From a technical standpoint, the bullish trend is invalidated since the price dipped below the cloud. However, the bears are required to close below the 38.2% Fibonacci level to trigger the main selling pressure. Failure to push the price below this level will likely lead to the price returning above the EMA 50, indicating that the uptrend may continue.


Conclusion:

For the bearish trend to resume, the price must close below the 1.086 level. Going short in the current market situation is risky because the bearish breakout lacks valid confirmation.

1,665

Re: Market Update by Solidecn.com

Indicators Point to a New Bearish Trend in GBPUSD

https://i.postimg.cc/g22ytntj/GBPUSD-H4.png

Solid ECN – The Pound sterling lost ground against the U.S. Dollar in yesterday's trading session. As depicted in the GBPUSD 4-hour chart, the pair dipped below the EMA 50 and is currently testing it as a resistance level. Interestingly, technical indicators signal a bearish outlook, with the RSI hovering below 50 and the Awesome Oscillator showing red bars. Notably, the ADX currently hovers above the 25 level, which can be interpreted as the beginning of a new trend.

From a technical standpoint, the bears have broken below the bullish channel in red and are currently stabilizing the price at about 1.276. Therefore, as long as the price trades below the cloud, the secondary trend would be bearish, with the bears aiming for the 1.270 resistance, followed by 1.266.

The bearish technical analysis should be invalidated if the Pound sterling rises higher than the March 14 high, the 1.282 mark.

1,666

Re: Market Update by Solidecn.com

Gold Price Stability Amid Federal Reserve Rate Cut Speculation

https://i.postimg.cc/SKnQTjT7/XAUUSD-Daily.png

On Friday, the price of gold remained stable, hovering around $2,160 per ounce. This marks its first decrease after three weeks of gains. The change comes amid uncertainties surrounding the Federal Reserve's interest rate cuts. This uncertainty is due to unexpectedly high Consumer Price Index (CPI) and Producer Price Index (PPI) data, coupled with a decrease in initial jobless claims.

These factors made investors rethink their previous expectations for more accessible monetary policies. Consequently, the likelihood of the Fed reducing rates in June has fallen to about 60% from the 74% estimated just last week. This shift has made gold, which does not yield interest, less attractive to investors.

However, gold's price is still near record highs, as it serves as a protective investment against inflation and increasing geopolitical tensions, especially after Russia decides to position its tactical nuclear weapons closer to NATO territories.

1,667 (edited by SolidECN 2024-03-18 08:21:25)

Re: Market Update by Solidecn.com

Analyzing GBPUSD's Bullish Sentiments Amid Recent Downtrend

https://i.postimg.cc/Y2VxHSc0/GBPUSD-Daily.png

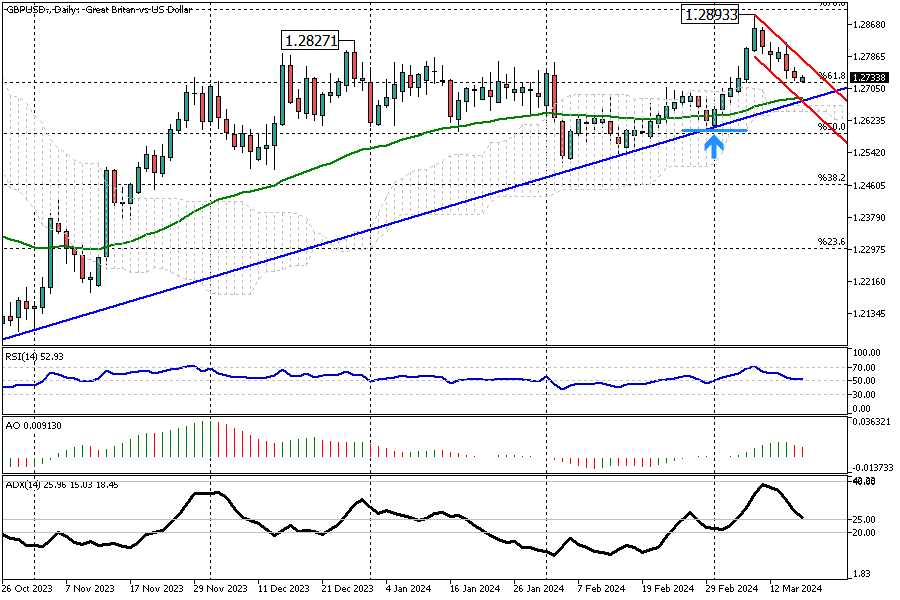
Solid ECN – Pound Sterling demonstrated its resilience at the start of the Monday trading session. It opened with a slight gap against the U.S. Dollar but quickly recovered. It is currently holding strong at around 1.273.

The pair trades above the bullish trend line, as indicated in blue on the GBPUSD chart. Therefore, the primary trend remains bullish. However, the price has fallen from the 1.289 high and is now experiencing a downtrend within the bearish channel, marked in red.

The data from the chart suggests that the current downward momentum may represent a consolidation phase, setting the stage for a potential bullish comeback. The EMA 50, aligning with the trend line and the resistance level supported by the Ichimoku cloud, could provide a solid support for buyers to initiate this optimistic turn of events.

Please note that the price must break out of the bearish channel for the uptrend to resume. In this scenario, the rise could continue and target the high from February as its first significant milestone.

1,668

Re: Market Update by Solidecn.com

Oil Prices Surge Amid Geopolitical Tensions and Economic Indicators

https://i.postimg.cc/L8M1qzXY/USOUSDDaily.png

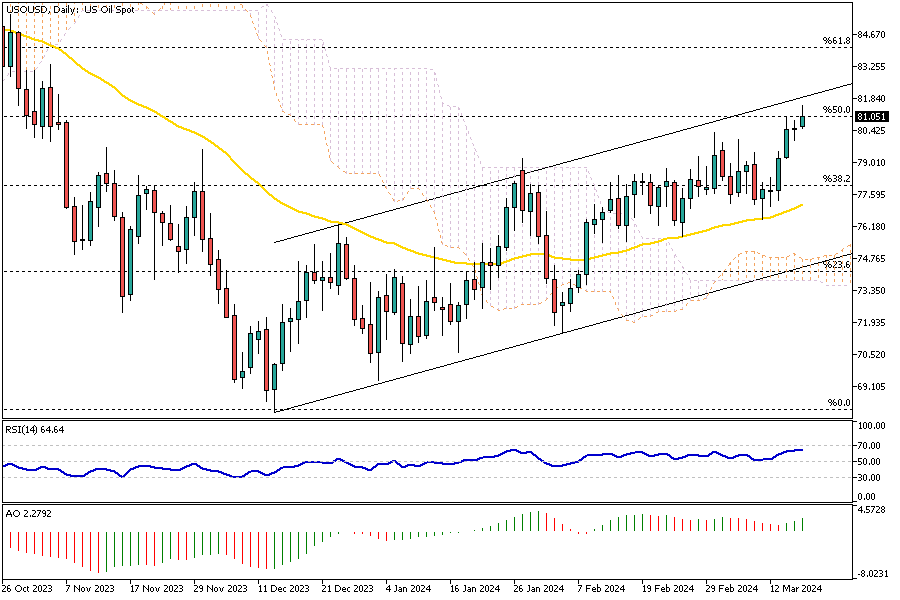
Solid ECN – WTI crude futures increased to over $81 per barrel on Monday, building on the previous week's growth as ongoing geopolitical tensions fuel worries about oil supply. In the past week, Ukraine intensified its drone attacks on Russian oil facilities, causing a shutdown of approximately 7% of Russia's refining capabilities in the first quarter, as per a Reuters report.

Furthermore, Israeli Prime Minister Benjamin Netanyahu announced intentions to expand into the Gaza Strip's Rafah region, diminishing the likelihood of reaching a peace deal. Additionally, this week, investors are keenly observing the decisions on monetary policy by leading central banks for signs that might indicate when interest rate reductions will occur. Last week saw a near 4% rise in oil prices following an optimistic demand forecast by the International Energy Agency, which also anticipates a minor shortfall in supply for the year.

1,669

Re: Market Update by Solidecn.com

AUDUSD's Resilience: A Test Against Ichimoku Cloud Resistance

https://i.postimg.cc/FKHD7VM9/AUDUSD-H4.png

Solid ECN – The Australian dollar rebounded from the 38.2% Fibonacci support level against the U.S. dollar in today's trading session. The pair is now testing the Ichimoku cloud as resistance, close to the EMA 50. The Awesome Oscillator bars are green, while the RSI remains below 50, giving mixed signals. Meanwhile, the ADX indicator has dropped to level 20, which can be interpreted as a slowdown in the trend.

From a technical standpoint, the bounce could extend to the upper band of the bearish flag depicted in red. However, as long as the AUDUSD price remains within the flag, the 23.6% Fibonacci level will likely be the next target.

The bear market should be invalidated if the price stabilizes itself above the cloud.

1,670

Re: Market Update by Solidecn.com

USDJPY at the Crossroads of Overbought Conditions

https://i.postimg.cc/NfQFB7Gd/USDJPY-H4.png

Solid ECN – The Japanese currency has again become bearish against the U.S. Dollar. As shown on the USDJPY 4-hour chart, the American currency has risen above the Ichimoku cloud and is trading at about 149.1 as of this writing.

Currently, the pair is testing the 61.8% Fibonacci support while the RSI indicator is about to enter the overbought area. Therefore, it is not recommended to go long on the U.S. currency in a saturated market; it is better to wait for the pair to form new higher lows and lower highs.

That said, with the Awesome Oscillator's red bars, there is a high chance for the market to drop to the ascending trendline in red. This level of support can provide a decent entry point to join the bull market.

Conversely, the bull market should be invalidated if the price falls below the 148.8 mark.

1,671

Re: Market Update by Solidecn.com

Rising Russian Crude Oil Prices and Global Impacts

Solid ECN – Russian Urals crude oil prices have recently climbed above $77 a barrel, approaching the high levels seen in October, and are following the general upward trend of global oil prices. Meanwhile, China is on track to bring in a historically high volume of Russian oil this month, although the quantity heading to India has fallen, as reported by Bloomberg.

Despite being targeted by recent attacks, Russia aims to increase its oil exports via western ports, thanks to extra shipments from companies like Rosneft and Tatneft. In December 2022, a price limit of $60 per barrel was set on Russian oil by the European Union, the G7 nations, and Australia. This measure aims to cut down the funding Russia receives for military operations in Ukraine.

1,672

Re: Market Update by Solidecn.com

WTI Crude Oil Prices Soar Amid Global Supply and Demand Dynamics

https://i.postimg.cc/fkQQVzdG/USOUSDDaily.png

Solid ECN – WTI crude oil prices remained above $82 per barrel on Tuesday, close to their peak since the start of November, boosted by concerns about supply. The reasons include Ukraine's recent drone attacks on three of Russia's oil refineries, which represent over 10% of Russia's oil refining capability. Meanwhile, in the Middle East, Iraq has said it will cut back its oil exports to 3.3 million barrels per day in the upcoming months to make up for going over its OPEC+ limit since January.

Additionally, Saudi Arabia's oil exports dropped for the second month in a row, reaching 6.297 million barrels per day in January, down slightly from December. On the other side, demand appears strong, with China, a major oil buyer, showing solid growth in industrial output and retail sales. The overall global demand for oil is also expected to remain robust this year.

1,673

Re: Market Update by Solidecn.com

USDCHF Hits New Heights Post-Wedge Breakout

https://i.postimg.cc/m2Qf8ZDP/USDCHF-Daily.png

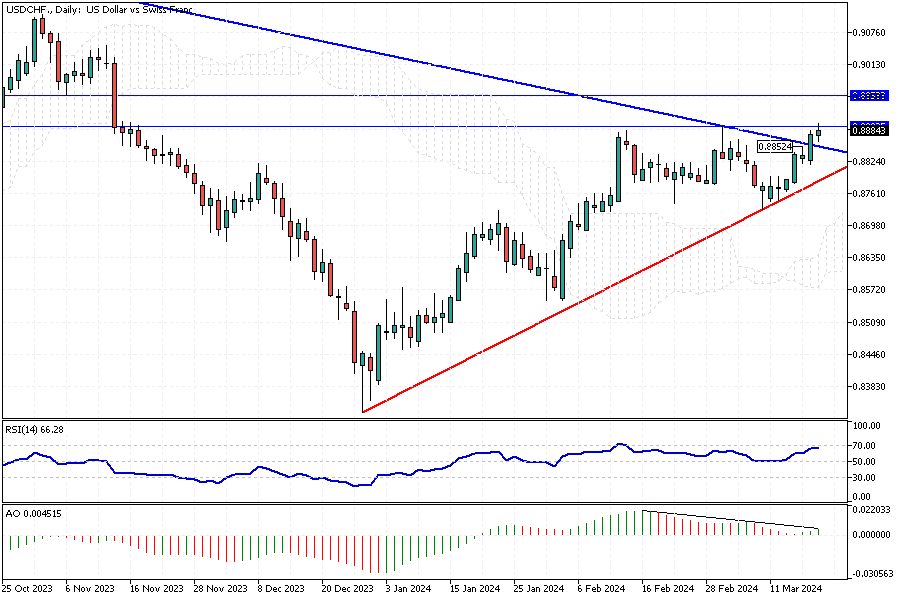
Solid ECN – The U.S. Dollar broke out from the wedge pattern in today's trading session against the Swiss franc and is testing the 0.889 barrier as of writing.

The Awesome Oscillator signals divergence, which could be interpreted as a sign that a consolidation phase is likely on the way. Therefore, the price might dip to 0.885 before a new bullish wave begins. Interestingly, the RSI indicator is nearing the overbought zone, signaling the same as the AO.

From a technical standpoint, the ascending trendline in red supports the bull market. As long as the pair trades above this level, the primary trend will remain an uptrend. In this scenario, the market will likely surpass the 0.889 resistance and aim for the next target, the 0.895 mark.

P.S. For the uptrend to resume, the market must pass and stabilize the price above the 0.889 mark.

1,674

Re: Market Update by Solidecn.com

BTCUSD Hits April Low: What's Next for Bitcoin Prices?

https://i.postimg.cc/76ghQxzm/BTCUSDH4.png

Solid ECN – Bitcoin flipped below the Ichimoku cloud in last week's trading session. The decline continued this week, and today BTCUSD hit a new low for April, trading below the $64,400 mark. Interestingly, the RSI and the Awesome Oscillator also point to a bear market. In addition to RSI and Ao, the ADX climbs to 40, signifying that the downtrend is strengthening.

From a technical standpoint, the EMA 50 and the upper band of the bearish channel, marked in red, act as resistance levels. If Bitcoin's price remains below $67,000, the next target is likely the $60,000 mark.

Conversely, for the uptrend to resume, the price must cross above the EMA 50 and maintain its position above it.


Noteworthy

It's important to note that the primary market is bullish, and the current downward momentum is considered a consolidation phase. During this phase, major players collect profits by sweeping the floor from retail traders.

1,675

Re: Market Update by Solidecn.com

Euro Drops as ECB Considers June Rate Cut Amid Slow Growth

https://i.postimg.cc/ncFgM20z/EURUSD-H4.png

Solid ECN – The euro fell toward the $1.08 mark, its lowest since March 1st, as investors processed reports of slower wage increases and cautious remarks from some European Central Bank (ECB) officials. They also looked forward to the Federal Reserve's policy meeting on Wednesday. ECB Vice President Luis de Guindos stated on Tuesday that the bank might consider lowering interest rates in June, highlighting the need for more information before changing policies.

ECB President Christine Lagarde mentioned possibly lowering rates earlier in the month due to falling inflation. The ECB's chief economist, Philip Lane, suggested a rate cut could come in the second quarter. Significantly, central bank leaders from Spain, the Netherlands, Ireland, Greece, and Slovakia, among the ECB's 26 Governing Council members, supported a decision in June.

Posts: 1,651 to 1,675 of 1,856

Pages Previous 1 65 66 67 68 69 75 Next

You must login or register to post a reply

Forex Software → Market Analysis → Market Update by Solidecn.com

Similar topics in this forum