forex software

Create and Test Forex Strategies

forex software

Skip to forum content

Forex Software

Create and Test Forex Strategies

You are not logged in. Please login or register.


(Page 69 of 70)

Forex Software → Market Analysis → Market Update by Solidecn.com

Pages Previous 1 67 68 69 70 Next

You must login or register to post a reply

RSS topic feed

Posts: 1,701 to 1,725 of 1,747

1,701

Re: Market Update by Solidecn.com

EURUSD Market Update

https://i.postimg.cc/LXd1ZCVN/EURUSD-H4.png

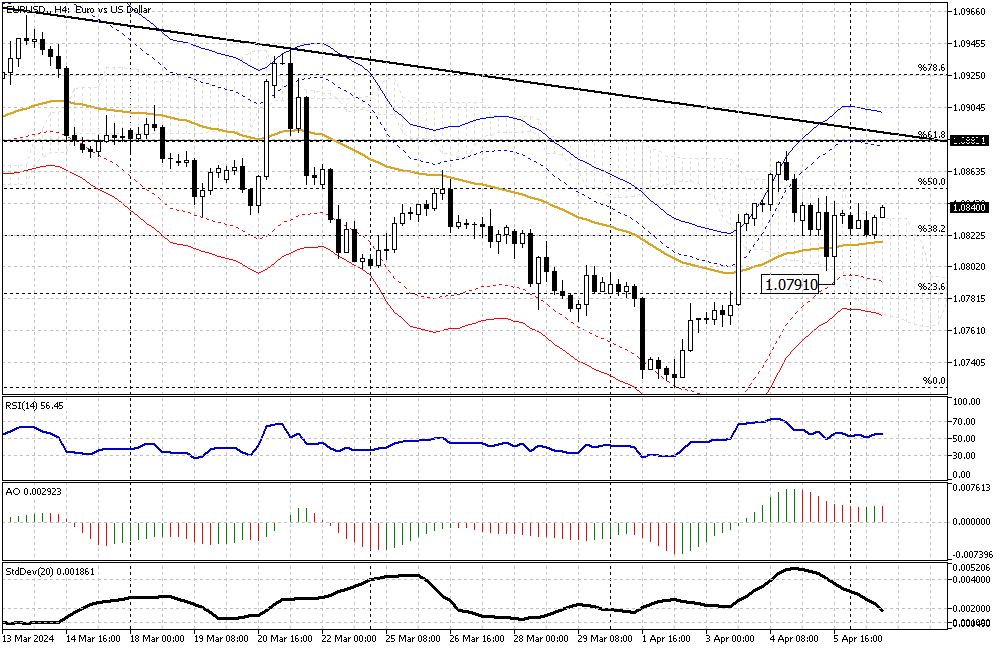
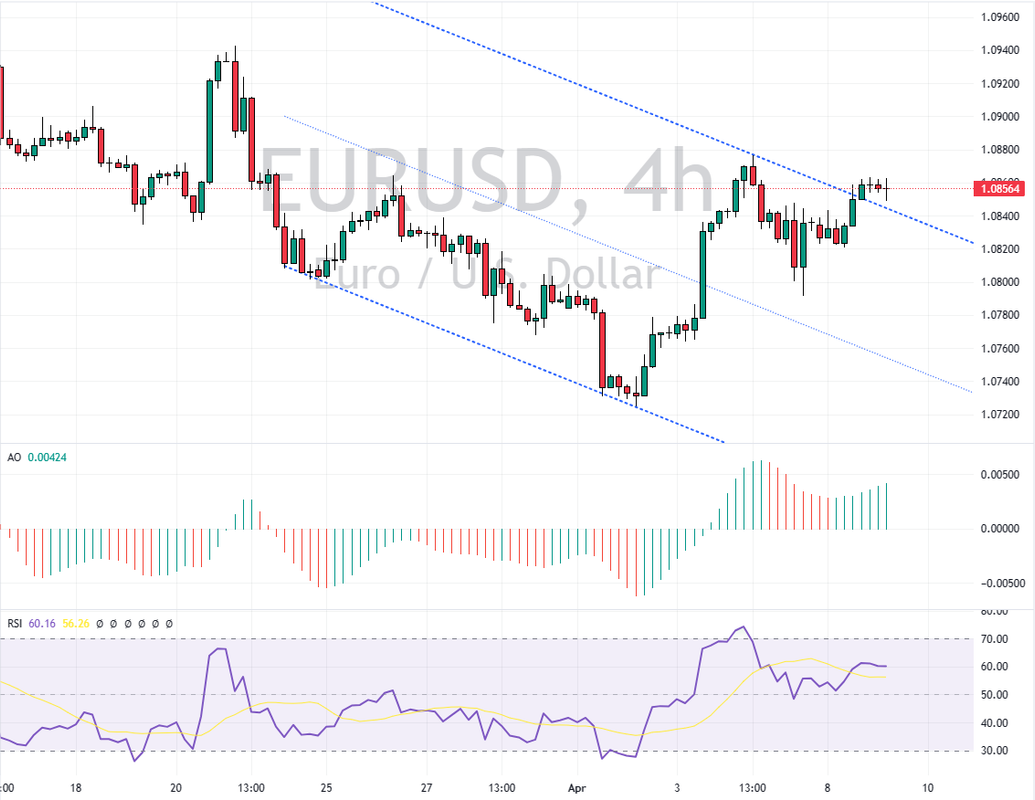
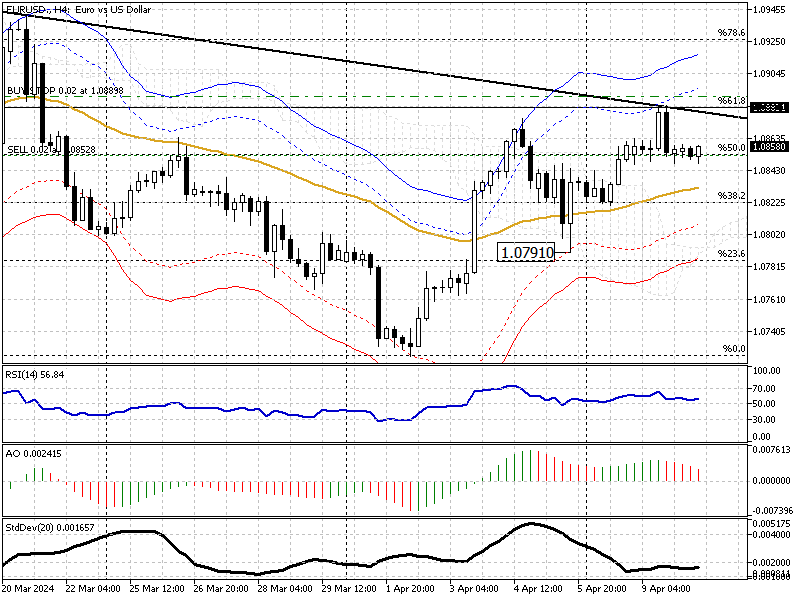
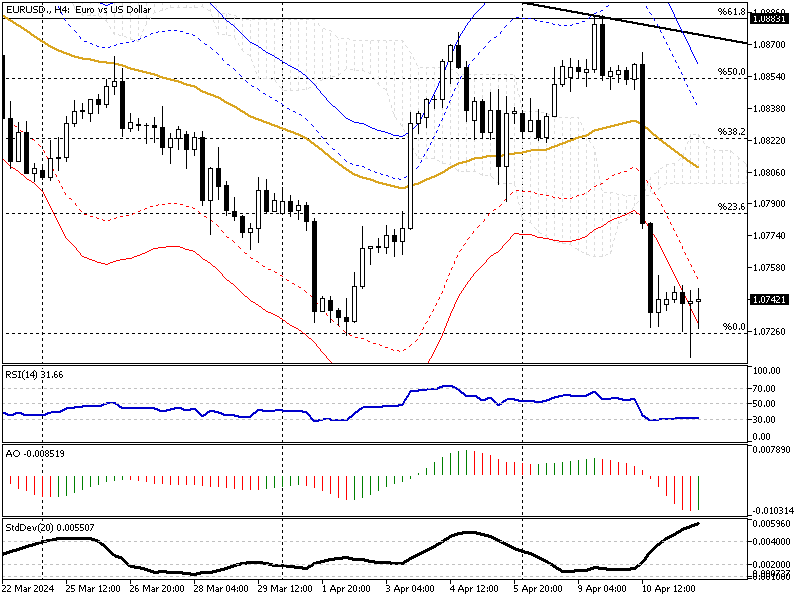
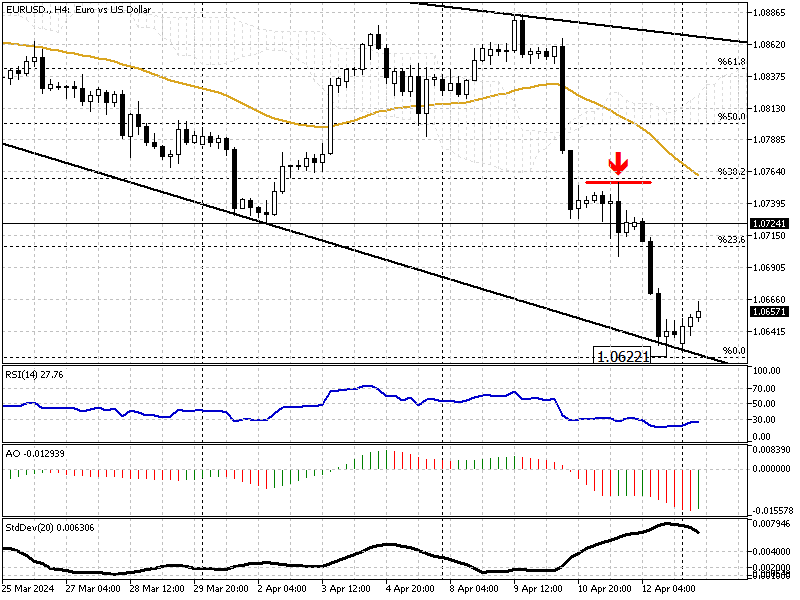
Solid ECN – In Monday's trading session, the Euro trades at about 1.083 against the U.S. Dollar, which is slightly above the EMA 50 and the 38.2% Fibonacci support level. It seems the pair is trying to stabilize itself above the aforementioned level after pulling back from the 23.6% Fibonacci level in Friday's late trading session.

The technical indicators give mixed signals, but the Standard Deviation indicates low activity and sideways momentum in the EURUSD market. That said, with the RSI (Relative Strength Index) hovering above 50, the price of the EURUSD might grow higher to test the 50% Fibonacci level followed by the 1.088 strong resistance area.

However, entering the market with a bullish outlook is risky since the primary trend is bearish. Therefore, it is recommended to wait and monitor the price action closely near the key levels mentioned above and seek opportunities to join the bear market.

From a technical standpoint, if the price rises to the 1.088 resistance, it would offer a decent price to go short on the EURUSD pair if the 4-hour chart forms a bearish candlestick pattern.

On the other hand, if the Euro dips below the EMA 50, this could signal a continuation in the downtrend, and retail traders can adjust their strategies accordingly and join the primary trend, which is bearish.

1,702

Re: Market Update by Solidecn.com

EURUSD Steady at $1.08 as ECB Meeting Nears, Rate Cut Hints Awaited

https://i.postimg.cc/R0WBfVtt/EURUSD-2024-04-09-11-52-54.png

Solid ECN—The euro remained steady at about $1.08, with investors taking a cautious stance as they awaited Thursday's European Central Bank (ECB) announcement.

It's widely anticipated that ECB officials will keep interest rates at their current record highs for the sixth time in a row. The focus is now on how the statement is worded and what ECB President Lagarde might say in her press conference to hint at when the first interest rate decrease of the year could happen.

Recent documents from the ECB show that the officials are more confident about inflation moving towards their goal of 2%, which makes a strong argument for a reduction in interest rates. On the other hand, the US dollar kept getting support because the latest data showed the American job market is still doing well, indicating that the Federal Reserve might not hurry to lower interest rates soon.

1,703

Re: Market Update by Solidecn.com

EURUSD Trends: A Shift Below Key Levels This Week

https://i.postimg.cc/dtwXm8dT/EURUSD-H4.png

Solid ECN – In the 4-hour chart, the EURUSD currency pair trades under the descending trendline, shown in black. This position came about after the pair developed a bearish engulfing pattern right around the 61.8% Fibonacci support level, suggesting the possibility of a trend change. At the same time, the awesome oscillator gives off a divergence signal, matching what the candlestick pattern indicates.

The pair must end below the 50 EMA for the downtrend to press on. If this happens, we could see the price heading towards the 23.6% Fibonacci support level, marking it as the initial goal for this week.

However, should the EURUSD pair's price climb above the 61.8% Fibonacci resistance level, the current bearish market analysis might no longer be applicable.

1,704

Re: Market Update by Solidecn.com

USDJPY Breakthrough: Bullish Uptrend Resumes, Ichimoku Cloud Watch

https://i.postimg.cc/XJRKwSpK/USDJPY-H4.png

Solid ECN – In the current trading session, the bulls of USDJPY have finally broken through the 159.9 barrier. This suggests that the uptrend is likely to continue. However, the next bullish target remains uncertain as there are no significant obstacles for the bulls.

It’s important to note that the Ichimoku cloud is the dividing line between bull and bear markets. We should consider pausing the bullish scenario if the price falls below this level.

1,705

Re: Market Update by Solidecn.com

USDCAD Breaks April High: What's Next?

https://i.postimg.cc/CxS6z5Tk/USDCAD-H4.png

Solid ECN — In this evening's trading session, The U.S. Dollar surpassed April's highest price point, the 1.3647 mark against the Canadian dollar. This uptick in momentum has led the RSI indicator to step into the overbought zone, indicating that the USDCAD pair might enter a short-term consolidation.

From a technical standpoint, this breakout paved the road to the 78.6% Fibonacci resistance. However, entering the bull market is not recommended when the market is saturated from buying pressure. That said, if the price returns to the 1.364 area followed by the 61.8%, it provides a decent entry point to join the buyers.

1,706

Re: Market Update by Solidecn.com

GBPUSD's Pullback: An Opportunity?

https://i.postimg.cc/yd77wp0R/GBPUSD-H4.png

Solid ECN—In yesterday's trading session, The GBPUSD pair dipped below 1.2593, April's lowest point against the U.S. dollar. As of writing, the pair is experiencing a pullback toward the broken support at 1.2575. This pullback was expected because the price exceeded the envelope indicator's lines, interpreted as an oversold market.

From a technical perspective, the market is bearish as long as the GBPUSD price hovers below the Ichimoku Cloud and the EMA 50. The pullback can provide opportunities to join the bear market if it stops at the 1.2575 resistance, followed by 1.2613. Therefore, monitoring these levels and looking for bearish candlestick patterns, such as a doji or a bearish engulfing pattern, can signal investors to join the sellers.

If this scenario comes into play, the next target for the bears will likely be the 50% Fibonacci level, the 1.247 mark, followed by the lower band of the bearish flag.

Conversely, if the GBPUSD closes and stabilizes itself above the cloud and the upper band of the flag, the bear market should be considered invalid.

1,707

Re: Market Update by Solidecn.com

Frankfurt's DAX 40 Dips as ECB Holds Rates, US Inflation Data Surprises

https://i.postimg.cc/nz3W1f8d/EURUSD-H4.png

Solid ECN – On Thursday, the DAX 40 index of Frankfurt saw a slight decrease of 0.2%, closing at 18,090 points. This happened right after the European Central Bank decided to keep its primary interest rates the same. The bank also mentioned it might lower rates if it looks like inflation is going to drop based on future projections. However, President Lagarde was clear that the ECB hasn't promised to follow a set path for interest rates, stating that any decisions will be based on upcoming data.

In the US, the situation looked a bit different. Reports showed that the growth in producer prices wasn't as strong as people thought it would be. However, the core index for the year was a bit higher than what was predicted. The day before, on Wednesday, unexpected high US CPI figures made people question if the Federal Reserve could reduce interest rates over the summer. This uncertainty makes it harder for the world's other big central banks to plan for easing.

1,708

Re: Market Update by Solidecn.com

Monitoring Yen's Rally Against Sterling

https://i.postimg.cc/C5GCpcdv/GBPJPY-Daily.png

Solid ECN – The Japanese yen is making a comeback against the pound sterling from 192.9 and is increasing its pace toward the 23.6% Fibonacci level.

The pair trades in the bullish flag depicted in red, as shown on the daily chart. The current downward momentum occurs while the RSI indicator closes on the 50 levels and the Awesome Oscillator signals divergence. This could be interpreted as a trend reversal or the beginning of a new consolidation phase, which appears stronger.

From a technical standpoint, the primary trend is bullish. Still, due to the divergence signal, the consolidation phase might extend to the 23.6% Fibonacci support, followed by the lower band of the bearish flag in blue.

Therefore, we suggest monitoring the aforementioned levels closely for a hammer stick pattern since these levels provide a decent price point for joining the bull market.

1,709

Re: Market Update by Solidecn.com

EUR/USD Exchange Rate Forecast: Navigating Through Global Market Signals

https://i.postimg.cc/CMCJW47k/EURUSD-H4.png

Solid ECN—The EUR/USD exchange rate might see some interesting moves this week, influenced by different factors in Europe and the United States.

The mood in Europe is somewhat positive as the stock markets, particularly the STOXX 50 index, increased by 0.6% on Monday. This increase happened because tensions in the Middle East seemed to calm down after Israel successfully defended itself against a major air attack from Iran. Additionally, the US has reassured everyone that it wants to avoid any more significant conflict in that region. These developments have made investors feel more secure, which is suitable for the markets.

On the business side in Europe, there were some mixed signals. Portugal’s GALP Energia saw its oil and gas production drop by 9% from the previous quarter, which might raise some concerns about energy supplies. However, there were also some big deals, like France's BNP Paribas buying a significant stake in Belgian insurer Ageas and Italy’s Prysmian acquiring Encore Wire for $4.2 billion. These moves could show confidence in European companies and might support the euro.

In the United States, investors are very focused on what the Federal Reserve will do next. Fed officials are planning speeches this week, and everyone wants to know how the central bank will deal with the tight job market and high inflation. If the Fed signals that it might raise interest rates to control inflation, it could strengthen the US dollar.

Overall, the EUR/USD exchange rate will likely react to how these situations develop. If the European economy shows more positive signs and the US Fed suggests strong measures against inflation, we could see some volatility and essential shifts in the exchange rate. It's a week where traders will need to keep a close eye on news from both sides of the Atlantic.

1,710 (edited by SolidECN 2024-04-15 10:07:09)

Re: Market Update by Solidecn.com

EURUSD Trading Tips Amid Market Volatility

https://i.postimg.cc/P5Zq4K1v/EURUSD-H4.png

Solid ECN – The EURUSD currency pair dipped to as low as 1.062 during Friday's trading session and traded at about 1.066, with an increase in today's trading session.

The RSI indicator signals that the market is oversold, while the Standard Deviation indicator hovers at a peak of around 0.0079 and is declining. This can be interpreted as the market being oversold and market volatility slowing down.

From a technical perspective, joining the bears in an oversold market condition is not recommended. Therefore, waiting patiently for the EURUSD to correct some of its losses is logical and wise. However, we don't see signals from the Awesome Oscillator indicating the start of a consolidation phase. Regardless of the AO, if the price reaches the 23.6% Fibonacci level, this resistance area can provide a decent entry point for retail traders to join the bear market.

Please be aware that the Ichimoku cloud stands between bear and bull markets. The market remains bearish as long as the price hovers below the cloud.

1,711

Re: Market Update by Solidecn.com

Understanding Bitcoin’s Recent Price Recovery

https://i.postimg.cc/fy0C0dps/BTCUSDH4.png

Solid ECN—Bitcoin's price has rebounded from the $60,600 resistance, coinciding with the lows of April 5 and 20. This recovery was anticipated as the RSI indicator was previously in oversold territory. As of this writing, the indicator is showing bullish signs, having flipped above the 50 level.

Consequently, the BTCUSD pair remains bullish, although it is currently trading below the Ichimoku cloud. The next bullish target is likely the upper band of the flag around $72,000.

However, the bulls face the EMA 50 as a barrier, suggesting that there might be a consolidation phase or a minor pullback to the 38.2% Fibonacci support level before the uptrend resumes. This is particularly likely, considering the standard deviation indicator is losing momentum.

The $60,600 mark is critical to keeping the market bullish. Should the Bitcoin price dip below this level, the bullish scenario would need to be reevaluated.

1,712

Re: Market Update by Solidecn.com

Analyzing USDCAD's Recent Overbought Status

https://i.postimg.cc/zfPCPnBZ/USDCAD-H4.png

Solid ECN – As of this writing, the USDCAD currency pair is trading at about 1.3737, slightly below the 78.6% Fibonacci level. The rise that began on April 4 from 1.3477 has led to the pair becoming overbought. Notably, the RSI indicator highlighted yesterday's saturated market when it hovered above 70.

Subsequently, the USDCAD formed a doji candlestick pattern with a long wick on the 4-hour chart, and interestingly, the Awesome Oscillator is showing signs of a bearish wave.

Therefore, from a technical perspective, the USDCAD price might dip. However, for this to occur, the bears must close and stabilize the price below the 1.3725 minor support. If this scenario unfolds, the correction phase could extend to the 1.3682 broken resistance, which offers a decent entry point to join the bull market.

It is worth noting that the market remains bullish as long as the USDCAD price trades above the EMA 50.

1,713

Re: Market Update by Solidecn.com

GBPJPY Eyes Resistance at 192.9: Bullish Outlook

https://i.postimg.cc/wMvYZwsQ/GBPJPY-H4.png

Solid ECN – The GBPJPY price bounced significantly from the 23.6% Fibonacci support and is testing the April high, which is in conjunction with the upper band of the flag, at the 192.9 mark.

As of this writing, the GBPJPY price trades at about 192.2 and is trying to stabilize itself above the Ichimoku cloud. Interestingly, the technical indicators are bullish, with the RSI hovering above 50 and the Awesome Oscillator bars turning green and closing in on the signal line from below.

From a technical standpoint, the GBPJPY is in a bull market if it remains within the bullish flag, marked in red. The price of this trading instrument will likely resume its rise. However, it is noteworthy that for the bullish scenario to play out, the buyers must close above the flag, specifically at the 192.9 resistance.

On the other hand, the 23.6% Fibonacci support stands between the bullish and bearish markets. The bull market is invalidated only if the GBPJPY price dips below this level.

1,714

Re: Market Update by Solidecn.com

Bullish Gold: Navigating the Upswing with Fibonacci and Technical Indicators

https://i.postimg.cc/4dwq55b9/XAUUSD-H4.png

Solid ECN – The gold price returned upward after it touched the 38.2% Fibonacci level, which coincides with the EMA 50 and the Ichimoku cloud at the $2,324 mark. Interestingly, the XAU/USD 4-hour chart formed a bullish long-wick candlestick pattern, which signals the continuation of the bull market.

As of this writing, the yellow metal is trading at about $2,370, slightly above the 23.6% Fibonacci support. The technical indicators are also bullish. The RSI indicator hovers above the 50 level and the Awesome Oscillator bars are green and above the signal line.

From a technical perspective, as long as the price remains above the EMA 50 and inside the flag, the market trend remains bullish. The next target will likely be April’s high at the $2,432 mark.

Conversely, the bull market is invalidated if the XAU/USD price dips below the 38.2% Fibonacci support.

1,715

Re: Market Update by Solidecn.com

ETHUSD: Bearish Trends Below Ichimoku Cloud

https://i.postimg.cc/dQhm4bS8/ETHUSDDaily.png

Solid ECN – The ETHUSD price stabilizes below the Ichimoku cloud after pulling back from the 38.2% Fibonacci support level at $2,801. The technical indicators are bearish, with the Relative Strength Index hovering below 50 and the Awesome Oscillator below the signal line, its bars in red.

The ETHUSD chart above shows that the pair trades within a bearish flag. Therefore, from a technical standpoint, the trend remains bearish, and the decline will likely extend to the lower band of the flag, followed by the $2,717 support level.

Conversely, the bull market would be invalidated if the price crosses and stabilizes above the flag.

1,716

Re: Market Update by Solidecn.com

Canadian Bonds and Inflation Trends Amid US Fed Expectations

https://i.postimg.cc/s2DsHmsT/USDCAD-H4.png

Solid ECN – The Canadian 10-year government bond yield has stabilized at 3.78%, a peak not seen since November. This rate holds steady as investors carefully balance their expectations between the US Federal Reserve maintaining a strong stance and anticipating a potential rate cut from the Bank of Canada (BoC).

Amid this backdrop, new economic data revealed that Canada's annual inflation rate in March was recorded at 2.9%, which was below the expected figures. This decline in inflation is noteworthy as it indicates a possible easing in price pressures within the economy. Core inflation measures, closely monitored by the Canadian central bank, also dipped more than anticipated. This decline further bolsters the belief that underlying inflation in Canada might be settling down.

These inflation trends come as Canada has observed an uptick in its national unemployment rate and contractionary Purchasing Managers' Index (PMI) readings earlier in the month. These indicators typically suggest a slowdown in economic activity.

The combination of these factors has led to significant market speculation. Nearly two-thirds of investors now foresee a rate cut by the BoC in the upcoming June meeting. This expectation has provided substantial support to Canadian government bonds, helping them withstand the pressures that have led to a more pronounced selloff in US Treasury bonds.

As the market anticipates the BoC's next moves, these developments are critical for investors and policymakers alike, offering a glimpse into the potential directions of Canada's financial and economic landscape.

1,717

Re: Market Update by Solidecn.com

USDCHF Analysis: Bollinger Bands & Bull Markets

https://i.postimg.cc/Jhkg7Brb/USDCHF-H4.png

Solid ECN – The USDCHF trades sideways in a narrow range between 0.915 and 0.908. The 4-hour chart above shows that the Bollinger bands are also squeezed. The squeezed Bollinger bands can be interpreted as the market resting and waiting for economic updates from the central banks. It is worth noting that the Awesome Oscillator divergence signaled this correction or consolidation phase.

From a technical perspective, the USDCHF is in a bull market, trading inside a rising flag. The uptrend will likely continue if the price steps above the 0.915 resistance.

Conversely, the Ichimoku cloud, or the lower band of the flag, stands between the bull and bear markets. Should the price dip and stabilize itself below 0.906, the bull market would be invalidated, and the decline would aim for the 0.8991 mark.

1,718

Re: Market Update by Solidecn.com

Bitcoin Price Fails at Key Resistance Levels

https://i.postimg.cc/Z51PppMn/BTCUSDH4.png

Solid ECN – Bitcoin price failed to surpass the EMA 50 and the 50% Fibonacci resistance level in the previous trading session. Consequently, the digital gold dipped below the 23.6% Fibonacci support level and traded at about $62,800 when writing.

The technical indicators give mixed signals. The RSI hovers below 50, and the awesome oscillator bars are green and approaching the signal line. This can be interpreted as uncertainty in the market.

As shown in the BTCUSD 4-hour chart above, the pair trades with a wide bearish flag in red, which widens the trading range and increases the risk. This is the downside of trading cryptocurrencies.

Therefore, we suggest waiting for the Bitcoin price to reach critical support levels before entering the market. Since the trend is bearish in the short term, the market dip might extend to the lower band of the flag or to April's low, the $60,500 area.

1,719

Re: Market Update by Solidecn.com

Bearish Outlook: AUDUSD Tests Critical Supports

https://i.postimg.cc/C1pnvBkJ/AUDUSD-Daily.png

Solid ECN – The Australian dollar started today's trading session with an uptick in momentum against the U.S. Dollar and is trading at about 0.641. The AUDUSD 4-hour chart above shows that the pair is rising to test the previously broken supports at the 0.6443 and 0.6473 marks.

Considering the primary trend, which is bearish, the above-mentioned price points offer a decent opportunity to join the bear market. Therefore, we suggest monitoring these levels closely and looking for bearish candlestick patterns on a smaller time frame, such as the 4-hour chart.

1,720

Re: Market Update by Solidecn.com

USDCHF Dips but Bullish Trend Holds

https://i.postimg.cc/gJDV1JnP/USDCHF-H4.png

Solid ECN – The USDCHF currency pair experienced a slight decline, reaching approximately 0.910. This movement brings it close to the lower boundary of the bullish flag—a pattern suggesting a potential rise in value. This specific price point is bolstered by additional support at 0.908 and further underpinned by the Ichimoku cloud.

Despite the dip, no significant candlestick patterns used to forecast price direction changes were observed on the USDCHF 4-hour chart. This absence typically indicates that the current upward trend may continue, provided the price remains above the Ichimoku cloud. Should this scenario hold, the U.S. Dollar will likely climb toward the 0.915 mark, aiming next for the upper boundary of the bullish flag.

However, there is a flip side to consider. If the price falls below 0.9062, it would signal an end to the bullish trend, transitioning into a bear market. Such a drop could increase selling pressure, potentially pushing the price to around 0.899.

1,721

Re: Market Update by Solidecn.com

Critical Resistance Tests for USD/MXN's Bullish Trend

https://i.postimg.cc/y8pTMrxx/USDMXN-Daily.png

Solid ECN – The U.S. Dollar broke out from the bearish channel against the Mexican Peso in yesterday's trading session. The USD/MXN pair currently trades at about 16.97 inside the Ichimoku cloud, which represents the resistance area.

The technical indicators are bullish; the relative strength index hovers above 50, and the awesome oscillator bars are green. Therefore, we can interpret that the bearish market is paused, and there might be a shift in trend from bearish to bullish.

However, for the uptick in momentum to continue, the bulls face the 38.2% Fibonacci barrier. Failure to overcome this resistance area will likely lead to the continuation of the downtrend.

If the pair stabilizes itself above the Ichimoku cloud and the Fibonacci level mentioned earlier, the bullish wave is likely to extend further, aiming for the 50% Fibonacci level.

1,722

Re: Market Update by Solidecn.com

Tracking the Dip: U.S. Oil's Technical Outlook

Solid ECN – Oil is trading within a bullish flag pattern, indicating potential for future gains. However, it's crucial to note that it remains above the 50-day Exponential Moving Average (EMA 50), a key indicator that suggests bullish momentum is intact. Nevertheless, the plot has a twist as the technical indicators hint at a bearish trend.

The Relative Strength Index (RSI) has dipped below 50, and the Awesome Oscillator shows red bars declining toward the signal line. This combination of signals might indicate a potential shift towards bearish territory, especially if prices continue to fall towards the 50% Fibonacci level, which coincides with the EMA 50.

https://i.postimg.cc/nLrxQrSR/USOUSDDaily.png

Short-Term Forecast and Trading Suggestions

The market appears to be entering a consolidation phase, with a possible decline to the lower boundary of the bullish flag at $76.0. For the bearish trend to gain momentum, prices must breach significant support levels, including the EMA 50 and the psychological $80.0 mark. Traders should closely monitor these levels as they could dictate the market's short-term direction.

Today, we expect the downward trend to extend to the $80.0 support level. Further declines could push the price to approximately $77.0 per barrel if this level fails. Keeping up-to-date on these developments is crucial for traders and market analysts alike.

1,723

Re: Market Update by Solidecn.com

GBPUSD Sideways Movement: Bearish Signals Despite Consolidation

https://i.postimg.cc/PqKzTXXr/GBPUSD-H4.png

Solid ECN—The GBPUSD currency pair trades sideways between 1.249 and 1.240. The Bollinger Bands are squeezed and demonstrate the range area on the 4-hour chart. Other technical indicators, except Standard Deviation, signal and promise a bullish trend while the uptick momentum is weak, and we don't see strength from the buyers.

From a technical standpoint, the primary trend is bearish while the pair hovers below EMA 50 and the Ichimoku cloud. However, the current consolidation phase might test the EMA 50 again in today's trading session, potentially forming a double-top pattern on the 4-hour chart.

Consequently, a failure to stabilize the price above 1.2499 will likely lead to a decline, and initially, the pair would test this week's low at 1.240 support.

1,724

Re: Market Update by Solidecn.com

Australian Dollar's Struggle Below EMA 50 Explained

https://i.postimg.cc/7PcNwFQ1/AUDUSD-H4.png

Solid ECN – The Australian dollar trades at about 0.644 against the U.S. dollar as of writing, slightly below the broken support level of 0.6455. Interestingly, the AUDUSD 4-hour chart shows a doji candlestick pattern, highlighted in the image above.

The Relative Strength Index still hovers below 50, but the Awesome Oscillator bars are green, giving mixed signals. Despite the contradiction between the technical indicators, the primary trend is bearish, and the pair trades below EMA 50. Based on price action analysis, our first bearish signal is the doji candlestick pattern.

Therefore, from a technical standpoint, selling pressure will likely increase if the AUDUSD remains below EMA 50. Should the market shift downwards, its initial target would be this week's low of 0.6389.

Conversely, EMA 50 is the dividing line between bull and bear markets. The bear market could be considered over if the price crosses and stabilizes above EMA 50. In this scenario, the uptick momentum that began this week at 0.6389 could extend to 0.652.

1,725

Re: Market Update by Solidecn.com

Analyzing the Canadian Dollar's Recent Performance

https://i.postimg.cc/KznHPxhJ/USDCAD-H4.png

Solid ECN – The Canadian dollar gained ground against the U.S. dollar in today's trading session, while its value had been declining for almost three weeks. Currently, the USDCAD trades at about 1.37, clinging to the lower band of the bullish flag and testing the 78.6% Fibonacci support.

The technical indicators are bearish. The Relative Strength Index hovers below 50, while the Awesome Oscillator shifts below the signal line, signaling a continuation of the downtrend. However, the bear market faces a barrier at 1.374, followed by the EMA 50. If the price maintains its position above these levels, the uptrend will likely resume, initially targeting April's high at 1.3844.

Posts: 1,701 to 1,725 of 1,747

Pages Previous 1 67 68 69 70 Next

You must login or register to post a reply

Forex Software → Market Analysis → Market Update by Solidecn.com

Similar topics in this forum