forex software

Create and Test Forex Strategies

forex software

Skip to forum content

Forex Software

Create and Test Forex Strategies

You are not logged in. Please login or register.


(Page 68 of 70)

Forex Software → Market Analysis → Market Update by Solidecn.com

Pages Previous 1 66 67 68 69 70 Next

You must login or register to post a reply

RSS topic feed

Posts: 1,676 to 1,700 of 1,747

1,676

Re: Market Update by Solidecn.com

EURUSD Hits New Low: Analyzing the Latest Bearish Wave

https://i.postimg.cc/ncFgM20z/EURUSD-H4.png

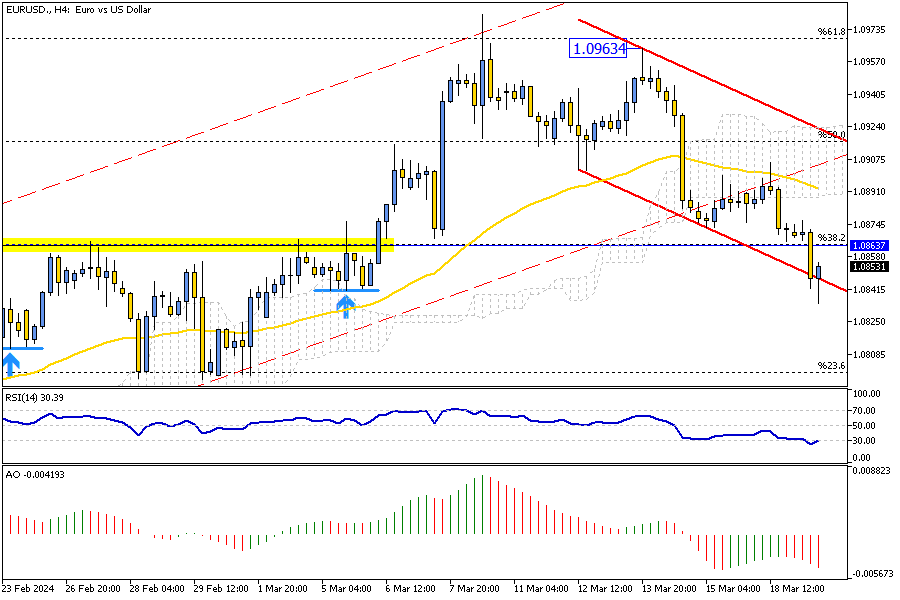
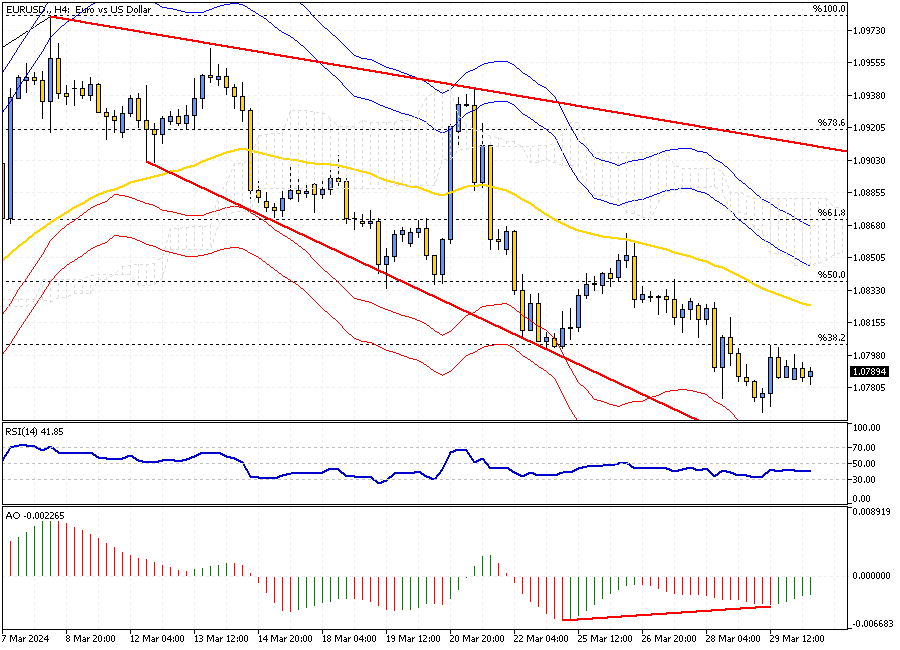
Solid ECN – In today's trading session, the European currency dipped toward the 1.08 mark, its lowest since March 1st, against the U.S. Dollar. The drop was expected from a technical perspective because the bears formed an inverted hammer clinging to the EMA 50 yesterday. The failed attempt to cross above the moving average has led the EURUSD price to experience a new bearish wave.

As of this writing, the pair is testing the lower band of the bearish flag. The RSI indicator hovers in the oversold area; therefore, the market might make corrections below the EMA 50 before a new wave emerges.

From a technical standpoint, the primary market is dominated by bears if the price is kept below the cloud. Due to the RSI being in the oversold zone, we suggest waiting for the price to show some correction before joining the bear market. With the price below the mentioned resistance areas, the 23.6% Fibonacci support could be the next target.

The price must flip and stabilize itself above the cloud for the bear market to be deemed invalid.

1,677

Re: Market Update by Solidecn.com

Recent Trends in NZDUSD

https://i.postimg.cc/66rx09Zp/NZDUSD-Daily.png

Solid ECN – The New Zealand dollar fell below $0.605, reaching close to its four-month low following the Australian dollar's downturn. This happened after the Reserve Bank of Australia decided not to change interest rates, a decision many anticipated. They also removed their previous caution against ruling out future rate hikes. Meanwhile, the Kiwi dollar faced additional pressure due to the upcoming policy meeting of the US Federal Reserve. There's the worry that persistently high inflation in the US might postpone any cuts in Fed rates.

Furthermore, within New Zealand, the expectation is growing that the Reserve Bank of New Zealand may reduce its policy rates starting in August as the rise in prices begins to slow down. As investors wait, they are particularly interested in the upcoming report on the country's economic growth, hoping it will offer more clarity.

1,678

Re: Market Update by Solidecn.com

Euro Rises as Central Banks Discuss Future Rate Cuts

https://i.postimg.cc/t4QF0Lhb/EURUSD-H4.png

Solid ECN – On Wednesday, the euro climbed to $1.09, bouncing back from its lowest point in two weeks after the Federal Reserve decided not to change its plans for interest rate reductions in 2024. The Fed did not alter interest rates in March, meeting expectations, and hinted at three possible decreases later in the year. Also, the ECB's President Lagarde emphasized in an earlier meeting that they would look at reducing rates in June. 

She added a note of caution, stating that the European Central Bank wouldn't lock itself into a set number of cuts, as future decisions will be based on the latest data. Central bank leaders from five countries—Spain, the Netherlands, Ireland, Greece, and Slovakia—have expressed their support for action in June.

1,679

Re: Market Update by Solidecn.com

Bitcoin's March 2024 Rebound: Analyzing the Latest Price Movements

https://i.postimg.cc/kMRtRNS1/BTCUSDH4.png

Solid ECN – Bitcoin bounced from its March 2024 low, the $60,700 mark, in yesterday's trading session, Tuesday.

As of this writing, the BTCUSD pair trades at about $67,700, slightly below the Ichimoku Cloud. The 4-hour chart shows that digital gold is trying to stabilize the price above the EMA 50, while the Awesome Oscillator and the RSI have flipped above their signal lines. Therefore, the technical indicators are bullish, but the Bitcoin bulls face the $68,900 barrier to overcome if they wish the price to surge higher.

From a technical standpoint, the downtrend will likely extend if the price stabilizes itself below the EMA 50. This attempt hasn't been achieved so far in today's trading session. Therefore, watch the EMA 50 on the BTCUSD 4-hour chart.

Conversely, the uptrend would continue if bullish traders break the aforementioned barrier. In this scenario, the March higher high, $73,700, would be the initial target for the bull market.

1,680

Re: Market Update by Solidecn.com

NZDUSD Struggles at the Key 0.609 Mark

https://i.postimg.cc/tJVw2KpM/NZDUSD-H4.png

Solid ECN – In today’s trading session, the NZDUSD currency pair has risen from the 0.602 resistance area and is currently testing the 50-day EMA at the 0.609 mark.

The Awesome Oscillator has predicted the uptick in the momentum of the New Zealand dollar, as evidenced by the divergence shown in the 4-hour chart. At the time of writing, the U.S. dollar drives the price towards the 0.606 resistance, which aligns with the lower high of March 4 and the 23.6% Fibonacci resistance.

From a technical perspective, the primary trend remains bearish as long as the pair continues to trade below the descending red trendline. In this scenario, the bear market is likely to persist, and a break below the 23.6% Fibonacci support could accelerate the downtrend.

However, if the NZDUSD stabilizes above the 50% Fibonacci resistance, it would invalidate the bear market.

1,681

Re: Market Update by Solidecn.com

GBPJPY: Potential Entry Points Amid AO Divergence

https://i.postimg.cc/hj760f2H/GBPJPY-Daily.png

Solid ECN – In the current trading session, the GBP has reached a new high of 193.5 against the Japanese Yen. This peak aligns with the upper band of the bullish flag. Notably, the RSI indicator is nearing the overbought zone and is declining below 70 as of writing. Alongside the RSI, the Awesome Oscillator signals a divergence, suggesting a new consolidation phase may be imminent.

Consequently, the GBPJPY price could drop to 191.3, followed by the 23.6% Fibonacci support level, before initiating a new bullish wave.

These two levels offer a suitable entry point for participating in the bull market. Please be aware that the bull market will only be invalidated if the price stabilizes below the 50-day EMA.

1,682

Re: Market Update by Solidecn.com

British Pound Falls Amid Economic Challenges in the UK

https://i.postimg.cc/bwJYSnzx/GBPUSD-Daily.png

Solid ECN – The British pound dropped to about $1.26, marking its lowest point since February 19th. This happened because people in the UK stopped spending more in February, and the head of the Bank of England, Andrew Bailey, suggested there might be cuts in interest rates later this year. The Office for National Statistics reported that shopping numbers in the UK didn't change last month.

This was a significant change from January's 3.6% increase and was different from what people thought would happen; they expected a 0.3% drop. At the same time, Bailey did say there were signs that prices were going up less quickly, but he also said it's essential to be sure before making decisions about how to handle the situation.

The Bank of England decided to keep the cost of borrowing money very high, at 5.25%, the highest it's been in 16 years. They made this decision with almost everyone agreeing, even though two people changed their minds about wanting to increase it. This choice was made after seeing that prices weren't rising as fast as before, which hasn't happened in over two years, but prices are still higher than the bank wants.

1,683

Re: Market Update by Solidecn.com

EURUSD: Navigating the Bear Market and Identifying Entry Points

https://i.postimg.cc/K8kbTqvm/EURUSD-H4.png

Solid ECN – The European currency experienced a significant decline against the U.S. Dollar after failing to maintain its position above the Ichimoku cloud on March 21. The pair is currently trading around 1.081 and is nearing the 23.6% Fibonacci retracement level, coinciding with the 1.079 support level.

The Relative Strength Index (RSI) still has room to enter the oversold territory, suggesting that the decline may continue, potentially dipping below the 30 level as the market approaches the Fibonacci level.

From a technical standpoint, we are currently in a bear market. However, the 23.6% Fibonacci support level may provide a good entry point for bullish traders looking to capitalize on a potential pullback. The rebound is anticipated to start around the 1.079 level and extend to 1.083.

We recommend closely monitoring the EURUSD price action, examining candlestick patterns near the Fibonacci level mentioned above, and adjusting trading strategies accordingly.

1,684

Re: Market Update by Solidecn.com

USDJPY: November 2023 Highs Revisited, Consolidation Ahead?

https://i.postimg.cc/x8GDsbwd/USDJPY-H4.png

Solid ECN – The U.S. Dollar has reached the November 2023 high against the Japanese Yen, hitting the 151.9 mark for the second time this week. However, this time, a long wick candlestick pattern has emerged on the USDJPY 4-hour chart.

Additionally, the Awesome Oscillator shows a divergence in its bars, which could signal an imminent consolidation phase. This could drive the price down to the 150.2 mark, followed by the 38.2% Fibonacci support level, which the 50 EMA supports. These levels provide favorable entry points for retail traders looking to join the primary upward trend.

Conversely, the 151.8 hard resistance level must be breached for the uptrend to continue.

1,685

Re: Market Update by Solidecn.com

Gold Prices Near Record Highs Amid Rate Cut Expectations

https://i.postimg.cc/C5m5mbTm/XAUUSD-Daily.png

Solid ECN – On Monday, the price of gold remained steady around $2,175, nearing its record high of $2,185 set on March 20th. This stability comes amid increasing bets on the Federal Reserve reducing interest rates.

Recently, the Fed kept its forecast, expecting to lower rates three times in 2024, making gold more attractive. Moreover, investors now believe there's over a 70% likelihood that the Fed will cut rates in June, a jump from the 55% probability anticipated before their latest meeting.

This week, all eyes are on important U.S. inflation data and speeches from several Federal Reserve officials for further indications of future monetary policies. Additionally, ongoing conflicts in Russia and the Middle East support gold's status as a reliable safe-haven asset.

1,686

Re: Market Update by Solidecn.com

Gold Prices Surge Amid Global Tensions

https://i.postimg.cc/bJdxWgwd/XAUUSD-Daily.png

Solid ECN – On Tuesday, the price of gold climbed to a new peak, approximately $2,190 per ounce. This increase was mainly due to the weakening of the US dollar. Investors are anticipating rate cuts, especially with the upcoming US PCE price index report expected this Friday. Following last week's announcement by the Federal Reserve, which kept its prediction of three interest rate cuts for the year, gold became more attractive.

However, February saw better-than-expected US durable goods orders, and various Federal Reserve officials have voiced concerns regarding persistent inflation and a strong economy. Currently, there's a roughly 70% expectation among markets that the Federal Reserve will begin to lower rates in June, a notable increase from the 55% likelihood anticipated before their last meeting.

Additionally, gold's status as a secure asset is bolstered by rising geopolitical tensions in the Middle East and Eastern Europe, underscored by the UN Security Council's call for an immediate ceasefire in Gaza.

1,687

Re: Market Update by Solidecn.com

Silver Prices Hold Steady as Investors Eye Fed Moves

https://i.postimg.cc/Zqnnb1nS/XAGUSD-H4.png

Solid ECN—Silver prices have stabilized above $24.5 per ounce after hitting almost a one-year high on March 20th. This happens while investors wait for speeches from the Federal Reserve's officials and the key PCE inflation data this week. These events will help them predict if the U.S. will start easing its monetary policy soon. Before this, the U.S.'s main financial authority decided not to change its plan for three interest rate decreases in 2024.

This decision made silver and similar assets without yield more attractive. Since their last meeting, the likelihood of reducing interest rates in June has increased to about 70% from the previous 55%. Meanwhile, the Swiss National Bank was among the first big banks to begin reducing its European policies. Silver continues to be supported as a safeguard against global political tensions, mainly due to ongoing conflicts in Ukraine and the Middle East. Recently, Russia has significantly attacked Ukraine's energy infrastructure.

1,688

Re: Market Update by Solidecn.com

GBPUSD Drops, Awaiting Bank Decisions

https://i.postimg.cc/L4YX7Y4d/GBPUSD-H4.png

Solid ECN – In late March, the British pound fell to just above $1.26, its weakest since February 19, and was on track to lose almost 1% over the quarter compared to the US dollar. This happened as investors paid careful attention to cautious words from bank officials. Fed Governor Waller mentioned that the latest inflation figures back the idea that the US Federal Reserve might not soon lower its short-term interest rate goal, though he didn't rule out cuts later in the year.

In Britain, Bank of England's Haskel stated that it's too soon to consider rate cuts, and his colleague Mann warned against expecting too many rate reductions this year. She suggested it's unlikely the UK would reduce rates before the US.

During its March session, the Bank of England kept its interest rates the same. Two members, who had earlier supported increasing rates, now preferred to wait, leading to a softer approach than many had predicted.

1,689

Re: Market Update by Solidecn.com

How to Trade the NZD/USD Pullback: Insights from the Awesome Oscillator

https://i.postimg.cc/gcMmsQhY/NZDUSD-Daily.png

The NZD/USD currency pair is in a bear market, trading below the 61.8% Fibonacci resistance level. The ADX indicator signifies that the trend is strong on the daily chart as it nears the 40 level. However, the Awesome Oscillator indicates divergence, suggesting that the New Zealand dollar will likely experience a pullback to the 0.602 resistance area.

Technically speaking, the next bearish target could be the 78.2% Fibonacci level, but the decline may continue after a consolidation phase. Therefore, the 0.602 level can provide a decent entry point for joining the sellers in the NZD/USD market.

1,690

Re: Market Update by Solidecn.com

Navigating the Bear Market: Entry Points for EUR/USD Traders

https://i.postimg.cc/wjd42KdD/EURUSD-H4.png

Solid ECN – The U.S. Dollar is stabilizing below the 38.2% Fibonacci level against the European currency today, Monday, April 1st, 2024.

The divergence signaled by the Awesome Oscillator could indicate a potential consolidation phase on the horizon.

From a technical perspective, the primary trend for EUR/USD is bearish. The pair will likely regain some of its losses from last week by rising to the 50% Fibonacci level, which coincides with the EMA 50. This resistance level could provide a suitable entry point for retail traders looking to join the bear market.

Conversely, the bear market should be invalidated if the pair stabilizes above the Ichimoku Cloud.

1,691

Re: Market Update by Solidecn.com

Oil Prices Peak Ahead of OPEC+ Meeting

https://i.postimg.cc/3wjcV7HX/USOUSDDaily.png

Solid ECN – On Monday, WTI crude oil prices climbed to about $83.5 a barrel, reaching their highest point in five months. This surge comes as investors eagerly await the upcoming joint ministerial OPEC+ meeting this week. At this meeting, the group plans to examine the current state of the market and how well members are sticking to their production goals.

They are expected to decide to keep their current production levels the same. The Russian Deputy Prime Minister Alexander Novak mentioned last Friday that Russian oil companies should focus more on reducing their oil production than their exports during the second quarter. This is part of Russia's efforts to align with OPEC+'s production targets.

In addition, the market is also paying close attention to how Ukrainian drone attacks on Russian oil facilities and the peace negotiations in Gaza might affect the oil supply.

On the demand side, there's some positive news: recent data revealed that China's manufacturing sector grew in March for the first time in six months, a development that could mean stronger demand for oil from the world's largest importer of crude oil.

1,692

Re: Market Update by Solidecn.com

GBPUSD: New Trends and Bearish Targets Unveiled

https://i.postimg.cc/4yYksKyM/GBPUSD-H4.png

Solid ECN — The GBPUSD traded within a narrow range last week. The ADX indicator, hovering above the 25 level, suggests a new trend is likely on the horizon. Since the U.S. Dollar broke through the 50% Fibonacci resistance level, it appears that the downtrend that began in early March is set to continue.

The next bearish target is expected to be the flag's lower band, followed by the 38.2% Fibonacci support level.

Please note that the bear market will be invalidated if the price rises above the Ichimoku Cloud.

1,693

Re: Market Update by Solidecn.com

Bitcoin Tests the Bullish Trendline for Next Moves

https://i.postimg.cc/s2dTKbM1/BTCUSDH4.png

Bitcoin's price dipped to as low as $65,796 in today's trading session against the U.S. dollar. As of this writing, the pair is testing the ascending trendline highlighted in red. The technical indicators are not providing valuable information now, so we focus on price action analysis.

From a technical perspective, the trend remains bullish as long as the price stays above the red trendline. However, if bears push and maintain the BTC/USD price below this trendline, the dip could extend further, with the next bearish target potentially being the $68,000 resistance level.

1,694

Re: Market Update by Solidecn.com

USDCNH Bullish Trend Analysis: Key Levels to Watch

https://i.postimg.cc/50WHCwNF/USDCNH-Daily.png

Solid ECN – The U.S. Dollar has been in an uptrend since mid-December 2023 against the Chinese Yuan. As of this writing, the USDCNH pair trades at about 7.26, slightly above the 61.8% Fibonacci support level and the 7.23 higher low.

The technical indicators are bullish. The RSI hovers above the median line and the Awesome Oscillator bars are green and above the signal line.

From a technical standpoint, the pair is in a bull market, with 7.23 acting as support. Therefore, while the price holds above this level, the next bullish target could be the 78.6% Fibonacci resistance level.

Conversely, if the USDCNH price dips below the 7.23 support, the decline is likely to extend to the lower band of the bullish flag, which is in conjunction with the Ichimoku Cloud. Please note that the trend remains bullish as long as the pair ranges above the cloud.

1,695

Re: Market Update by Solidecn.com

USD/JPY Eyes Key 151.9 Resistance Level

https://i.postimg.cc/XvbGDjgT/USDJPY-H4.png

The U.S. Dollar trades slightly lower than the 151.9 mark against the Japanese yen in today's trading session. The pair has been ranging below this area for two weeks now, and the trend hasn't developed any significant moves lately.

However, bullish traders are keen to see the pair break above the 151.9 ceiling, which could lead to the U.S. price experiencing another jump against the Japanese currency.

Therefore, from a technical standpoint, the primary trend is bullish while the pair hovers above the 23.6% Fibonacci support level. The uptrend will continue if the bulls break above the resistance level, the 151.9 mark.

1,696

Re: Market Update by Solidecn.com

Navigating Bitcoin's Consolidation Phase

https://i.postimg.cc/0y1g3Nbd/BTCUSDH4.png

The Bitcoin price dipped below the $65,796 resistance level, which is beneath the ascending trendline and the Ichimoku Cloud. Concurrently, the RSI indicator entered the overbought area, and as a result, the BTCUSD pair is testing the previously broken trendline at the time of writing.

From a technical standpoint, the bullish market has paused, and we are entering a consolidation phase that is likely to extend to the $68,000 resistance area.

1,697

Re: Market Update by Solidecn.com

Bearish Trend in AUD/USD: Key Indicators and Price Targets

https://i.postimg.cc/50qfgb6x/AUDUSD-H4.png

Solid ECN – The momentum of the Australian dollar against the U.S. Dollar has paused in today's trading session. As of this writing, the AUD/USD pair is testing the EMA 50 at about 0.651, which coincides with the Ichimoku Cloud.

The 4-hour chart has formed a Doji candlestick pattern, which could be interpreted as a sign of a trend reversal or a halt to the current uptick in momentum.

From a technical standpoint, as long as the AUD/USD pair trades below the cloud, the primary trend remains bearish. In this scenario, the next target will likely be March's lowest price, the 0.647 mark. Please note that if the Standard Deviation indicator rises above the 0.002 level, the pace of the downtrend will escalate.

On the flip side, the bear market should be invalidated if the price of the Australian dollar closes and stabilizes above the 0.6538 resistance mark. In this case, the rise will likely extend and aim for the upper band of the flag.

1,698

Re: Market Update by Solidecn.com

AUDUSD Climbs Higher: A Look into the Bullish Trend

https://i.postimg.cc/T3v622Py/AUDUSD-H4.png

Solid ECN – Yesterday, the Australian dollar saw a significant rise against the U.S. dollar. This increase in value started when it surpassed the EMA 50 and reached 0.6524, marked by a large bullish candle. Following this, there were four more strong bullish candles, pushing the price beyond the Envelopes band, suggesting the market was in an overbought state. This was further supported by the RSI indicator moving above 70.

Today, the market is correcting itself slightly after reaching a high of 0.661 on Thursday. Currently, the AUD/USD pair is trading around 0.657, still above the 50% Fibonacci support level, and maintaining its position over the Ichimoku Cloud. Despite technical indicators showing a bearish trend, the overall outlook remains bullish as long as the price stays above the cloud and the EMA 50.

The AUD/USD price might climb further to challenge the 78.6% Fibonacci resistance level at 0.6626, moving towards the top of the bullish channel shown in red on the 4-hour chart for AUD/USD.

However, if the price falls below the EMA 50 or the 38.2% Fibonacci support level at 0.5548, this would signal an end to the bullish trend.

1,699

Re: Market Update by Solidecn.com

Pound Sterling's High Against Dollar & Future Trends

https://i.postimg.cc/XqvzZyy8/GBPUSD-H4.png

Solid ECN – Yesterday, the pound sterling reached its highest level against the U.S. Dollar for April, climbing to 1.268. When looking at the GBPUSD 4-hour chart, we see a candlestick with a long wick, peaking at 1.268. This peak is near the top edge of a falling flag pattern and is backed by the Ichimoku cloud and the 38.2% Fibonacci retracement level.

This area of strong resistance halted the pound's upward movement, leading to a rebound by the U.S. Dollar. Currently, the GBPUSD is trading around the 50-day Exponential Moving Average (EMA), at approximately 1.263.

From a technical perspective, the currency pair is in a downtrend. If the price remains below the 50 EMA, we might see this downward trend continue. In such a case, the next target for the bears might be April's lowest point, at 1.2539.

However, if the GBPUSD price can rise above the 38.2% Fibonacci level or the 1.268 mark, it would signal a potential shift away from the downtrend. This possibility seems less likely, as the technical indicators lean towards a continuation of the bear market.

1,700

Re: Market Update by Solidecn.com

NZDUSD Pair Sees Bullish Break and Pullback

https://i.postimg.cc/T3wvg7FV/NZDUSD-H4.png

Solid ECN – In the latest update for the NZDUSD pair, buyers successfully breached the falling trend line, as observed in the 4-hour chart. Currently, the pair is undergoing a slight pullback, trading around 0.602. It is approaching the EMA 50 and retesting the trend line it crossed.

The signals from technical indicators are not consistent. While the RSI remains above 50, suggesting a bullish trend, the AO bars are red, and the currency pair has yet to position itself over the Ichimoku cloud firmly. This indicates that the recent price increase from 0.5938 is not very strong. Thus, investing in this pair warrants a careful approach.

From a technical analysis standpoint, the NZDUSD price is currently within a bullish trend, staying above both the EMA 50 and the 61.8% Fibonacci support level. If buyers can keep the price above these critical points, we might see continued growth, potentially aiming for the 50% Fibonacci resistance level at 0.6070.

Conversely, a drop below the 0.6 threshold, aligning with the 61.2% Fibonacci level, could signal the end of the current bullish trend.

Posts: 1,676 to 1,700 of 1,747

Pages Previous 1 66 67 68 69 70 Next

You must login or register to post a reply

Forex Software → Market Analysis → Market Update by Solidecn.com

Similar topics in this forum