Re: Forex Technical Analysis & Forecast by RoboForex
Technical Analysis & Forecast 09.08.2023
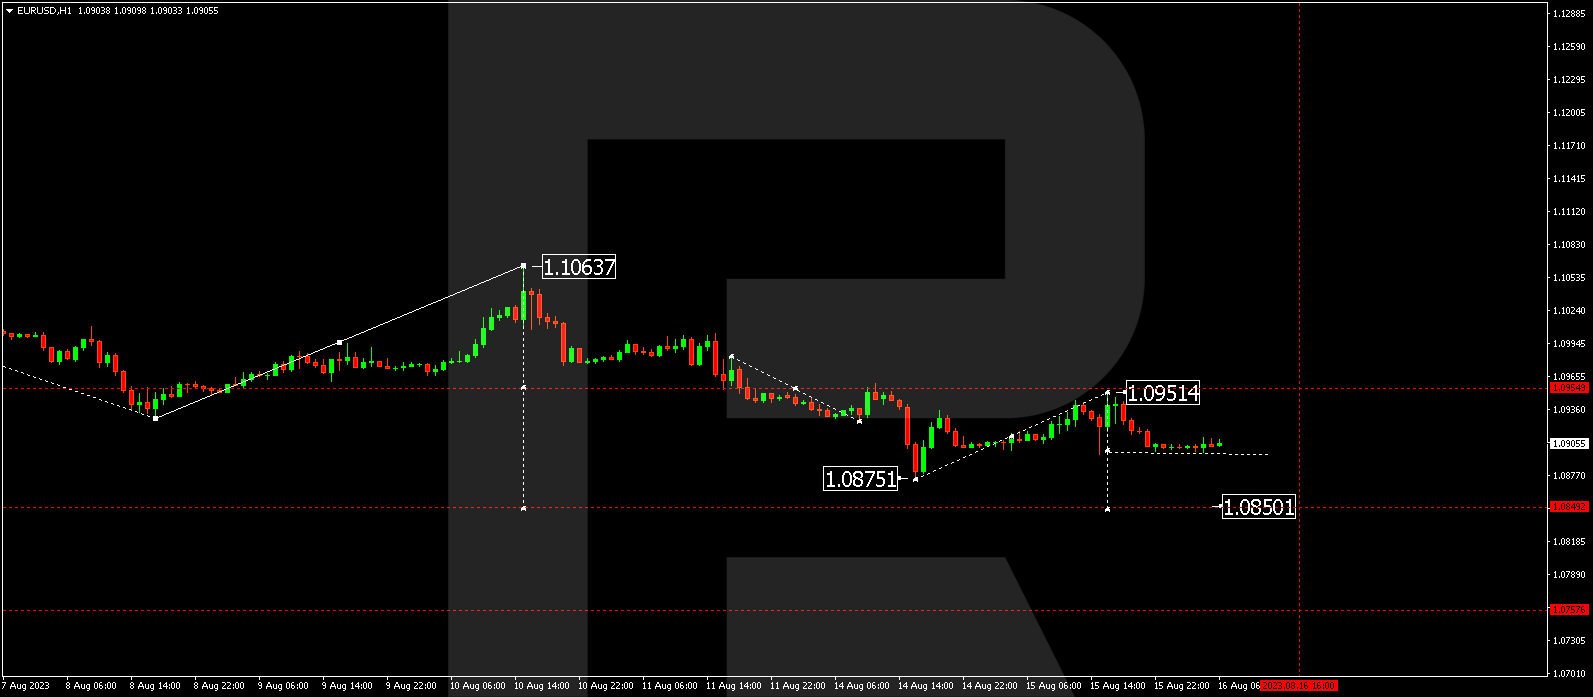
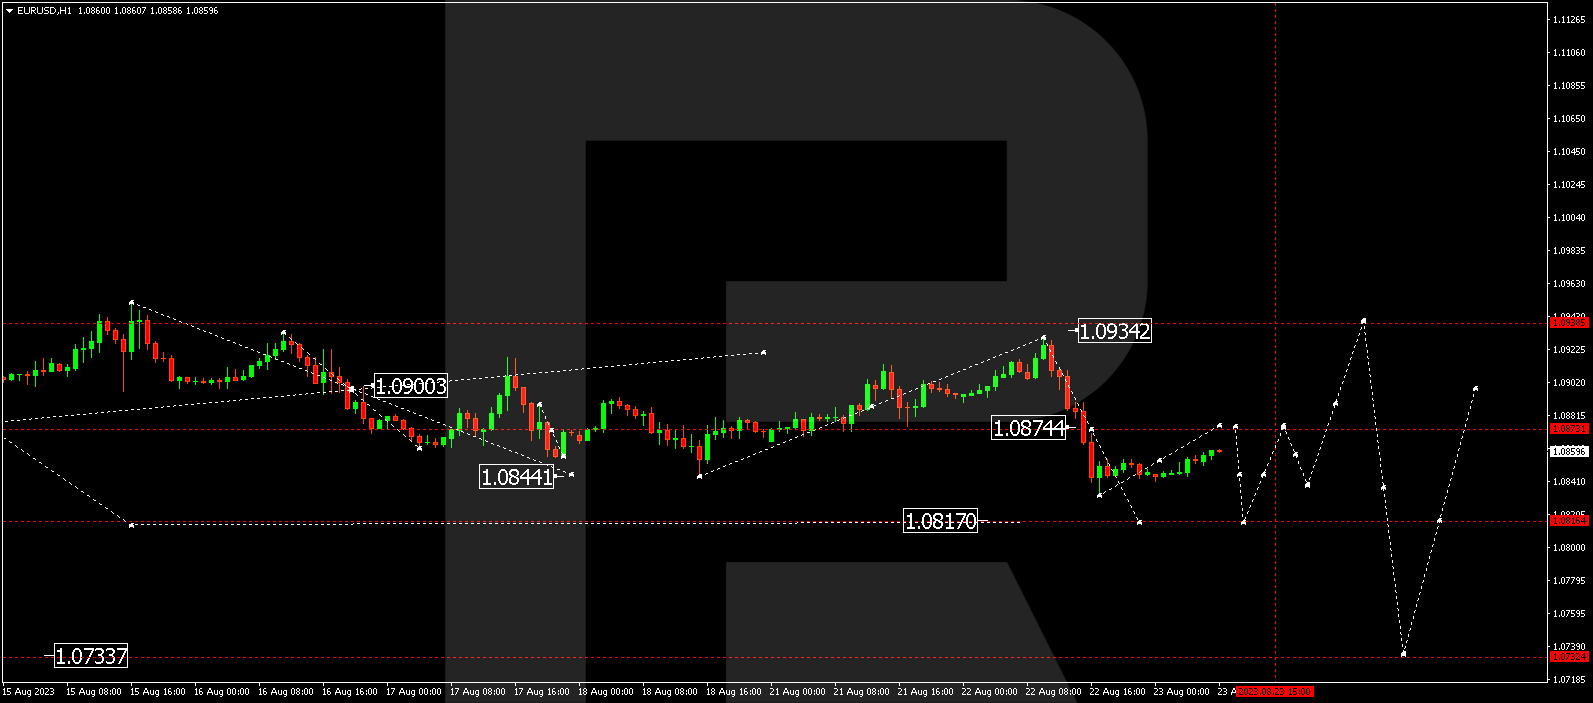
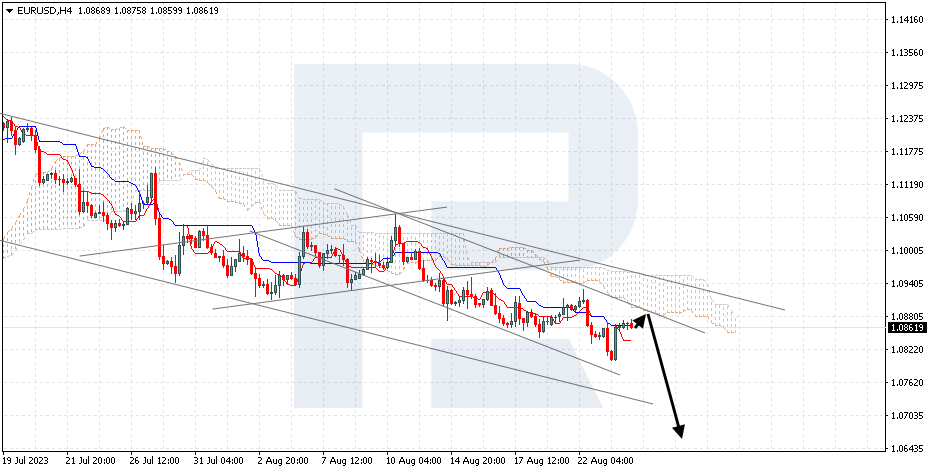
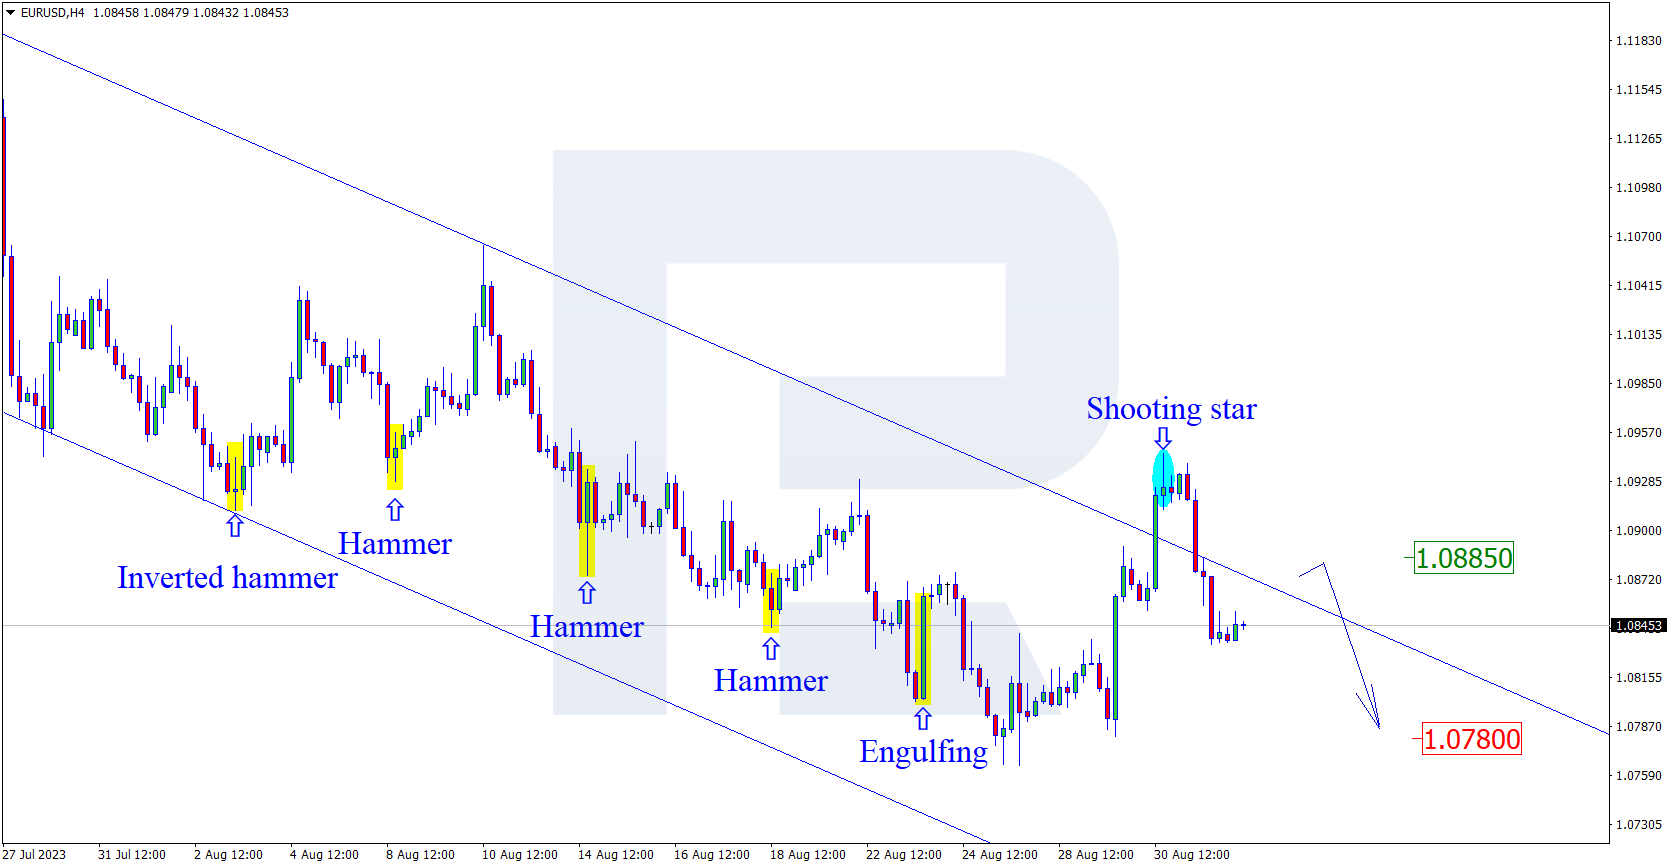
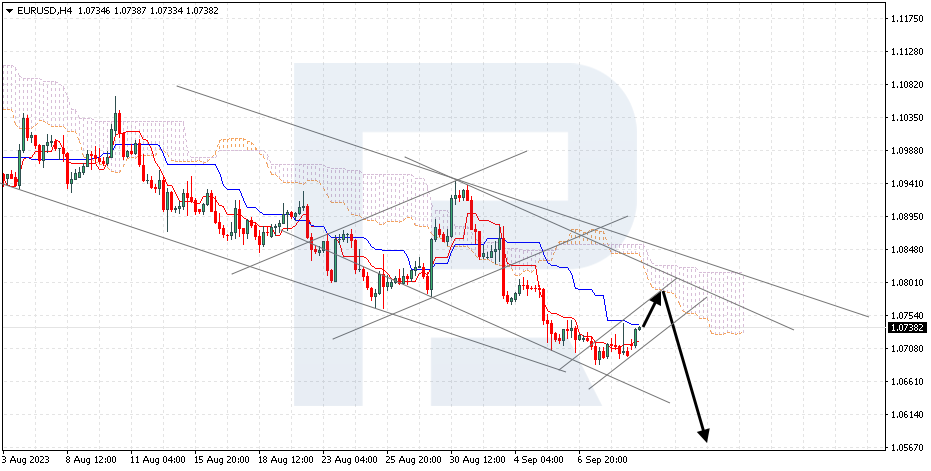
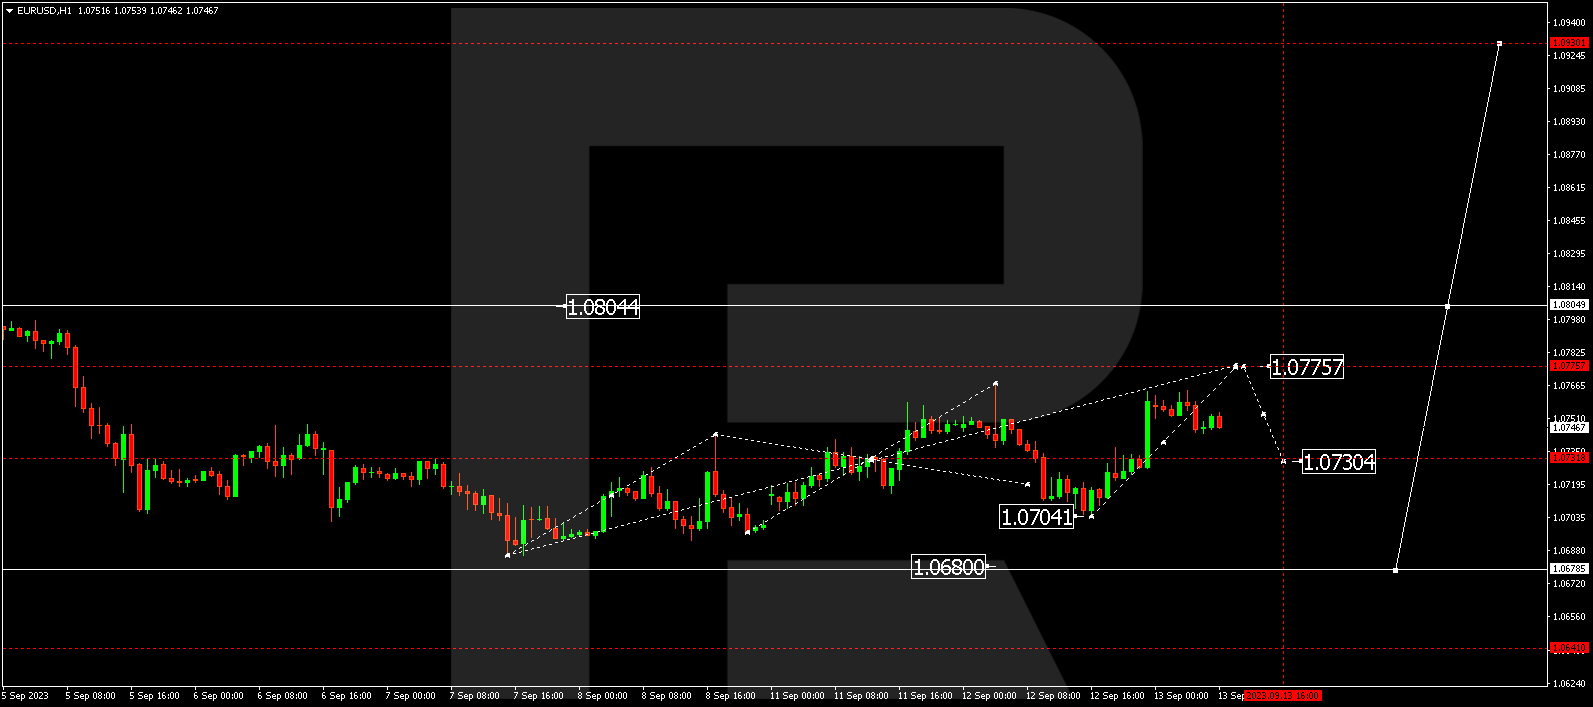
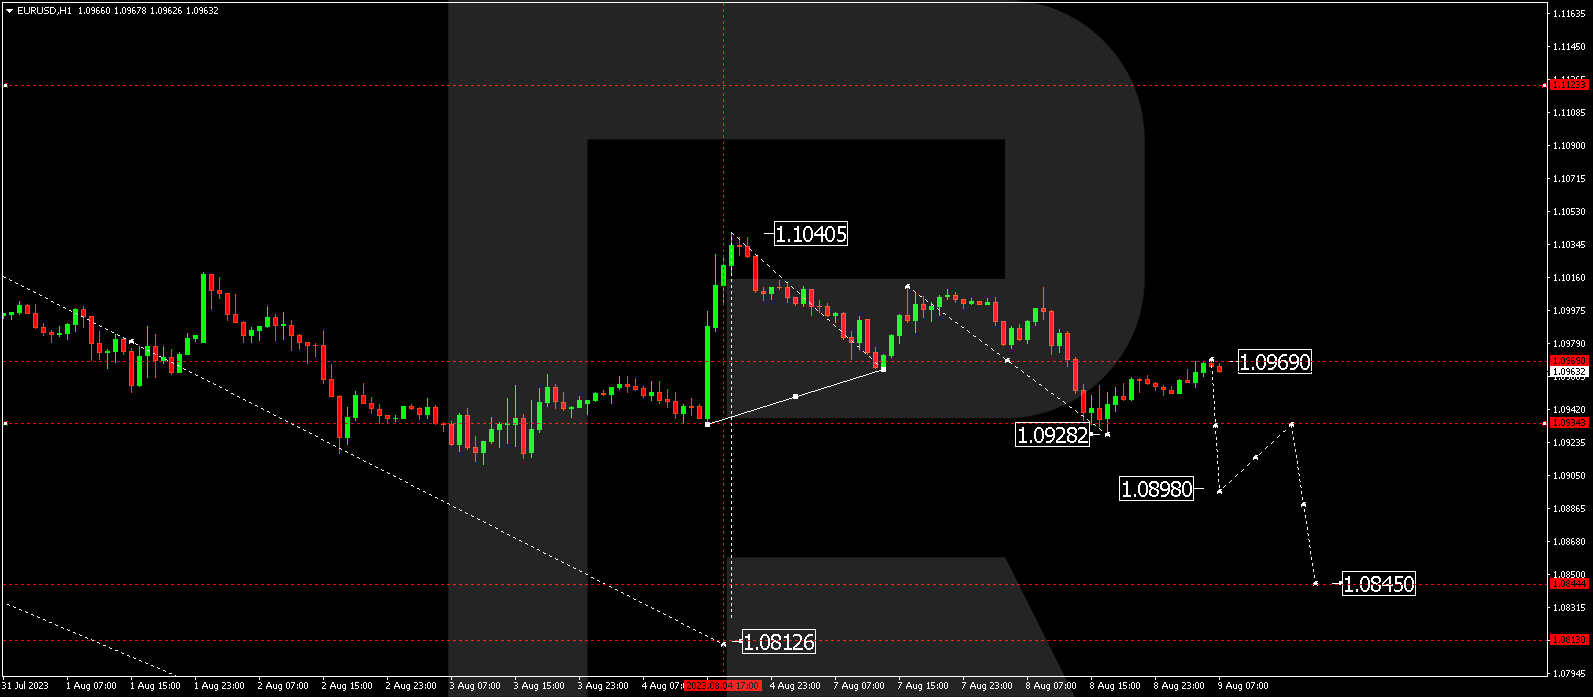
EURUSD, “Euro vs US Dollar”
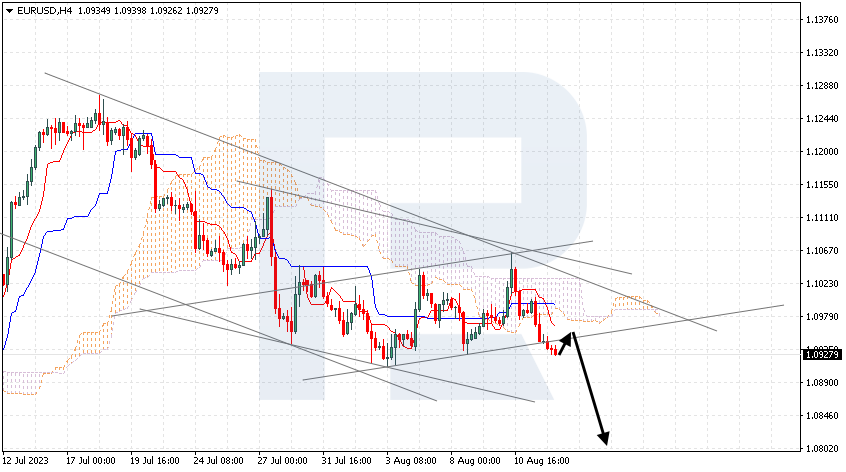
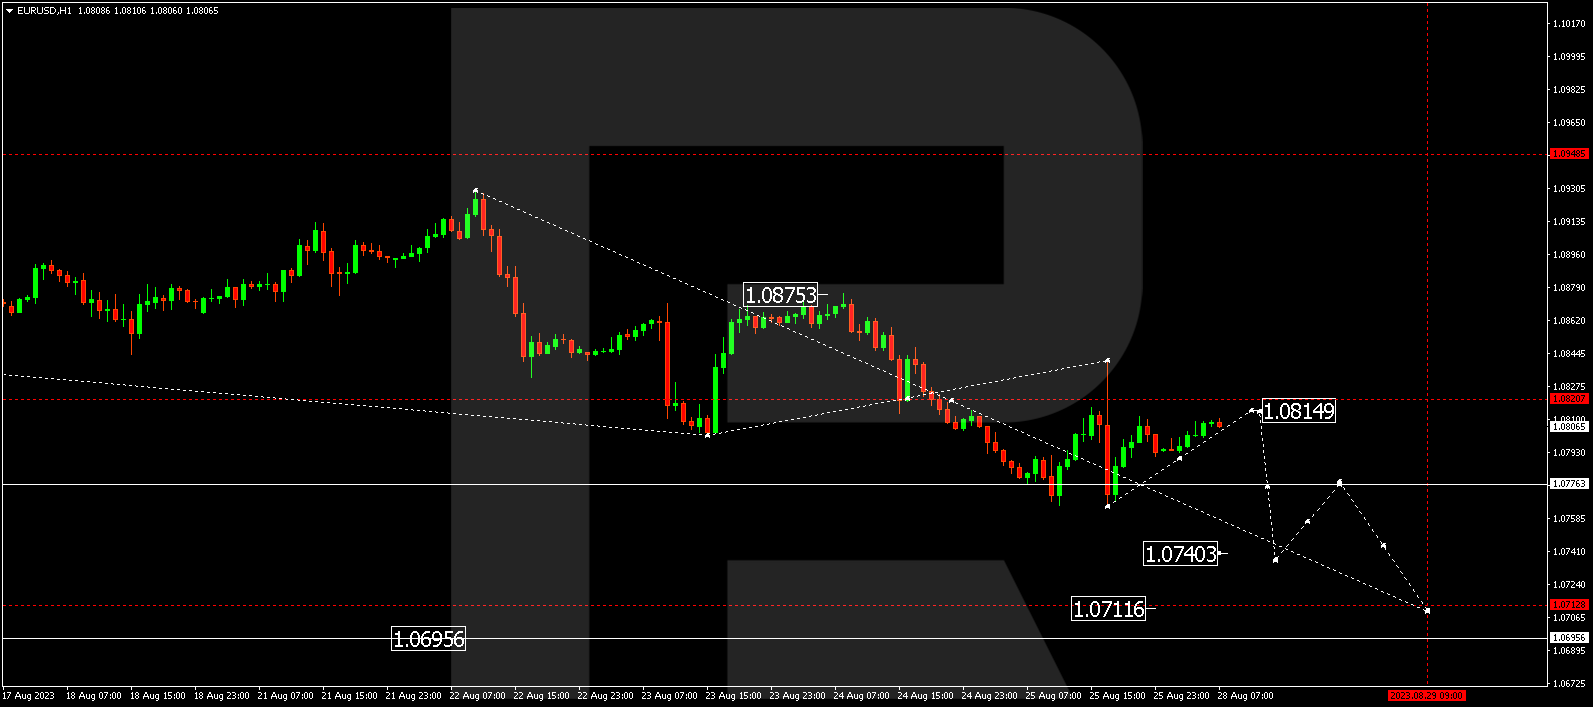
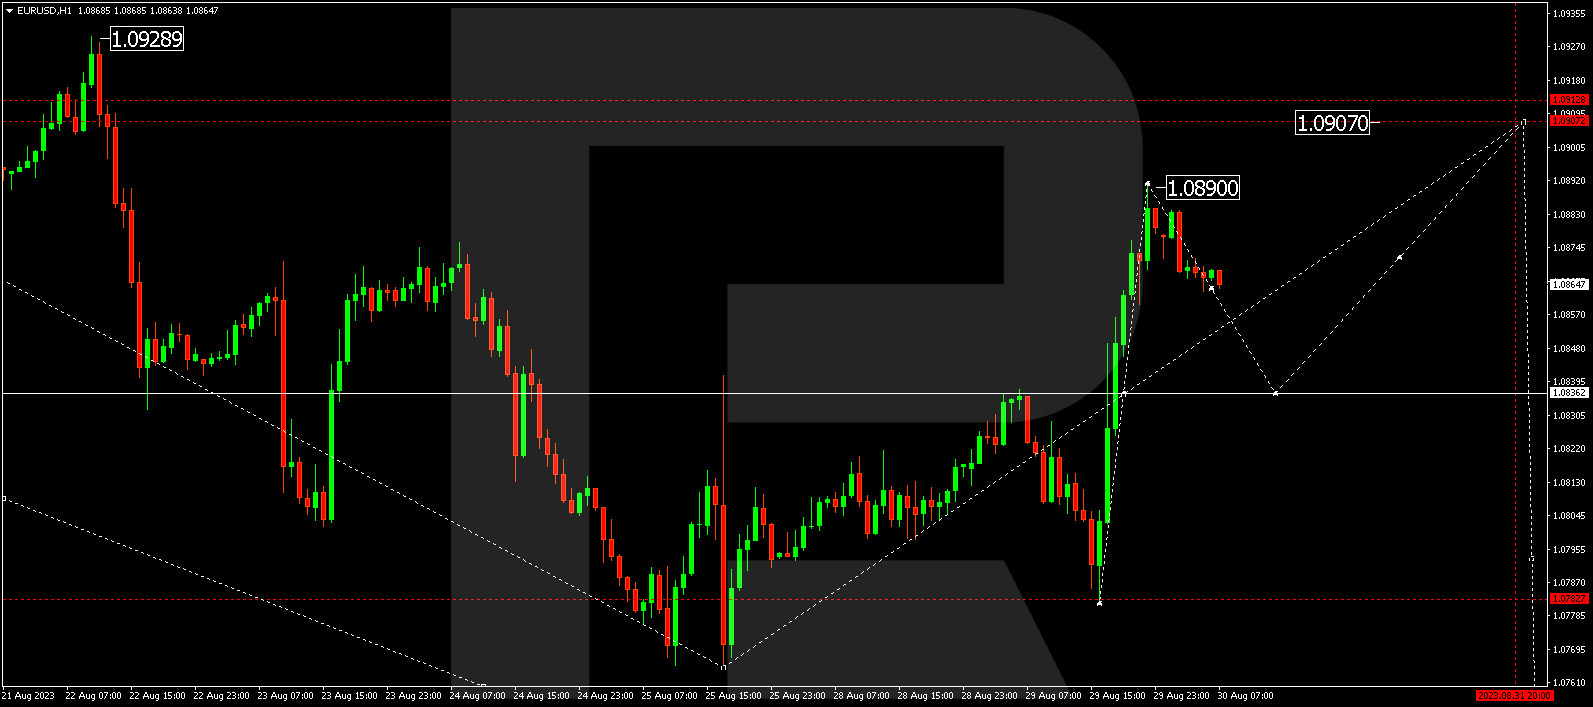
EURUSD has completed a wave of decline to the 1.0928 level. Today the market is correcting at the 1.0973 level (a test from below) with a wide consolidation range formed around the 1.0970 level. A downward breakout of the range is expected, with the third wave of decline developing further. The estimated target is 1.0815.
Read more - Technical Analysis & Forecast 09.08.2023