forex software

Create and Test Forex Strategies

forex software

Skip to forum content

Forex Software

Create and Test Forex Strategies

You are not logged in. Please login or register.


(Page 22 of 62)

Forex Software → Market Analysis → InstaForex Analysis

Pages Previous 1 20 21 22 23 24 62 Next

You must login or register to post a reply

RSS topic feed

Posts: 526 to 550 of 1,547

Re: InstaForex Analysis

Forecast for EUR/USD on March 27, 2020

EUR/USD
The euro climbed 150 points on Thursday due to rising risk appetite amid massive infusion of dollar liquidity by the Federal Reserve worth 75 billion dollars a day, the stock market will grow more than 6% (S&P 500 6.24%) and at the same time on the tragic data on applications for unemployment benefits – this past week showed the US economy's opinion in antivirus quarantine, the number of applications reached 3.283 million (!) against the forecast of 1.648 million Before the highest record figure was 669,000 in April 2009. The employment forecast for the next week shows economists' expectations for an increase in unemployment in March from 3.5% to 4.0% and a decrease in non-agricultural employment by 420,000 (in September 2008-422,000). In the euro area, the employment situation is even worse than in the US, but the markets in this situation have traditionally reacted sensitively to the very fact of bad data. Unemployment in Germany for March is expected to rise to 5.1%. We are cautious about the growth of the euro. Also, in the market, investors are taking risks with caution – the trading volume was even less than in the previous days of the week.

https://forex-images.ifxdb.com/userfiles/20200327/analytics5e7d7b62c9381.jpg

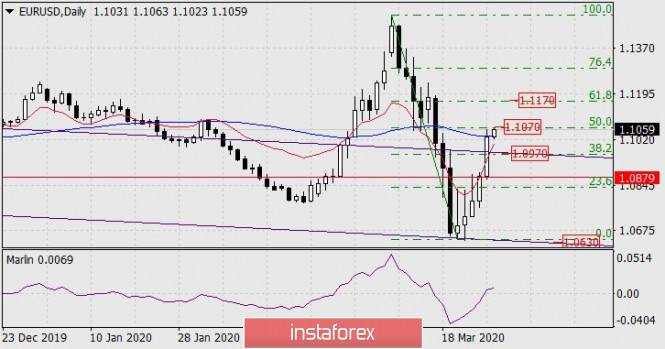
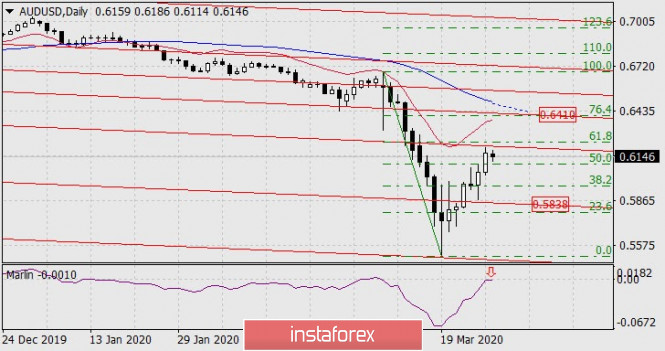
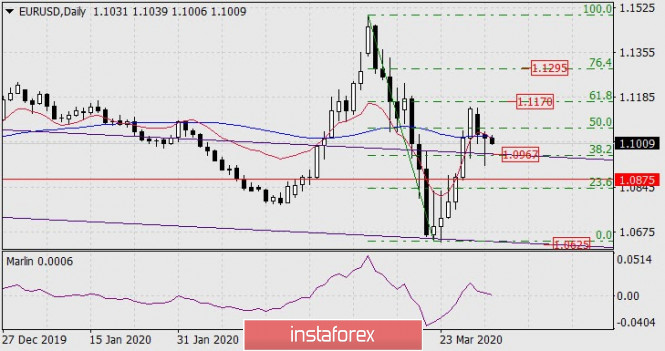
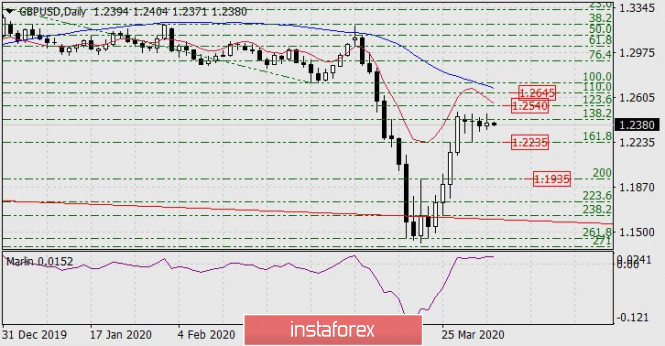
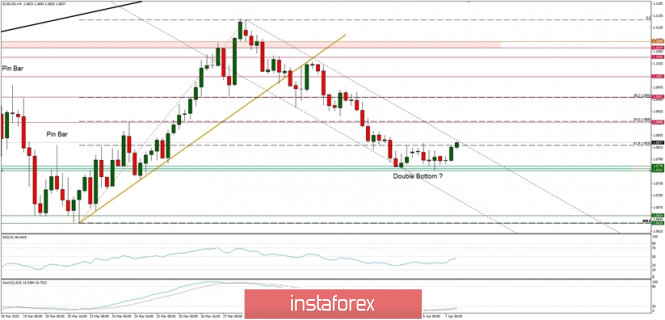
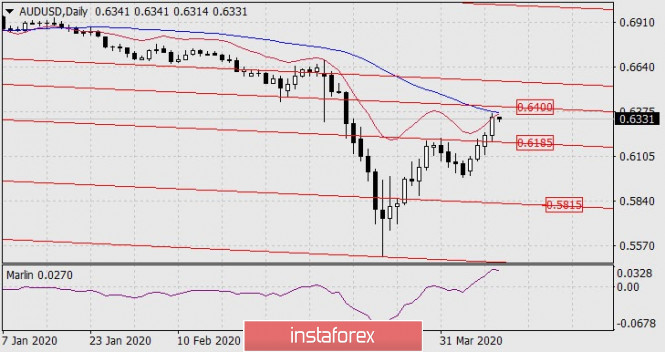
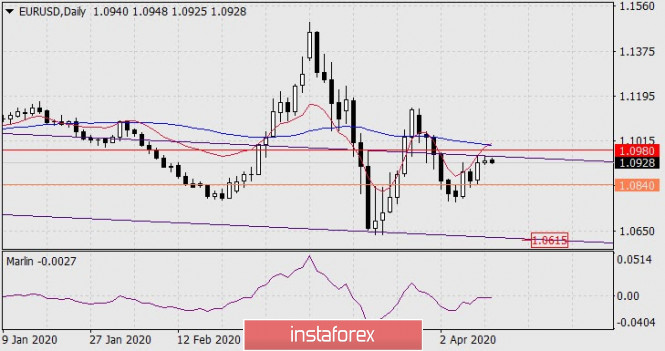
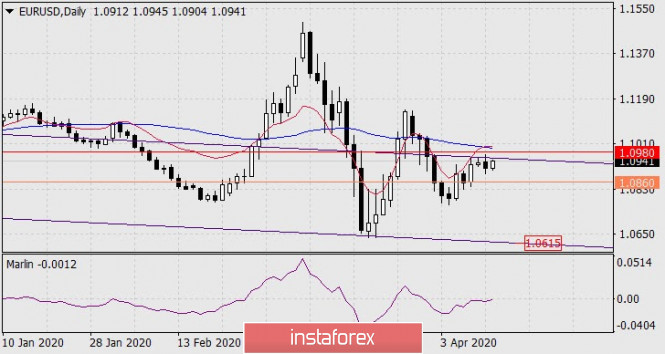
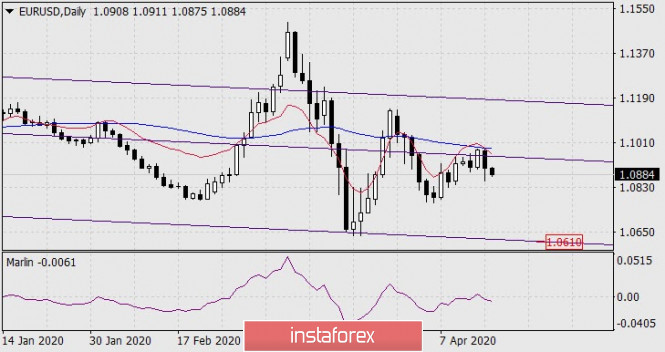
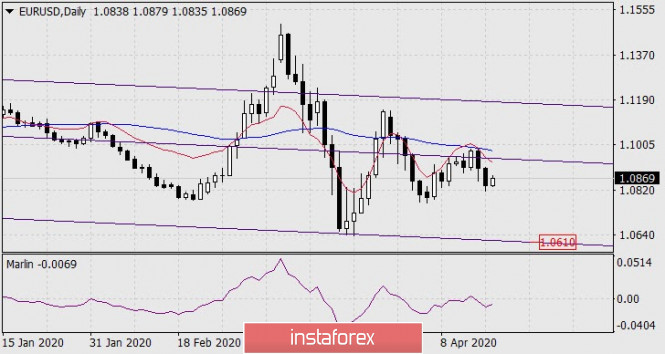
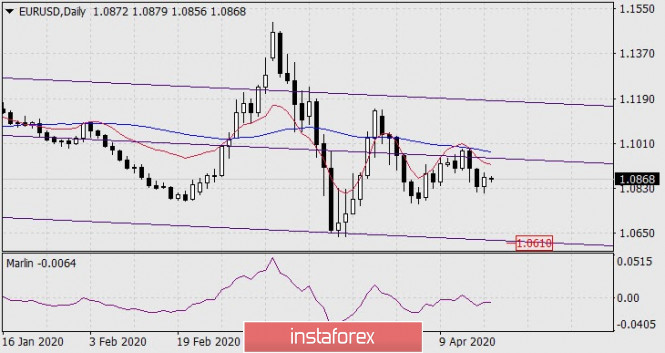
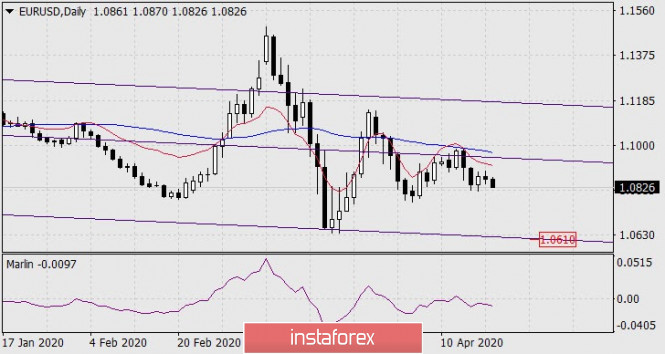
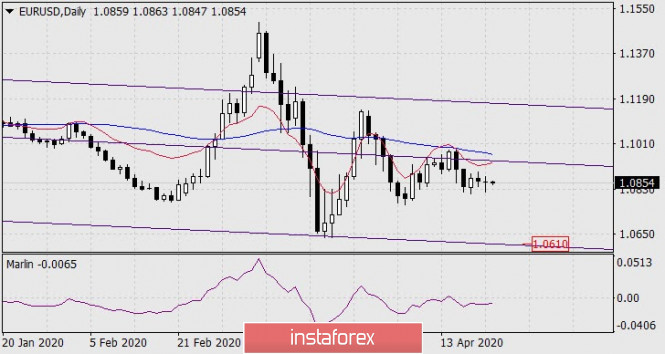
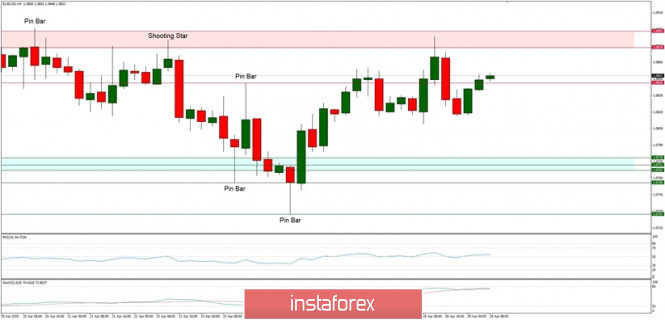
The correction was already 50% of the fall on March 9-20. The euro's desire to continue its corrective growth to 61.8% will be fraught with even greater difficulties. The Fibonacci level range of 50.0-61.8% contains multiple technical levels that have accumulated since July 2019. The price is currently above the MACD line and the Marlin oscillator has broken into the growth zone, but the market just needs to swing down a little and the indicators will again be in negative values. Consolidating the price above the Fibonacci level of 50.0% (1.1070) will make it possible to continue growth from the Fibonacci level of 61.8% at the price of 1.1170. Moving the price under the 38.2% Fibonacci level, which will also mean breaking through the support of the price channel (1.0970), opening a promising goal of 1.0630 along the lower line of the price channel. The intermediate target level of 1.0879 is the low of October 1, 2019.

https://forex-images.ifxdb.com/userfiles/20200327/analytics5e7d7b75b10f1.jpg

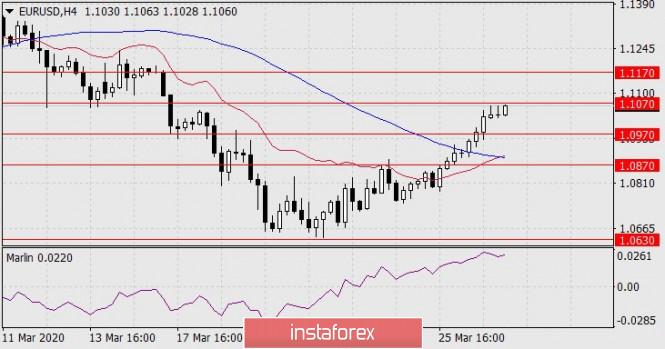
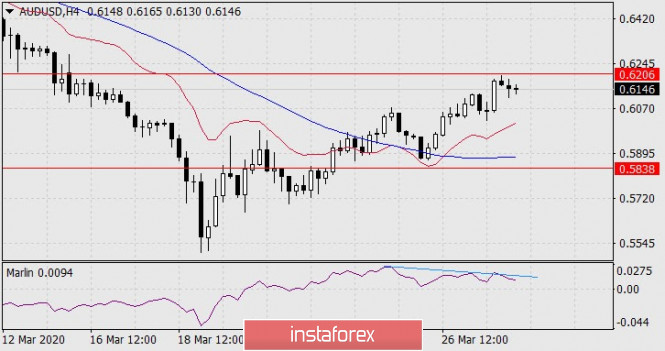
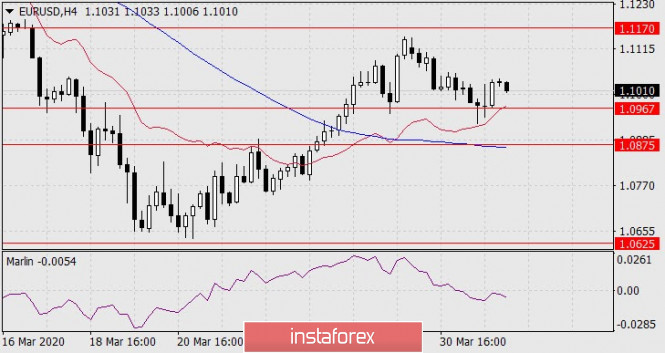
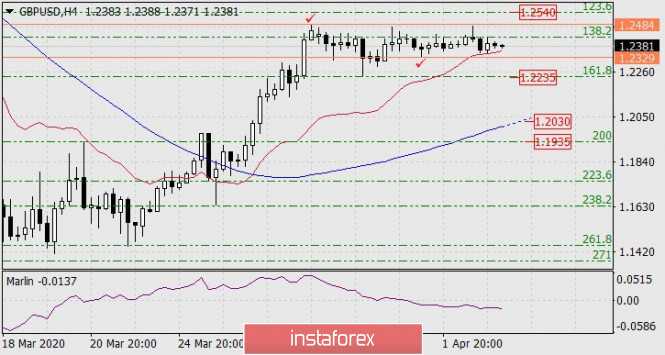
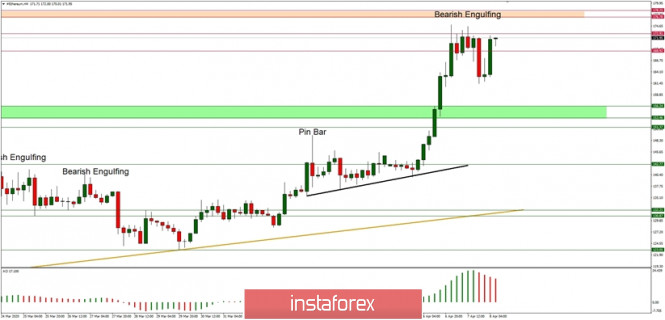
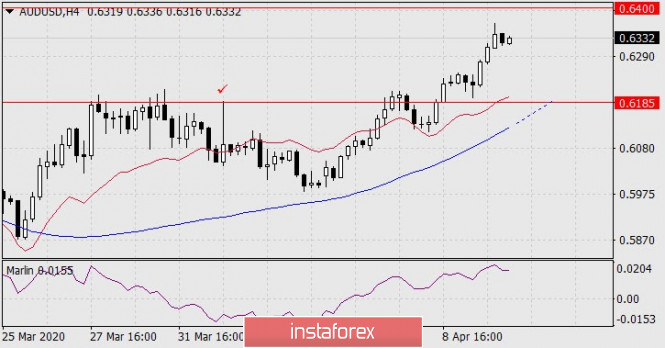
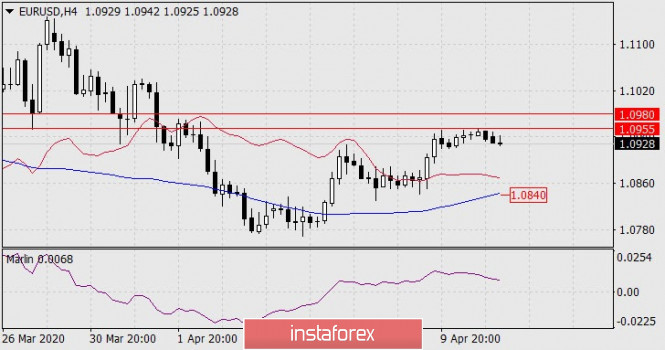
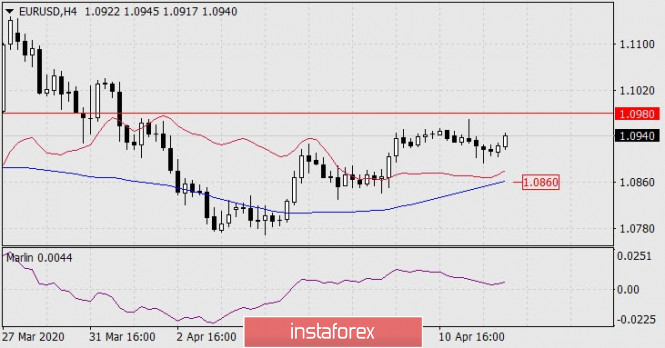
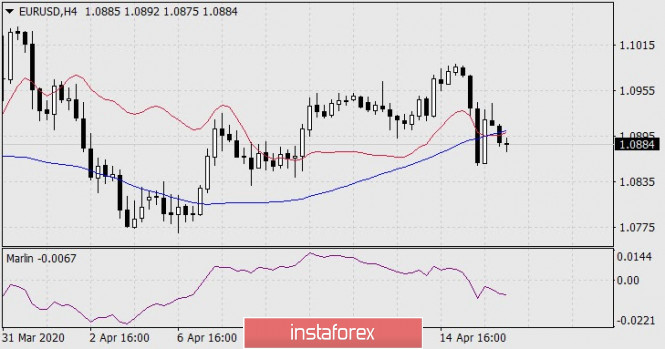
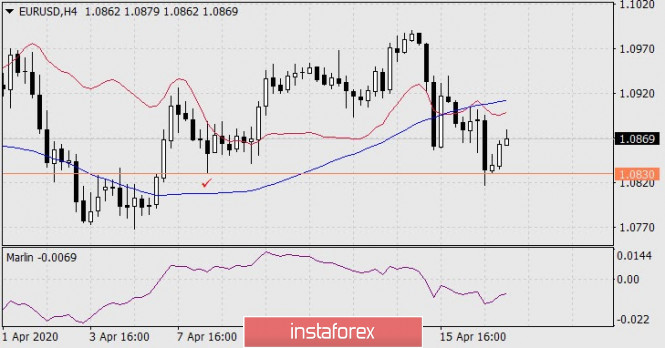
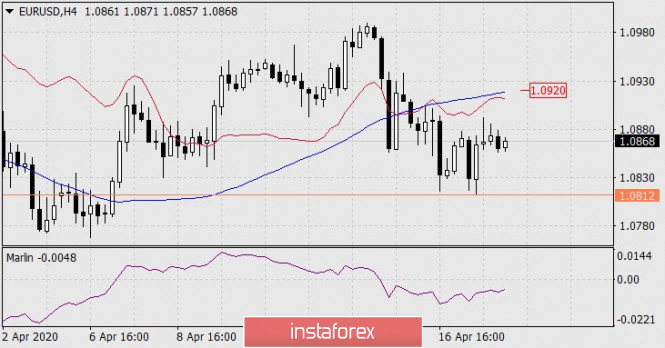
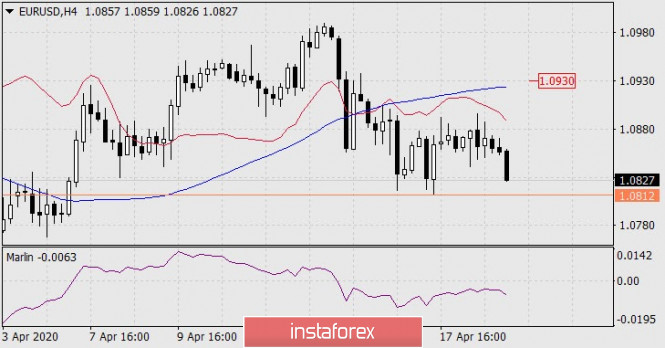
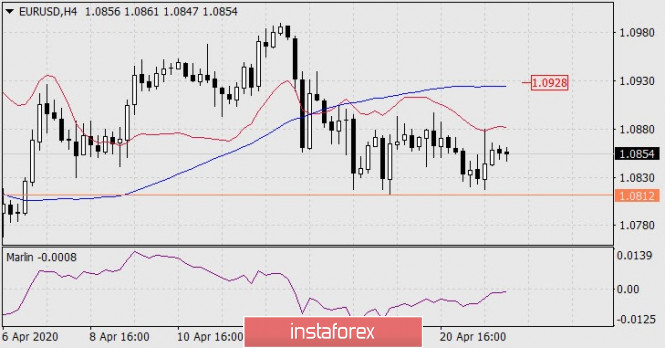
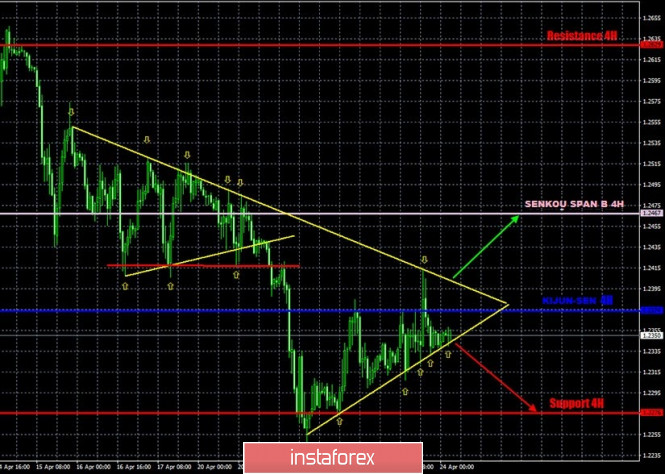
The price is still in a growing position on the four-hour chart, but the leading indicator Marlin is already turning down. We are waiting for the development of events.

*The market analysis posted here is meant to increase your awareness, but not to give instructions to make a trade.

Analysis are provided byInstaForex.

Best regards, PR Manager / Learn more about InstaForex Company at http://instaforex.com

Re: InstaForex Analysis

Forecast for AUD/USD on March 30, 2020

AUD/USD
The Australian pound grew by 122 points on Friday, with the upper shadow marking the enclosed line of the price channel. Today in the Asian session there is an intention of the price to move down from the achieved resistance. The signal line of the Marlin oscillator also touched the boundary with the growth territory and turns around from it. The purpose of the decline, in the case of a confirmed reversal, becomes the underlying price channel line in the region of 0.5838.

https://forex-images.ifxdb.com/userfiles/20200330/analytics5e817ab0111e0.jpg

The price exit above Friday's high could extend the aussie's growth to the upper embedded line of the price channel at the intersection with the Fibonacci level of 76.4% at 0.6410. The MACD line also tends to this point.

https://forex-images.ifxdb.com/userfiles/20200330/analytics5e817ac35ccc1.jpg

On the four-hour chart according to Marlin, a double divergence has formed, the sign of a reversal has strengthened.

Trading recommendations. It is advisable to open sales directly from current levels with consolidating profit in front of the level of 0.5838, S/L 0.6206. If the price goes above 0.6206, we buy with a target in front of the level of 0.6410, S/L 0.6113.

*The market analysis posted here is meant to increase your awareness, but not to give instructions to make a trade.

Analysis are provided byInstaForex.

Best regards, PR Manager / Learn more about InstaForex Company at http://instaforex.com

Re: InstaForex Analysis

Forecast for USD/JPY on March 31, 2020

USD/JPY
Today, the dollar is correcting up against the yen after the previous four-day fall. The closest and most powerful correction resistance is the MACD line on the daily chart on the price of 109.05. Departure of the price to support the price channel line at 107.02 opens the way to the lower channel line to the 102.60 area. Consolidating the price over the MACD line puts the dollar in a very difficult position of uncertainty of freely roaming in the 109.05-111.88 range, which in practice can mean that a certain range could form - a triangle or a flag.

https://forex-images.ifxdb.com/userfiles/20200331/analytics5e82b7e1c3c50.jpg

The situation is completely decreasing on the four-hour chart: the price is below the indicator lines, the Marlin oscillator is in the negative zone. From which, however, shows the intention to leave. Growth may continue to the MACD line at 109.70, which is higher than the resistance of the MACD line on the daily scale. Even in this discrepancy, uncertainty and possibility that the price could roam around begins. But all this uncertainty is related only to growth. Leaving the price below the linear support of 107.02 opens the way to a decrease to 102.60.

https://forex-images.ifxdb.com/userfiles/20200331/analytics5e82b7f518372.jpg

*The market analysis posted here is meant to increase your awareness, but not to give instructions to make a trade.

Analysis are provided byInstaForex.

Best regards, PR Manager / Learn more about InstaForex Company at http://instaforex.com

Re: InstaForex Analysis

Forecast for EUR/USD on April 1, 2020

EUR/USD
Yesterday, the euro launched an attack on the strong technical support of 1.0967, formed by the point of intersection with the line of the descending price channel and the Fibonacci level of 38.2%, as can be seen on the daily scale chart. At the same time, the price tried to gain a foothold under the MACD indicator line, but it returned to this line by the time the session ended.

https://forex-images.ifxdb.com/userfiles/20200401/analytics5e840e41202ba.jpg

Today, it opened under the MACD line and under the balance line (red indicator), which indicates the market's intention to repeat the attack at 1.0967. The signal line of the Marlin oscillator moves parallel to the boundary with the territory of the bears, waiting for a signal from the price itself.

https://forex-images.ifxdb.com/userfiles/20200401/analytics5e840e546c3ba.jpg

Marlin is already in the negative trend zone on the four-hour chart, while the price is kept above the balance and MACD lines. An attack pattern is created for the MACD line, that is, to the target level of 1.0875, determined at the low of October 1, 2019.

So, if yesterday's high of 1.1053 is not violated, short positions in the market can be opened with the target of 1.0875. Stop loss above 1.1053.

*The market analysis posted here is meant to increase your awareness, but not to give instructions to make a trade.

Analysis are provided byInstaForex.

Best regards, PR Manager / Learn more about InstaForex Company at http://instaforex.com

530 (edited by ifx.gertrude 2020-04-02 07:51:40)

Re: InstaForex Analysis

Forecast for USD/JPY on April 2, 2020

USD/JPY
The second day, the yen is kept in the range of two lines of the price channel (107.02-107.55). Foreign markets, primarily stock indices, are falling, which continues to put pressure on the pair and increases the likelihood of a price drop to the 102.60 target, determined by the price channel on the daily chart. The Marlin oscillator is staying in the declining trend zone. The S&P 500 lost 4.41% yesterday, while the Nikkei 225 is losing 0.86% today in the Asian session.

https://forex-images.ifxdb.com/userfiles/20200402/analytics5e85787a6f97c.jpg

A convergence has formed on the four-hour chart according to Marlin, but if a price reduction occurs in the next few hours, then a convergence will not form, the growth of the oscillator will take on the character of an indicator discharge before a further decrease.

https://forex-images.ifxdb.com/userfiles/20200402/analytics5e85788d3574e.jpg

If the price drops below yesterday's low of 106.93, sales may be opened with a target above 102.60, s/l above 107.85.

Overcoming the price of the upper limit of the range does not lead to opening purchases, since the growth rate is uncertain, it ranges from a little above 107.85 (false puncture) to 109.70 - the MACD line on daily, or even higher - up to 109.80, to the MACD line on H4.

Analysis are provided byInstaForex.

Best regards, PR Manager / Learn more about InstaForex Company at http://instaforex.com

Re: InstaForex Analysis

Forecast for GBP/USD on April 3, 2020

GBP/USD
The British pound has been moving sideways for five sessions along the 138.2% Fibonacci line. The short-term price drop on March 31 does not break the overall picture. If the price goes out of the range, it will trigger a further increase in the price to the Fibonacci levels of 123.6% and 110.0% - to the prices of 1.2540 and 1.2645, respectively. The resistance of the second target is boosted by the approaching MACD line. The targets of the downward movement are the Fibonacci levels of 161.8% and 200.0% at the price levels of 1.2235 and 1.1935.

https://forex-images.ifxdb.com/userfiles/20200403/analytics5e86d0dfc9065.jpg

We will highlight the signal levels on a smaller scale chart. These are: 1.2484 - March 27 peak and 1.2329 - April 1 low. Accordingly, at the moment of overcoming the price of 1.2484, purchases with goals up to 1.2645 are possible, with overcoming the price of 1.2329, it is advised to open sales with the goal of 1.1935. The intermediate target is 1.2030, which the MACD line is aiming for. If the price reverses from this level, it is advisable to close a short position.

https://forex-images.ifxdb.com/userfiles/20200403/analytics5e86d0f3b081d.jpg

Analysis are provided byInstaForex.

Best regards, PR Manager / Learn more about InstaForex Company at http://instaforex.com

Re: InstaForex Analysis

Control zones for USDCAD on 04/06/20

The pair has formed an accumulation zone over the past five days. The boundaries that will hinder further movement are the extremes of the previous week. The upper reference point is the weekly CZ 1.4350-1.4319. Support is the weekly control zones of 1.4037-1.4007. Tests of the specified zones should be perceived as an opportunity to search for deals inside the range.

https://forex-images.ifxdb.com/userfiles/20200406/analytics5e8a80e61aac8.jpg

Work within the framework of the flat involves inputs and outputs at its boundaries so that transactions will be limited to the range.

To exit the flat, you will need to consolidate the pair above one of the weekly control zone positions during the US session. This will allow you to change the trading style to an impulsive one. Closing trades above 1.4350 will allow you to consider medium-term purchases, while a consolidation below 1.4007 will indicate the beginning of a change in the medium-term momentum to a bearish one.

https://forex-images.ifxdb.com/userfiles/20200406/analytics5e8a80f900bd1.jpg

Daily CZ - daily control zone. The area formed by important data from the futures market, which changes several times a year.
Weekly CZ - weekly control zone. The zone formed by important marks of the futures market, which changes several times a year.
Monthly CZ - monthly control zone. The zone, which is a reflection of the average volatility over the past year.

Analysis are provided byInstaForex.

Best regards, PR Manager / Learn more about InstaForex Company at http://instaforex.com

Re: InstaForex Analysis

Technical Analysis of EUR/USD for 07/04/2020:

https://forex-images.ifxdb.com/userfiles/20200407/analytics5e8c16a7482fa.jpg

Technical Market Outlook:
The EUR/USD pair has hit the technical support at the level of 1.0767 and is trying to bounce higher. The current price action acts as there is a Double Bottom pattern made around the support, so the odds for a rally are quite high. The first obstacle is the technical resistance located at the level of 1.0888, but the oversold market conditions on H4 time frame chart might be helpful to the bulls. If they manage to break through this level, then in the same time, they will break out of the descending channel, and this should accelerate the rally towards the level of 1.0951. On the other hand, a failure to break out will likely result in deepening the move down and new local lows will be made. The next technical support is seen at the bottom of the swing at 1.0654 and 1.0635.

Weekly Pivot Points:
WR3 - 1.1359
WR2 - 1.1244
WR1 - 1.0981
Weekly Pivot - 1.0872
WS1 - 1.0612
WS2 - 1.0487
WS3 - 1.0228

Trading Recommendations:
The fear of the coronavirus consequences is very strong among the global investors and it rules on the financial markets. ON the EUR/USD pair the main trend is down, but the reversal is possible when the coronavirus pandemic will be tamed. The key long-term technical support is seen at the level of 1.0336 and the key long-term technical resistance is seen at the level of 1.1540. Only if one of this levels is clearly violated, the main trend might reverse (1.1540) or accelerate (1.0336).

Analysis are provided byInstaForex.

Best regards, PR Manager / Learn more about InstaForex Company at http://instaforex.com

Re: InstaForex Analysis

Technical Analysis of ETH/USD for 08/04/2020:

Crypto Industry News:

A new PricewaterhouseCoopers (PwC) report showed that fundraising and cryptography mergers and acquisitions (M&A) fell last year, but that doesn't mean the cryptographic market is dying out.

It seems that the cryptographic industry cannot attract investment from institutional investors. The giant of professional PwC services said that the number and value of fundraising as well as mergers and acquisitions showed a sharp decline last year. Cryptography-related mergers and acquisitions dropped by 76% to $ 451 million in 2019, from over $ 1.9 billion in the previous year. The amount of funds raised decreased by 40% to USD 2.24 billion.

Cryptocurrency space could not attract mainstream investment, despite the fact that Bitcoin grew strongly in the second and third quarters of 2019. In July, the price reached a peak of over $ 13,500.

Given the current COVID pandemic, the report's authors argue that the cryptocurrency market will not attract mainstream investment in the near future. High volatility due to coronavirus panic and the economic downturn does not bode well for the space being created. It seems that the cryptographic industry is not resistant to global winds, and the number and value of fundraising and merger transactions can be affected in 2020.

Technical Market Outlook:
The ETH/USD high located at the level of $175.00 is still an important target for bulls that are still trying to make use of the momentum behind the recent move up and move higher towards the level of $176.78, which is a technical resistance for the price. On the other hand, if the bulls fail here, (there is a Bearish Engulfing candlestick pattern present on H4 time frame chart), then the next taechnical support is seen at the level of $156.24 - $153.46. Please notice the increasing momentum on ETH/USD on H4 time frame chart during the last move up.

Weekly Pivot Points:
WR3 - $180.45
WR2 - $163.97
WR1 - $154.32
Weekly Pivot - $137.76
WS1 - $127.39
WS2 - $112.43
WS3 - $101.19

Trading Recommendations:
The fear of the coronavirus consequences is very strong among the global investors and it rules on the financial markets. So far the global investors are not so keen to invest in cryptocurrency, because they are being perceived as risky assets. The larger time frame trend on Ethereum remains down and as long as the level of $214.67 is not violated, all rallies will be treated as a counter-trend corrective moves. This is why the short positions are now more preferred.

https://forex-images.ifxdb.com/userfiles/20200408/analytics5e8d67d95da05.jpg

Analysis are provided byInstaForex.

Best regards, PR Manager / Learn more about InstaForex Company at http://instaforex.com

Re: InstaForex Analysis

Forecast for AUD/USD on April 9, 2020

AUD / USD
The Australian dollar reached its upper target of 0.6249 (February 2009 low) yesterday. Now, the question is: will it turn into a medium-term decline today, or mark the MACD line on the daily time frame (0.6354). The Marlin oscillator indicates a reversal, but it does not stop the price from rising by another hundred points.

https://forex-images.ifxdb.com/userfiles/20200409/analytics5e8e8ed0064e3.jpg

On the four-hour chart, there is a sign that an extended divergence on the Marlin oscillator is forming. The signal is twofold; on the one hand, it indicates the intention of the price to move downwards from the current levels, on the other, the divergence may dissolve in the continued growth of the indicator itself.

https://forex-images.ifxdb.com/userfiles/20200409/analytics5e8e8eea4828e.jpg

A clear signal of a trend reversal will be the price overcoming the support of the MACD line at around 0.6090.

So, with the price breaking the signal level of 0.6090, it is recommended to open short positions with a goal before 0.5820 and stop loss above 0.6115.

Analysis are provided byInstaForex.

Best regards, PR Manager / Learn more about InstaForex Company at http://instaforex.com

Re: InstaForex Analysis

Forecast for AUD/USD on April 10, 2020

AUD/USD
The Australian dollar rose by 109 points on Thursday, halting growth before the MACD line on the daily scale chart. The price could turn down from the current levels, maybe a little later, with preliminary testing of the embedded line of the price channel at the level of 0.6400.

https://forex-images.ifxdb.com/userfiles/20200410/analytics5e8feaccb4139.jpg

The condition for a reversal is that the price goes under the price channel line at 0.6185, and the movement is aimed at the trend line of 0.5815.

https://forex-images.ifxdb.com/userfiles/20200410/analytics5e8feadfbf3f3.jpg

The Marlin oscillator forms a downward turn on the four-hour chart. The signal level of 0.6185 of the higher timeframe coincides with the April 1 peak (tick) and with the support of the MACD line, where it can be in a day, that is, on Monday morning.

Analysis are provided byInstaForex.

Best regards, PR Manager / Learn more about InstaForex Company at http://instaforex.com

Re: InstaForex Analysis

Forecast for EUR/USD on April 13, 2020

EUR/USD
The euro made minor fluctuations before the resistance of the embedded line of the downward price channel on Friday, as the markets in Europe and the United States were closed. The signal line of the Marlin oscillator unfolds from the border with the growth territory. A synchronous downward reversal of the price and the indicator is possible.

https://forex-images.ifxdb.com/userfiles/20200413/analytics5e93e7595c1ca.jpg

Marlin turned lower on the four-hour chart. A stable condition for the euro's fall is when the price leaves the area below the MACD line in 1.0840. In this case, the target of the movement is the lower line of the price channel at 1.0615 (daily).

https://forex-images.ifxdb.com/userfiles/20200413/analytics5e93e76bb5935.jpg

But until the signal level has been overcome, the price can still make a false puncture of the upper line of the price channel by testing the November 2019 low (1.0980), or the MACD line on the daily (blue indicator) in the area of 1.0990.

*The market analysis posted here is meant to increase your awareness, but not to give instructions to make a trade.

Analysis are provided byInstaForex.

Best regards, PR Manager / Learn more about InstaForex Company at http://instaforex.com

Re: InstaForex Analysis

Forecast for EUR/USD on April 14, 2020

EUR/USD The euro fell by 22 points on Monday, rebounding from the blue line of the price channel on the daily chart. The leading indicator Marlin is in no hurry to turn around, holding on to the border with the territory of growth. This may be a sign of another small upward movement before the medium-term drop. The MACD line in the region of 1.0980 or slightly higher can be tested.

https://forex-images.ifxdb.com/userfiles/20200414/analytics5e953969ba597.jpg

On the four-hour chart, the price develops above the indicator lines of balance and MACD, the signal line of the Marlin oscillator is confidently decreasing here, but has yet to leave the growth zone, which in total does not cancel the option with the final price increase. The situation will change abruptly to a downward trend with the price moving under the MACD line at 1.0860. The 1.0615 target will open – the embedded lower line of the price channel on the daily chart.

https://forex-images.ifxdb.com/userfiles/20200414/analytics5e95397c493f3.jpg

*The market analysis posted here is meant to increase your awareness, but not to give instructions to make a trade.

Analysis are provided byInstaForex.

Best regards, PR Manager / Learn more about InstaForex Company at http://instaforex.com

Re: InstaForex Analysis

Forecast for EUR/USD on April 15, 2020

EUR/USD
On Tuesday, the euro worked out an option with a push to the MACD line on the daily chart, but the market is starting to seriously try to move to the target of 1.1175 on the nested price channel line. This scenario will begin to be implemented with the release of prices above the MACD line, that is, above 1.1000. The signal line of the Marlin oscillator has entered the territory of a growing trend.

https://forex-images.ifxdb.com/userfiles/20200415/analytics5e96741413b37.jpg

The price is rising on a four-hour chart, and it is above the balance and MACD line, while Marlin turned up before the division of trends.

https://forex-images.ifxdb.com/userfiles/20200415/analytics5e96742a4eb19.jpg

The market still has a chance of a price reversal and a medium-term fall in the euro, but for this to happen, the price needs to consolidate under the MACD line, below 1.0890.

Thus, with the price above 1.1000, purchases with a take profit below 1.1175 and stop loss below 1.0950 (under the line of the price channel) can be opened. Sales, in turn, can be opened with withdrawal prices below 1.0890.

*The market analysis posted here is meant to increase your awareness, but not to give instructions to make a trade.

Analysis are provided byInstaForex.

Best regards, PR Manager / Learn more about InstaForex Company at http://instaforex.com

Re: InstaForex Analysis

Forecast for EUR/USD on April 16, 2020

EUR/USD
The euro did not do anything unnecessary, nor did it make any false movements on Wednesday, turning down exactly from the MACD line on the daily chart. Simultaneously with the price reversal, the signal line of the Marlin oscillator turned down from the border of the growth territory (the exit above the zero line was insignificant, which can not even be called false). Now the euro's target is the embedded price channel line around 1.0610.

https://forex-images.ifxdb.com/userfiles/20200416/analytics5e97d046aba82.jpg

This morning, the price retreated under the balance and MACD indicator lines on the four-hour chart, the Marlin oscillator has consolidated on the declining trend zone. We are expecting the price to fall to the designated goal.

https://forex-images.ifxdb.com/userfiles/20200416/analytics5e97d05922c57.jpg

*The market analysis posted here is meant to increase your awareness, but not to give instructions to make a trade.

Analysis are provided byInstaForex.

Best regards, PR Manager / Learn more about InstaForex Company at http://instaforex.com

Re: InstaForex Analysis

Forecast for EUR/USD on April 17, 2020

EUR/USD
The euro continued its planned decline from a technical point of view on Thursday. Losses amounted to 70 points as investors withdrew to a safe dollar, since the latest data on new weekly applications for unemployment benefits reached 5.245 million and bookmarks of new homes fell to 2.22 million in March against the expectation of 1.31 million. In addition, the business index activity in the manufacturing sector of Philadelphia fell from -12.7 to -56.6 in April, to a record since August 1980.

https://forex-images.ifxdb.com/userfiles/20200417/analytics5e9922475408b.jpg

The price is decreasing under the balance and MACD indicator lines on the daily scale chart, and the Marlin oscillator is fixed in the decline zone. We expect the euro to support the embedded price channel line around 1.0610.

https://forex-images.ifxdb.com/userfiles/20200417/analytics5e992259d055f.jpg

The price is also under the balance and MACD lines on the four-hour chart, Marlin is in the negative trend territory.

The signal level for opening sales is the April 8 low at a price of 1.0830. Stop loss at 1.0880, take profit before 1.0610. Intermediate goal of 1.0768.

*The market analysis posted here is meant to increase your awareness, but not to give instructions to make a trade.

Analysis are provided byInstaForex.

Best regards, PR Manager / Learn more about InstaForex Company at http://instaforex.com

Re: InstaForex Analysis

Forecast for EUR/USD on April 20, 2020

EUR/USD
The euro did not dare to make any noticeable decline last Friday, moreover, it even grew by 35 points by preceding to pierce the signal level for selling 1.0830. Now this signal level is moving lower - to the Friday low at the 1.0812 level, overcoming the price opens the way to support the embedded line of the price channel in the region of 1.0610.

https://forex-images.ifxdb.com/userfiles/20200420/analytics5e9d20dc6873d.jpg

The overall situation of a decline persists on the four-hour chart. The price is developing under both indicator lines - under the line of balance (red) and MACD (blue), the Marlin oscillator in the territory of negative values.

The price increase is limited by the resistance of the MACD line at around 1.0920.

https://forex-images.ifxdb.com/userfiles/20200420/analytics5e9d20eeec659.jpg

*The market analysis posted here is meant to increase your awareness, but not to give instructions to make a trade.

Analysis are provided byInstaForex.

Best regards, PR Manager / Learn more about InstaForex Company at http://instaforex.com

Re: InstaForex Analysis

Forecast for EUR/USD for April, 21, 2020

EUR/USD

Oil and US stock indices fell on Monday. Investors again felt fear and continued to buy up the dollar as a safe haven currency. And although the euro fell by only nine points yesterday, fears and uncertainty will continue to dominate the markets for several more days.

https://forex-images.ifxdb.com/userfiles/20200421/analytics5e9e67f7776da.jpg

The picture remained unchanged on the daily chart - the price is under the indicator lines of balance and MACD, the Marlin oscillator moves horizontally in the negative trend zone. The 1.0610 target for supporting the embedded price channel line of a higher timeframe is maintained.

https://forex-images.ifxdb.com/userfiles/20200421/analytics5e9e6809d999c.jpg

The situation is also unchanged on the four-hour chart, with the only difference being that the indicator lines have started to go down, which strengthened the potential for decline. The final condition for the price to move to 1.0610 will be for the price to overcome Friday's low at 1.0812. Accordingly, short positions can be opened from this level.

An alternative short-term scenario suggests another branch of price growth to the MACD line on the H4 towards the area of 1.0930.

*The market analysis posted here is meant to increase your awareness, but not to give instructions to make a trade.

Analysis are provided byInstaForex.

Best regards, PR Manager / Learn more about InstaForex Company at http://instaforex.com

Re: InstaForex Analysis

Forecast for EUR/USD on April 22, 2020

EUR/USD
There were no changes on the daily euro chart over the past day - the daily fluctuation was 60 points, but the day nearly closed at the opening level. The signal line of the Marlin oscillator moves strictly horizontally in the negative trend zone. The general trend is decreasing, we expect the euro to decline to support the embedded line of the price channel in the region of 1.0610.

https://forex-images.ifxdb.com/userfiles/20200422/analytics5e9fb72845d29.jpg

The signal line of the Marlin oscillator rose to the border of the growth territory on the four-hour chart over the past day, but the price stopped by the balance indicator line. Therefore, in the current situation, the growth of Marlin is considered as the indicator continuing to discharge before a further decrease.

https://forex-images.ifxdb.com/userfiles/20200422/analytics5e9fb73aac9dc.jpg

Nevertheless, the probability of the oscillator moving into a zone of positive values creates a risk of a price increase, possibly even to the MACD line, to the 1.0928 area. A signal of the euro's decisive decline is when the price drops below the low of the 17th (1.0812).

*The market analysis posted here is meant to increase your awareness, but not to give instructions to make a trade.

Analysis are provided byInstaForex.

Best regards, PR Manager / Learn more about InstaForex Company at http://instaforex.com

Re: InstaForex Analysis

Forecast for AUD/USD on April 23, 2020

AUD/USD The Australian dollar did not consolidate below the MACD indicator line on the daily chart on Wednesday, which delayed the start of the medium-term decline by another 1-2 days. The aussie grew by 42 points. Currently, the price lies on the MACD line, accumulating forces to break through, but growth is possible during this time of consolidation, even to the price channel line in the region of 0.6525, since the price is still above both indicator lines and the Marlin oscillator, albeit falling, remains in the growth zone. Formally, the trend is rising.

https://forex-images.ifxdb.com/userfiles/20200423/analytics5ea10fcae10d6.jpg

When the price overcomes the signal level of 0.6255, this will be a reliable condition for the medium-term decline while aiming for 0.5798 and below. The setup is falling on the H4 chart - the price is below the adaptive balance line (red). The Marlin oscillator could reverse from the boundary of the growth territory. A convergence on Marlin that is not that strong can be worked out.

https://forex-images.ifxdb.com/userfiles/20200423/analytics5ea10fddd154a.jpg

It is advised to skip the possible price increase, since the reversal can occur from any nearest resistance (0.6380, 0.6446), open sales when the price goes below the signal level of 0.6255.

*The market analysis posted here is meant to increase your awareness, but not to give instructions to make a trade.

Analysis are provided byInstaForex.

Best regards, PR Manager / Learn more about InstaForex Company at http://instaforex.com

Re: InstaForex Analysis

Hot forecast and trading signals for GBP/USD pair on April 24

GBP/USD H1.

https://forex-images.ifxdb.com/userfiles/20200424/analytics5ea26cba7841c.jpg

On the hourly chart, the pound/dollar pair is trading downward on April 24. The downward movement of quotes is supported by a strong downward trend line, which has at least 6 pivot points. The last time the pair's quotes rebound from it was yesterday. At the same time, there is a second trend line – an ascending one, which also has 6 pivot points at once and, accordingly, is also quite strong. Thus, the pound is currently fixed in a kind of triangle, leaving which will determine the further short-term trend of the pair. On the other hand, the statistics from the UK this week were generally as disastrous as those in other countries. The only report that could provoke the strengthening of the pound was the applications for unemployment benefits in March, which caused its fall. But all the other reports, including yesterday's business activity, most likely stop the bulls from buying pounds or close short positions on the US dollar. And if this is true, then the bears are activated either today or at the beginning of next week. As for the EUR/USD pair, we recommend that you pay attention to the report on long-term use orders in the States at the American trading session. If traders suddenly stop ignoring important statistics, then the bulls will be able to take advantage of the opportunities provided and continue to buy the pair with renewed strength. In any case, we have an ideal picture of the pound / dollar pair in terms of beauty and accuracy, which we assume two trading ideas for April 24:

1) Bears need to consolidate below the upward trend line in order to continue the downward movement. This will break the short-term bullish trend and keep the longer-term bearish current. In this case, we recommend selling the pound in order to support the 4-hour timeframe 1.2276. Thus, Take Profit can be around 72 points.

2) As long as the bulls are located above the upward trend line,the bullish trend persists in terms of intraday. Thus, the GBP/USD pair has even a growth potential to the level of 1.2395. However, no one knows how many more times the pair will push off from the upward trend line, so it is quite dangerous to trade for an increase right now. We believe that it is better to wait for the downward trend line to be broken, which will definitely be a strong signal to buy with the goal of the Senkou span B line of the 4-hour timeframe, which runs approximately at the level of 1.2467. Thus, the possible Take Profit for long positions is 68 points.

*The market analysis posted here is meant to increase your awareness, but not to give instructions to make a trade.

Analysis are provided byInstaForex.

Best regards, PR Manager / Learn more about InstaForex Company at http://instaforex.com

Re: InstaForex Analysis

Technical Analysis of ETH/USD for 27/04/2020:

https://forex-images.ifxdb.com/userfiles/20200427/analytics5ea669f86b838.jpg

Crypto Industry News:

The Dutch crypto savings platform, Bittr, decided to close its operations before the Netherlands introduced EU anti-money laundering regulations, AMLD5. The closing of Bittr is the result of open criticism of AMLD5 in the Netherlands, where according to all information they result in cryptographic companies paying higher fees than companies offering credit cards and traditional trusts. Bittr founder Ruben Waterman announced that the platform will close on April 28.

Waterman does not agree to being forced to collect confidential data identifying his clients. While Waterman says he was willing to make some of the changes commissioned by AMLD5, he also claims that his company does not have the resources to manage the documentation or the resources to hire a clerk to handle the case. It is worth adding that Bittr is a one-man operation.

While the AMLD5 was intended to increase regulatory transparency at the regional level, by introducing a unified AML framework, various laws at the national level led to unique interpretations of AMLD5 in different jurisdictions.

The new guidelines require approximately 50 crypto companies based in the Netherlands to pay central bank supervision fees of approximately $ 1.8 million, and the costs be allocated according to the turnover of each company's virtual currency.

Technical Market Outlook:

The ETH/USD bulls has managed to push the price towards the level of $198, which is very close to the key short-term resistance level. The rate is moving inside of a Falling Wedge pattern, so any violation of the level of $193.78 will likely result in a further sell-off towards the level of $188.86 and below. There is a clear bearish divergence between the price and momentum indicator that supports the short-term bearish outlook.

Weekly Pivot Points:
WR3 - $243.80
WR2 - $220.39
WR1 - $211.16
Weekly Pivot - $187.55
WS1 - $172.98
WS2 - $155.34 WS3 - $144.09

Trading Recommendations:
The fear of the coronavirus consequences is very strong among the global investors and it rules on the financial markets. So far the global investors are not so keen to invest in cryptocurrency, because they are being perceived as risky assets. The larger time frame trend on Ethereum remains down and as long as the level of $214.67 is not violated, all rallies will be treated as a counter-trend corrective moves. This is why the short positions are now more preferred.

Analysis are provided byInstaForex.

Best regards, PR Manager / Learn more about InstaForex Company at http://instaforex.com

Re: InstaForex Analysis

Technical Analysis of ETH/USD for 28/04/2020:

https://forex-images.ifxdb.com/userfiles/20200427/analytics5ea669f86b838.jpg

Crypto Industry News:
EthereumPrice.org has released a new tool to calculate how much ETH can be earned by stacking coins under the new network consensus model. The Ethereum 2.0 calculator has many configurable settings that simulate different conditions and stacking variables. Users can customize many network (variable) settings that have a big impact on how the reward is calculated.

For example, a change in the size of ETHs stacked in the network from 1% to 10% means a difference in earnings between 5% or 15% (each year). Another factor that will affect the award on an annual basis is, for example, the lifetime of the node (validator) itself.

The tool calculates potential profits from 10 years of ETH stacking as well as each year. It will also calculate ROI (return on investment) in a given time. To view the value of their bid, users can choose from many fiat functional currencies, ETH in USD, EUR, GBP, JPY and others.

The calculator is currently in public beta. The current interface should be treated more as an educational device than a means for practical calculations. However, this gives an idea of how important staking will become part of the 'new Ethereum' ecosystem. Technical Market Outlook:

The ETH/USD bears has pushed the price out of the Falling Wedge pattern and Ethereum made a new local low at the level of $188.86. There is a clear bearish divergence between the price and momentum indicator that supports the short-term bearish outlook, so the level of $188.86 might not be the target level and the ETH/USD rate can drop even further towards the next target at $178.25. The key short-term technical resistance is still located at the level of $198.72 and only a clear breakout above this level will open the road towards the $209.09 target.

Weekly Pivot Points:
WR3 - $243.80
WR2 - $220.39
WR1 - $211.16
Weekly Pivot - $187.55
WS1 - $172.98
WS2 - $155.34
WS3 - $144.09

Trading Recommendations:
The fear of the coronavirus consequences is very strong among the global investors and it rules on the financial markets. So far the global investors are not so keen to invest in cryptocurrency, because they are being perceived as risky assets. The larger time frame trend on Ethereum remains down and as long as the level of $214.67 is not violated, all rallies will be treated as a counter-trend corrective moves. This is why the short positions are now more preferred.

Analysis are provided byInstaForex.

Best regards, PR Manager / Learn more about InstaForex Company at http://instaforex.com

Re: InstaForex Analysis

Technical Analysis of EUR/USD for 29/04/2020:

https://forex-images.ifxdb.com/userfiles/20200429/analytics5ea9173c7b477.jpg

Technical Market Outlook:
The EUR/USD pair has hit the key short-term resistance located at the level of 1.0878. So far the bulls were able to make a new local high at the level of 1.0849 and they are under the bearish pressure again. The price was rejected from the level of 1.0878 and a Bearish Engulfing candlestick pattern was made at the end of the move. The momentum is still strong and positive, but the market conditions are overbought, so the odds for another dynamic wave up are decreasing. The nearest technical support is seen at the level of 1.0809.

Weekly Pivot Points:
WR3 - 1.1057
WR2 - 1.0976
WR1 - 1.0895
Weekly Pivot - 1.0809
WS1 - 1.0731
WS2 - 1.0641
WS3 - 1.0563

Trading Recommendations:
The fear of the coronavirus consequences is very strong among the global investors and it rules on the financial markets. ON the EUR/USD pair the main trend is down, but the reversal is possible when the coronavirus pandemic will be tamed. The key long-term technical support is seen at the level of 1.0336 and the key long-term technical resistance is seen at the level of 1.1540. Only if one of this levels is clearly violated, the main trend might reverse (1.1540) or accelerate (1.0336).

Analysis are provided byInstaForex.

Best regards, PR Manager / Learn more about InstaForex Company at http://instaforex.com

Re: InstaForex Analysis

Technical Analysis of ETH/USD for 30/04/2020:

https://forex-images.ifxdb.com/userfiles/20200430/analytics5eaa5c765b474.jpg

Crypto Industry News:
The China Office of the Central Commission for Cyberspace Affairs (OCCAC) has announced blockchain projects that will receive the approval of national regulatory authorities. 224 projects in this technology have been added to the committee register, including large technology companies such as Alibaba, Baidu and China Mobile.

The list of approved projects includes the ventures of several large corporations, including Walmart China, whose food safety tracking initiative has been marked green, and companies involved in the development of state-supported blockchain networks, such as China Mobile, China Merchants Bank and Alibaba. Some entities have been allowed to implement many DLT projects, and five blockchain projects from China Merchants Bank have already received approval.

On April 25, China announced the commercial launch of the long-awaited Blockchain Service Network (BSN). The Chinese government announced over 2,000 BSN-based programs in the six months prior to the beta release in October 2019, including applications to support social assistance distribution, goods tracking and digital invoicing. On April 20, the city of Ya'an in Sichuan issued a statement supporting the directing of local hydropower to cryptocurrency mining operations, announcing plans to build the so-called Demonstration zones for hydropower consumption.

Technical Market Outlook:
The ETH/USD has been rallying for the last 36h straight as all the technical resistance levels has been violated. The next target for bulls is seen at the level of $235.42, but please notice, that the market conditions are extremely overbought. The nearest technical support is located at the level of $214.67, $212.48 and $209.89. The bulls are in full control of the market.

Weekly Pivot Points:
WR3 - $243.80
WR2 - $220.39
WR1 - $211.16
Weekly Pivot - $187.55
WS1 - $172.98
WS2 - $155.34
WS3 - $144.09

Trading Recommendations:
The fear of the coronavirus consequences is very strong among the global investors and it rules on the financial markets. So far the global investors are not so keen to invest in cryptocurrency, because they are being perceived as risky assets. The larger time frame trend on Ethereum remains down and as long as the level of $214.67 is not violated, all rallies will be treated as a counter-trend corrective moves. This is why the short positions are now more preferred.

Analysis are provided byInstaForex.

Best regards, PR Manager / Learn more about InstaForex Company at http://instaforex.com

Posts: 526 to 550 of 1,547

Pages Previous 1 20 21 22 23 24 62 Next

You must login or register to post a reply

Forex Software → Market Analysis → InstaForex Analysis

Similar topics in this forum