forex software

Create and Test Forex Strategies

forex software

Skip to forum content

Forex Software

Create and Test Forex Strategies

Forex Software

You are not logged in. Please login or register.


(Page 39 of 44)

Forex Software → Market Analysis → Forex Technical Analysis & Forecast by RoboForex

Pages Previous 1 37 38 39 40 41 44 Next

You must login or register to post a reply

RSS topic feed

Posts: 951 to 975 of 1,099

Re: Forex Technical Analysis & Forecast by RoboForex

Japanese Candlesticks Analysis 05.07.2023 (EURUSD, USDJPY, EURGBP)

EURUSD, “Euro vs US Dollar”

EURUSD has formed an Engulfing reversal pattern by the support level on H4. Currently, the instrument is going by the reversal signal in an ascending wave. The growth target could be 1.0945. However, the price might correct to 1.0845 and continue the uptrend after the test of the support.

https://roboforex.com/uploads/roboforecast/roboforex_com/99/2023/Candles/july/05/EURUSDH4.png

Read more - Japanese Candlesticks Analysis EURUSD, USDJPY, EURGBP

Re: Forex Technical Analysis & Forecast by RoboForex

Murrey Math Lines 06.07.2023 (USDCHF, XAUUSD)

USDCHF, “US Dollar vs Swiss Franc”

USDCHF are under the 200-day Moving Average on H4, revealing a prevailing downtrend. The RSI is testing the resistance line. In this situation, a downward breakout of 2/8 (0.8972) is expected, followed by a decline to the support at 0/8 (0.8911). The scenario can be cancelled by rising above the resistance at 3/8 (0.9002), which might lead to a trend reversal and a rise of the pair to 4/8 (0.9033).

https://roboforex.com/uploads/roboforecast/roboforex_com/99/2023/Murrey/july/06/1.png

Read more - Murrey Math Lines USDCHF, XAUUSD

Re: Forex Technical Analysis & Forecast by RoboForex

Japanese Candlesticks Analysis 07.07.2023 (USDCAD, AUDUSD, USDCHF)

USDCAD, “US Dollar vs Canadian Dollar”

USDCAD has formed a Hanging Man reversal pattern on H4. Currently, the instrument could go by the reversal signal in a descending wave. The correction target might be 1.3300. Next, the price could break the level and go further by the downtrend. However, the quotes might rise to 1.3440 without correcting to the support.

https://roboforex.com/uploads/roboforecast/roboforex_com/99/2023/Candles/july/07/USDCADH4.png

Read more - Japanese Candlesticks Analysis USDCAD, AUDUSD, USDCHF

Re: Forex Technical Analysis & Forecast by RoboForex

Ichimoku Cloud Analysis 10.07.2023 (EURUSD, AUDUSD, USDJPY)

EURUSD, “Euro vs US Dollar”

EURUSD has secured above the upper border of the Wedge reversal pattern. The instrument is going above the Ichimoku Cloud, which suggests an uptrend. A test of the upper border of the Cloud at 1.0905 is expected, followed by a rise to 1.1090. An additional signal confirming the rise will be a rebound from the lower border of the bullish channel. The scenario can be cancelled by a break of the lower border of the Cloud with the price securing under 1.0855, which will mean a further decline to 1.0765.

https://roboforex.com/uploads/roboforecast/roboforex_com/99/2023/Ichimoku/july/10/eurusd.png

Read more - Ichimoku Cloud Analysis EURUSD, AUDUSD, USDJPY

Re: Forex Technical Analysis & Forecast by RoboForex

Murrey Math Lines 11.07.2023 (AUDUSD, NZDUSD)

AUDUSD, “Australian Dollar vs US Dollar”

AUDUSD quotes on H4 have broken the 200-day Moving Average and are now above it, indicating the possible development of an uptrend. The RSI is approaching the resistance line. In this situation, a test of 6/8 (0.6713) is expected, followed by a breakout and a price rise to the resistance at 7/8 (0.6774). The scenario can be cancelled by a downward breakout of 5/8 (0.6652). In this case, the pair could drop to the support level of 4/8 (0.6591).

https://roboforex.com/uploads/roboforecast/roboforex_com/99/2023/Murrey/july/11/1.png

Read more - Murrey Math Lines AUDUSD, NZDUSD

Re: Forex Technical Analysis & Forecast by RoboForex

Japanese Candlesticks Analysis 12.07.2023 (USDCAD, AUDUSD, USDCHF)

USDCAD, “US Dollar vs Canadian Dollar”

USDCAD has formed a Hammer reversal pattern on H4. Currently, the instrument might go by the reversal signal in an ascending wave. The correction target could be 1.3260. Next, the price could rebound from it and continue the downtrend. However, the quotes might drop to 1.3170 without any correction to the support.

https://roboforex.com/uploads/roboforecast/roboforex_com/99/2023/Candles/july/12/USDCADH4.png

Read more - Japanese Candlesticks Analysis USDCAD, AUDUSD, USDCHF

Re: Forex Technical Analysis & Forecast by RoboForex

Murrey Math Lines 13.07.2023 (USDCHF, XAUUSD)

USDCHF, “US Dollar vs Swiss Franc”

USDCHF quotes on H4 and the RSI are in their oversold areas. In these circumstances, the instrument is expected to rise above -1/8 (0.8667) and advance to the resistance level of 0/8 (0.8789). The scenario can be cancelled by a downward breakout of the support at -2/8 (0.8544), which could cause a reshuffling of Murray lines, after which new decline targets can be set.

https://roboforex.com/uploads/roboforecast/roboforex_com/99/2023/Murrey/july/13/1.png

Read more - Murrey Math Lines USDCHF, XAUUSD

Re: Forex Technical Analysis & Forecast by RoboForex

Japanese Candlesticks Analysis 14.07.2023 (XAUUSD, NZDUSD, GBPUSD)

XAUUSD, “Gold vs US Dollar”

Gold has formed a Hanging Man reversal pattern near the resistance level. Currently, the instrument is going by the reversal signal in a corrective wave. The pullback target could be 1950.00. After a test of the support level, the price might rebound from it and continue the uptrend. However, the quotes could rise to 1972.00 without correcting.

https://roboforex.com/uploads/roboforecast/roboforex_com/99/2023/Candles/july/14/XAUUSDH4.png

Read more - Japanese Candlesticks Analysis XAUUSD, NZDUSD, GBPUSD

Re: Forex Technical Analysis & Forecast by RoboForex

Ichimoku Cloud Analysis 17.07.2023 (GBPUSD, XAUUSD, NZDUSD)

GBPUSD, “Great Britain Pound vs US Dollar”

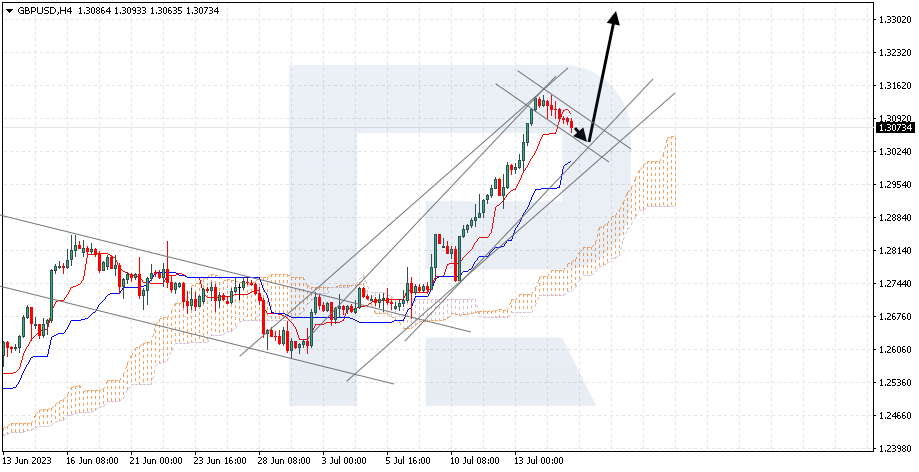
GBPUSD is correcting, forming a bullish Flag pattern. The instrument is going above the Ichimoku Cloud, which suggests an uptrend. A test of the Kijun-Sen line at 1.3040 is expected, followed by a rise to 1.3305. An additional signal confirming the rise will be a rebound from the lower boundary of the bullish channel. The scenario can be cancelled by a breakout of the lower boundary of the Cloud with the price securing under 1.2745, which will mean a further decline to 1.2655. Meanwhile, the growth could be confirmed by a breakout of the upper boundary of the bullish Flag pattern with the price securing above 1.3115.

https://roboforex.com/uploads/roboforecast/roboforex_com/99/2023/Ichimoku/july/17/gbpusd.png

Read more - Ichimoku Cloud Analysis GBPUSD, XAUUSD, NZDUSD

Re: Forex Technical Analysis & Forecast by RoboForex

Murrey Math Lines 18.07.2023 (AUDUSD, NZDUSD)

AUDUSD, “Australian Dollar vs US Dollar”

AUDUSD quotes are above the 200-day Moving Average on H4, revealing the prevalence of an uptrend. The RSI is testing the support line. In these circumstances, the price is expected to break the 8/8 (0.6835) level and continue growing to the resistance level of +2/8 (0.6658). The scenario can be cancelled by a downward breakout of 7/8 (0.6774). In this case, the pair might fall to the support at 6/8 (0.6713).

https://roboforex.com/uploads/roboforecast/roboforex_com/99/2023/Murrey/july/18/1.png

Read more - Murrey Math Lines AUDUSD, NZDUSD

Re: Forex Technical Analysis & Forecast by RoboForex

Technical Analysis & Forecast 19.07.2023

EURUSD, “Euro vs US Dollar”

The currency pair continues developing a consolidation range around 1.1242. Currently, the range has expanded upwards to 1.1275, and an impulse of decline to 1.1208 has formed. A link of growth to 1.1242 is expected today with a test from below. Next, a decline to 1.1200 might follow. And with a breakout of this level downwards, the potential for a wave of decline to 1.1128 could open. This is the first target.

https://roboforex.com/uploads/roboforecast/roboforex_com/99/2023/TA/july/19/EURUSDH1.png

Read more - Technical Analysis & Forecast 19.07.2023

Re: Forex Technical Analysis & Forecast by RoboForex

Ichimoku Cloud Analysis 20.07.2023 (EURUSD, USDCAD, AUDUSD)

EURUSD, “Euro vs US Dollar”

EURUSD is pushing off the signal lines of the indicator. The instrument is going above the Ichimoku Cloud, which suggests an uptrend. A test of the upper boundary of the Cloud at 1.1165 is expected, followed by a rise to 1.1375. An additional signal confirming the rise will be a rebound from the lower boundary of the ascending channel. The scenario can be cancelled by a breakout of the lower boundary of the Cloud with the price securing under 1.1055, which will mean a further decline to 1.0965. Meanwhile, the growth could be confirmed by a breakout of the upper boundary of the descending channel with the price securing above 1.1235.

https://roboforex.com/uploads/roboforecast/roboforex_com/99/2023/Ichimoku/july/20/eurusd.png

Read more - Ichimoku Cloud Analysis EURUSD, USDCAD, AUDUSD

Re: Forex Technical Analysis & Forecast by RoboForex

Japanese Candlesticks Analysis 21.07.2023 (EURUSD, USDJPY, EURGBP)

EURUSD, “Euro vs US Dollar”

EURUSD has formed a Harami reversal pattern near the support level on H4. Currently, the instrument might go by the reversal signal in an ascending wave. The growth target could be the resistance at 1.1220. However, the price might correct to 1.1085 and continue the uptrend after the pullback.

https://roboforex.com/uploads/roboforecast/roboforex_com/99/2023/Candles/july/21/EURUSDH4.png

Read more - Japanese Candlesticks Analysis EURUSD, USDJPY, EURGBP

Re: Forex Technical Analysis & Forecast by RoboForex

Ichimoku Cloud Analysis 24.07.2023 (EURUSD, AUDUSD, USDJPY)

EURUSD, “Euro vs US Dollar”

EURUSD is rebounding from the Tenkan-Sen line. The instrument is going inside the Ichimoku Cloud, which suggests a flat. A test of the lower boundary of the Cloud at 1.1085 is expected, followed by a rise to 1.1335. An additional signal confirming the rise will be a rebound from the lower boundary of the bullish channel. The scenario can be cancelled by a breakout of the lower boundary of the Cloud with the price securing under 1.1015, which will mean a further decline to 1.0925. Meanwhile, the growth could be confirmed by a breakout of the upper boundary of the descending channel with the price securing above 1.1195.

https://roboforex.com/uploads/roboforecast/roboforex_com/99/2023/Ichimoku/july/24/eurusd.png

Read more - Ichimoku Cloud Analysis EURUSD, AUDUSD, USDJPY

Re: Forex Technical Analysis & Forecast by RoboForex

Murrey Math Lines 25.07.2023 (AUDUSD, NZDUSD)

AUDUSD, “Australian Dollar vs US Dollar”

AUDUSD quotes are above the 200-day Moving Average on H4, indicating the prevalence of an uptrend. The RSI has broken the resistance line. In these circumstances, the quotes are expected to break the 7/8 (0.6774) level, reaching the resistance at 8/8 (0.6835). The scenario can be cancelled by a downward breakout of 6/8 (0.6713), which might lead to a trend reversal and a decline to the support at 5/8 (0.6652).

https://roboforex.com/uploads/roboforecast/roboforex_com/99/2023/Murrey/july/25/1.png

Read more - Murrey Math Lines AUDUSD, NZDUSD

Re: Forex Technical Analysis & Forecast by RoboForex

Technical Analysis & Forecast 26.07.2023

EURUSD, “Euro vs US Dollar”

EURUSD has reached the local target of a declining wave at 1.1020. The market is consolidating above this level today. A link of growth to 1.1070 is expected to develop, followed by a drop to 1.1046. Next, the pair could rise to 1.1100, from where the correction might expand to 1.1125 (with a test from below). When it is over, a new wave of decline to 1.0977 could start. This is the first target.

https://roboforex.com/uploads/roboforecast/roboforex_com/99/2023/TA/july/26/EURUSDH1.png

Read more - Technical Analysis & Forecast 26.07.2023

Re: Forex Technical Analysis & Forecast by RoboForex

Murrey Math Lines 27.07.2023 (USDCHF, XAUUSD)

USDCHF, “US Dollar vs Swiss Franc”

USDCHF quotes are in the oversold area on H4. The RSI is nearing the oversold area. In this situation, a test of -2/8 (0.8544) is expected, followed by a rebound from this level and a rise to the resistance at -1/8 (0.8667). The scenario can be cancelled by a downward breakout of the support at -2/8 (0.8544), which will reshuffle the Murray indication so that a new price target will be set.

https://roboforex.com/uploads/roboforecast/roboforex_com/99/2023/Murrey/july/27/1.png

Read more - Murrey Math Lines USDCHF, XAUUSD

Re: Forex Technical Analysis & Forecast by RoboForex

Japanese Candlesticks Analysis 28.07.2023 (USDCAD, AUDUSD, USDCHF)

USDCAD, “US Dollar vs Canadian Dollar”

USDCAD quotes have formed a Hanging Man reversal pattern on H4. Currently, the instrument could go by the reversal signal in a descending wave. The decline target might be 1.3130. Next, the price could break the support level and continue the downtrend. However, the quotes might correct to 1.3275 before the decline.

https://roboforex.com/uploads/roboforecast/roboforex_com/99/2023/Candles/july/28/USDCADH4.png

Read more - Japanese Candlesticks Analysis USDCAD, AUDUSD, USDCHF

Re: Forex Technical Analysis & Forecast by RoboForex

Technical Analysis & Forecast 31.07.2023

EURUSD, “Euro vs US Dollar”

EURUSD has completed the first corrective target at the 1.1046 level. Today a link of decline to the 1.0992 level might develop. After the price reaches this level, another structure of growth to 1.1035 could follow. An upward breakout of this level will open the potential for the structure development to the 1.1077 level with the prospect of trend continuation to 1.1122.

https://roboforex.com/uploads/roboforecast/roboforex_com/99/2023/TA/july/31/EURUSDH1.png

Read more - Technical Analysis & Forecast 31.07.2023

Re: Forex Technical Analysis & Forecast by RoboForex

Murrey Math Lines 01.08.2023 (AUDUSD, NZDUSD)

AUDUSD, “Australian Dollar vs US Dollar”

AUDUSD quotes are below the 200-day Moving Average on H4, indicating a prevailing downtrend. The RSI is testing the support line. In these circumstances, a downward breakout of the 5/8 (0.6652) level is expected, followed by a decline to the support level at 4/8 (0.6591). The scenario can be cancelled by a breakout of the resistance at 6/8 (0.6713). In this case, the quotes could rise to 7/8 (0.6774).

https://roboforex.com/uploads/roboforecast/roboforex_com/99/2023/Murrey/august/01/1.png

Read more - Murrey Math Lines AUDUSD, NZDUSD

Re: Forex Technical Analysis & Forecast by RoboForex

Technical Analysis & Forecast 02.08.2023

EURUSD, “Euro vs US Dollar”

EURUSD has completed a wave of decline to the 1.0955 level and a link of correction to the 1.1018 level. Today another link of decline to 1.0950 could develop. A wide consolidation range is forming around 1.0999. With an upward breakout, a correction could continue to the 1.1122 level. A downward breakout could open the potential for trend continuation to the 1.0888 level.

https://roboforex.com/uploads/roboforecast/roboforex_com/99/2023/TA/august/01/EURUSDH1.png

Read more - Technical Analysis & Forecast 02.08.2023

Re: Forex Technical Analysis & Forecast by RoboForex

Murrey Math Lines 03.08.2023 (USDCHF, XAUUSD)

USDCHF, “US Dollar vs Swiss Franc”

USDCHF quotes are in the oversold area on H4. The RSI has rebounded from the support line. In this situation, the price is expected to break the 0/8 (0.8789) level and rise to the resistance at 1/8 (0.8911). The scenario can be cancelled by a downward breakout of the support at -1/8 (0.8667). In this case, the pair could return to -2/8 (0.8544).

https://roboforex.com/uploads/roboforecast/roboforex_com/99/2023/Murrey/august/03/1.png

Read more - Murrey Math Lines USDCHF, XAUUSD

Re: Forex Technical Analysis & Forecast by RoboForex

Japanese Candlesticks Analysis 04.08.2023 (XAUUSD, NZDUSD, GBPUSD)

XAUUSD, “Gold vs US Dollar”

Gold has formed a Hammer reversal pattern near the support level. Currently, the instrument is going by the reversal signal in an ascending wave. The growth target might be 1955.00. Upon testing the resistance, the price might break it and continue the uptrend. However, the quotes could pull back to 1925.00 before rising.

https://roboforex.com/uploads/roboforecast/roboforex_com/99/2023/Candles/august/04/XAUUSDH4.png

Read more - Japanese Candlesticks Analysis XAUUSD, NZDUSD, GBPUSD

Re: Forex Technical Analysis & Forecast by RoboForex

Technical Analysis & Forecast 07.08.2023

EURUSD, “Euro vs US Dollar”

EURUSD has completed a correction at the 1.1040 level and started to develop another wave of decline. Today an impulse of decline to 1.1007 has been completed. A consolidation range has formed around this level. Breaking it down, the price continues to decline to the 1.0970 level. This is the first target. Once the price hits this level, a link of growth to 1.1000 (a test from below) is expected to form, followed by a decline to 1.0940 with the prospect of trend continuation to 1.0880.

https://roboforex.com/uploads/roboforecast/roboforex_com/99/2023/TA/august/07/EURUSDH1.png

Read more - Technical Analysis & Forecast 07.08.2023

Re: Forex Technical Analysis & Forecast by RoboForex

Murrey Math Lines 07.08.2023 (EURUSD, GBPUSD)

EURUSD, “Euro vs US Dollar”

EURUSD quotes have broken the 200-day Moving Average on H4 and are now below it, which indicates a potential downtrend. The RSI has rebounded from the resistance line. In this situation, a downward breakout of the support at 4/8 (1.0986) is expected, followed by a decline to the level of 2/8 (1.0864). The scenario can be cancelled by a breakout of the resistance at 5/8 (1.1074). In this case, the pair could rise to 6/8 (1.1108).

https://roboforex.com/uploads/roboforecast/roboforex_com/99/2023/Murrey/august/07/1.png

Read more - Murrey Math Lines EURUSD, GBPUSD

Posts: 951 to 975 of 1,099

Pages Previous 1 37 38 39 40 41 44 Next

You must login or register to post a reply

Forex Software → Market Analysis → Forex Technical Analysis & Forecast by RoboForex

Similar topics in this forum