Topic: Straighter equity curve?

Have been trialing fsb, wow very fast.  Just interested if anyone gets equity curves like this with a strong curve initially then tailing off, I get a lot of these using last 10 years of data.  Wondering if there is a set of search parameters that helps 'linearise' the curve to be more consistent.  I noted adding a preset indicator such as long term momentum helps to keep models in right direction but still get a lot of these curves.
https://s8.postimg.cc/lic6qcqup/fsb_equity.jpg

Re: Straighter equity curve?

Read: https://forexsb.com/forum/topic/7276/balance-line-deviation-incorrect/

Basically we are waiting that Popov implements the balance line deviation with the "correct" method of correlation coefficient, then this filter will work much better. For now you´d just manually sort out such strategies (I do too and generate on 32 years of data actually (H4)).

Those kind of curves, if you get them a lot even with different indicators, point out to that the underlying symbol has changed it´s "patterns" a lot (which unfortunately is the case for most symbols especially in the last 2 years and especially this year). USDJPY is one of the symbols where patterns still seem to last and you get much better and straight curves overall. Then there are symbols like AUDCAD where almost all systems decend in the last 2 years (e.g. "patterns" on these pairs have changed a lot the last years compared to before).

Good luck.

3 (edited by sleytus 2018-07-28 08:18:15)

Re: Straighter equity curve?

I like geektrader's explanation -- though I wouldn't go along with using 32 years (or even 10 years) of historical data to optimize a strategy.

A strategy is an algebraic formula with a handful of constants.  The constants get computed once and are then fixed.  This is not AI (artificial intelligence) -- so, the strategy does not "learn" by inputting more data.

During optimization all data points are created equal -- that is, Popov's optimization algorithm doesn't distinguish between old data and new data.  On the other hand, when it comes to real trading all that matters is today's patterns -- what happened 10 years ago doesn't matter.  Yet, when you use 10 years of historical data then new data patterns get masked and the strategy's fixed constants are computed to best accommodate old data since it constitutes the majority of your data horizon.

Take a look at your curve -- as it progresses from right-to-left performance degrades.  This is because those fixed constants (that were computed using old data) continuously fit less well to newer data (which makes up less of your data horizon).  So, of course, curves have a tendency to tail-off over time.

geektrader points out that data patterns change -- and I think this is a critical observation.  I've had better luck trading in real accounts when I optimize using a recent data horizon -- though you also need a minimum number of trades (I'm guessing around 250 or so).

That patterns for some symbols (e.g. USDJPY) seem to last longer is very interesting.  Definitely something to investigate further.

By the way, performance curves that tail-off over time are not unique to forex -- they occur in a variety of experimental systems where algorithms are used to compute the best-fitting curve.  These types of curves indicate (a) that data is changing, and (b) the algorithm doesn't take into account the changing data (since it treats all data points equally).

4 (edited by geektrader 2018-07-29 02:10:05)

Re: Straighter equity curve?

Sleytus: I never had luck to make money with any system that was generated below 32 years of data + 5 symbols where it is profitable completely OOS. I currently only trade systems that have a straight equity curve on these 32 years of H4 data (without the recent downwards-bending-slope we´ve just discussed) for the main symbol + at least have a return / dd ratio of 4 on at least 5 other unseen symbols on 32 years of H4 data (out of a pool of 28 symbols that it can use to find those 5 where it might work). So basically my systems, before they go live, have passed 192 combined years of backtests and 160 years of these completely OOS with at least a 4 return / dd ratio.

EA Studio finds surprisingly many of those that work massively good on multi-symbols, better than any other platform I have used over the years. But if the short-term optimization makes you money, more power to you :-) Which TF / data-horizon are you using for your systems that make you constant money?

Re: Straighter equity curve?

geektrader -- thanks for engaging with me...

I do not have as much experience with forex as you -- about 1.5 years -- so, take what I say with a "grain of salt".  However, I do have a fair amount of experience analyzing data.

I do not have access to so many years of historical data and have never attempted to use more than a few years.  I have noticed the larger the data horizon then more time is spent optimizing and less generating.  Given a choice, I prefer to let FSB spend more time generating to see what interesting combinations of indicators it comes up with.

I've tried a variety of different symbols, but always come back to EURUSD.  Currently, my favorite setup is using EURUSD/H1.  I will use 4000 bars of the most recent data -- which works out to about 8 months.  And I will only pay attention to strategies with a minimum of 200 executed orders and a Win/Loss ration of >= 65%.  Prior to deploying I will back test using MT4 Strategy tester using the most recent 2000 bars.  The reason for this is two-fold: (a) Turns out the *.cs indicators used by FSB (and EA Studio) sometimes differ from the *.mq4 versions that get generated -- so, I like to do a "sanity" check, and (b) by using only 2000 bars then I have a better idea how the strategy performs under current market conditions.

I'm not advocating that everyone has to adopt this approach and I am not prepared to say that I make constant money.  But I do win more than I lose and as I continue to refine my approach then results improve.  My emphasis now is focusing on using the most recent data and, also, doing a better job of identifying and avoiding *over* curve-fitted strategies.

I know we disagree on a number of issues -- but I have a question for you and would be really interested to hear your response.  We both agree that data patterns change with time.  And I think we probably both agree that strategies are algebraic formulas with a few constant values that get computed once during optimization.  Why would you use data that is 32 years old to compute the constants for an algebraic formula that will be deployed tomorrow?  I mean, given the choice of computing those constants using 32 year-old data or 1 year-old data, wouldn't you opt for using more recent data?  When you use 32 years of data then roughly 3% of the data is new and 97% is old -- which means the resulting constants that are computed better fit old data patterns compared to new ones.  And this is what I have trouble understanding.

6 (edited by geektrader 2018-07-29 04:25:02)

Re: Straighter equity curve?

Great approach and thanks for sharing. Maths and assumptions do not really matter, if you make constant money with what you do, then this works and this is already all the advantage you´ll need, just increase lot sizes from there on and you should be happy ever after :-) I will surely test your approach too (actually did a few times but always failed).

The reason I am using so much data is that I think that all data matters. If analyzing the data in depth (which I do/did too), you´ll notice that there are repeating patterns *nowadays* that also have occurred like this back in 1993, 1998, etc. (obviously of course, since otherwise the system would not have a straight equity line). So giving the systems so much data will not hurt at all, especially if testing OOS over 5 completely different symbols after they´ve just been made for one symbol and they are profitable on these unknown symbols without having ever seen them, tells me that the systems I am trading do have very general patterns that exist amongst a large scale of symbols and hence have a very high chance to continue like this into the future and make me money (which they actually do). With the short-term approach I always had the problem of curve-fitting and systems dying sometimes REALLY quick, with these massive long term systems that work on so much data, not one has failed yet (all trade within their historical specs, so spoken) and chances are high they will continue to make money because they do not exploit just recent patterns, but very broad ones that always existed. And that´s what I like: stability with a steady income :-)

I also should have mentioned that I am trading portfolios of strategies for each symbol (via EA Studios portfolio expert). Here is my EURUSD H4 (1986 - now):

https://preview.ibb.co/iUMpw8/Untitled.jpg

USDJPY H4 (1986 - now):

https://preview.ibb.co/fojW9T/Untitled.jpg

Remember, each strategy within that portfolio has at least 2000 trades (think I didn´t mention that yet) so that it is statistically significant and has positive returns on at least 32 years of H4 data on 5 other, completely unknown symbols, apart from of course having passed the typical monte carlo tests. They trade 1 lot fixed each in my portfolios.

P.S.: I don´t think we need to discuss that everything is backtested in MT4 and compared to see if it trades the same as in EA Studio before I go live, that is just common sense, right? Glad you do it though, many people don´t and fail because of a technical issue with their EA - bad :-)

Re: Straighter equity curve?

Thanks guys, have been trading stocks for 10 years using strategies programmed in amibroker so used to data mining, of course finding it a little more challenging with forex, feel like gold mining right now for that 'nugget of gold'.  Anyway, I also wondering if data is changing over time & of course having fun dealing with my broker data vs history from Mt4.  I wondered if that has impact as broker data seems to only go back a few years then rest is MT4.  I am with Pepperstone so trying to download data from TrueFx & converting back so at least I know its genuine data.  So far finding only a few systems that a reasonably straight & even then (as my procedure is usually to test up to 2017 then retest 2018 which is then truly OOS from my modelling efforts) find systems often die off in 2018...will keep going!

Re: Straighter equity curve?

Hi geektrader,

How did you manage to get 32 years of data into ea studio? What tool did you use to get the data?

I’m also interested in getting straight line graph systems that worked for 32 years.

Re: Straighter equity curve?

engtraderfx wrote:

... feel like gold mining right now for that 'nugget of gold'...

Thanks for initiating this thread -- it brings up some interesting issues.
As for that nugget of gold, you may have better luck in the long run if you modify your expectations to "nuggets of bronze"...

geektrader wrote:

The reason I am using so much data is that I think that all data matters

Thanks very much for your detailed response -- it is interesting to read and informative.  If you don't mind, I'd like to continue this a bit further and understand more about your thinking and approach.  I have a few more questions.  Though I may pose them as comments, I'm hoping you will answer them as though they were questions.

I now understand your underlying premise is that data patterns repeat.  And they may -- I have no evidence they don't.  However, to justify using 32 years of historical data it seems in addition to assuming patterns repeat you would also need to assume they repeat uniformly throughout history.  Is that correct?

Thanks for sharing the balance curves and statistics -- it's interesting to me and I learn a lot when I can compare my results with others.  Your curves look very nice -- from a distance.  However, the win ratios are in the low 50's and the PF's are about 1.5 -- which is fine if you plan on trading a strategy for several years running.  If you were to zoom-in on one of the balance curves you would likely see many peaks and valleys -- and it could be some valleys last for weeks or months.  So my question -- if you were to take one of those strategies and back test it using a data horizon of the most recent 8 months and if it performed poorly would you still deploy it?  And, if so, why?

You know -- it just occurred to me another reason why our approaches differ.  I've totally bought into the philosophy that using your broker's data is critical and "refreshing" strategies from time-to-time with more recent data is important.  Your approach -- that uses so many years of historical data -- is you will build it once and never have to touch it again.  Would you say that is correct?  And, if so, does that mean you don't think using your broker's data is that important or that "refreshing" strategies offers any advantage?

My intent is not to be argumentative -- I'm just interested in learning more details because it helps me navigate the path toward solving the forex puzzle and confirm whether the direction I'm headed makes sense or I need to back up and go a different way.

10

Re: Straighter equity curve?

How did you manage to get 32 years of data into ea studio? What tool did you use to get the data?

It is technically possible to add 32 years of H4 data since the sistem accepts up to 200.000 bars of data. There are 525.600 minutes in a year, that means 2190 H4 bars per year, so in theory you could import 91 years of H4 data. Please go to Tools / Data import into your Expert Advisor Studio.

What really is puzzling me is how can you possibly import 32 years or EURUSD H4 data considering the Euro came to existence in 1999. That is truly black magic to me.


https://s8.postimg.cc/5j50n31o1/Screenshot_-_29_07_2018_13_16_27.png

11 (edited by hannahis 2018-07-29 13:29:34)

Re: Straighter equity curve?

mw wrote:

What really is puzzling me is how can you possibly import 32 years or EURUSD H4 data considering the Euro came to existence in 1999. That is truly black magic to me.


https://s8.postimg.cc/5j50n31o1/Screenshot_-_29_07_2018_13_16_27.png

LoL, truly black magic

The Euro is the new 'single currency' of the European Monetary Union, adopted on January 1, 1999 by 11 Member States. Greece became the 12th Member state to adopt the Euro on January 1, 2001. On January 1, 2002, these 12 countries officially introduced the Euro banknotes and coins as legal tender


PS: Geektrader: When you use 32 years data, what's your portion use for OOS? 50%? You use the Reactor for the walk foward and optimisation too?

12 (edited by sleytus 2018-07-29 17:19:07)

Re: Straighter equity curve?

I thought this thread started-off raising some interesting issues and I was learning from it.

But then it gets hijacked with discussion about how to load 32 years of data.  Really?  Is that what is most interesting to you guys?  This is why I've lost interest in this forum and don't follow it as much as I used to.  Rarely any serious discussions -- or, if one does begin, then it morphs into something unrelated that should have been raised in a separate "how to" thread.

DoCZero recently started an amazing thread where he shared test results that had required a lot of time, thought and preparation.  But "how to load 32 years of data" draws more attention.  Too boring for me...

13 (edited by geektrader 2018-07-30 06:20:03)

Re: Straighter equity curve?

I agree sleytus :-(

EURUSD data prior 1999 is black magic just like H4 importing I guess. If you guys would just do a little Google search about professional EURUSD data prior 1999 (from a seller like Olsen Data), you´d have seen this:

"Historically, the Euro-Dollar Exchange Rate - EUR/USD reached an all-time high of 1.87 in July of 1973 and a record low of 0.70 in February of 1985. The euro was only introduced as a currency on the first of January of 1999. However, synthetic historical prices going back much further can be modeled if we consider a weighted average of the previous currencies like DEMUSD, etc."

14 (edited by hannahis 2018-07-30 06:57:05)

Re: Straighter equity curve?

geektrader wrote:

"Historically, the Euro-Dollar Exchange Rate - EUR/USD reached an all-time high of 1.87 in July of 1973 and a record low of 0.70 in February of 1985. The euro was only introduced as a currency on the first of January of 1999. However, synthetic historical prices going back much further can be modeled if we consider a weighted average of the previous currencies like DEMUSD, etc."

Hi Geektrader,

So any EURUSD data prior 1999 is Synthetic historical, why then would you consider this section of the data to be "realistic" comparison with EURUSD?  The speculative nature is different and EUR is a far bigger market than a single economy.  Have you tried from 1999 till now, would it yield better or more "accurate" results?

Anyway, it's just a comment.  As long as it worked for you, it surely has some value to it. 


Lastly, guys please don't be so serious...give room for people to divert into some sub topics within this main topics.  The main topic is about straighter equity curve in general and you both managed to divert into something related and about your method of using 32 years data vs using more current data (isn't that a kind of diversion too?, anyone complain? No, cos in any normal conversation, we often open up new topics within the same train of thoughts.  Likewise if others want to know why and how could it be 32 years when it started in 1999, such questions (joking) shouldn't have easily offend you guys?  If all of us have to research further to find out more, then what's the point of the forum to raise some questions if we have to search out all the time the questions on our own?

Some topics may be basic and simple (boring to some) but bear in mind, we are all at different stage of our learning experience, please bear with one another if we want to create a vibrant and engaging discussion here that can cater to all level of users.  Who dare to post questions here, if one has to consider whether or not their topic is interesting enough for all to read (both new and experienced users), who dare to ask any questions, only to be told why don't you research further?  Isn't we here to learn from one another?  I've learned much here from the discussion, so if we don't have any to get our of this forum, we quit?  Aren't we once newbies too? Didn't we once count on others kindness to show us the ropes?  It's about paying it forward.

15 (edited by sleytus 2018-07-30 07:15:19)

Re: Straighter equity curve?

Hannah,

The problem is that it never progresses to a "vibrant and engaging discussion".  The topic was "Straighter Equity Curve?" -- right?  When someone then asks how to load some data it kills the thread because that becomes the last post and that is what people see when they click on the link.  You've been around the forum long enough to know how it works and you've also observed that not much interesting goes on.  That's because people are (a) lazy, and (b) want to say something even when they have nothing to add or don't have any good questions.  Also, there are only a handful of people who take the time to do their own testing and share results -- you've mentioned that before yourself.

geektrader has a lot of experience trading and I was really interested to learn more.  I've contributed a lot and feel I'm entitled to learn more.  But it is impossible here.

Popov has spent a huge amount of time preparing documentation and videos.  You won't find any other software product where someone has gone to such lengths to document a piece of software like this.  But people are too lazy to figure things out themselves -- which is not a good quality if you seriously wish to succeed at forex.

Again -- this thread has morphed -- from "Straighter equity curve", to "loading data", to "interesting topics turning into boring ones".  If I want to learn more from geektrader and gain additional insight I guess I'll have to PM him and hope he responds.

I'm done with this thread.  You guys can now go back to discussing the origins of EURUSD and how to load data into EA Studio...

16 (edited by hannahis 2018-07-30 08:06:40)

Re: Straighter equity curve?

I believe Geektrader, if he want to post more, he will and if he doesn't want to, even if the last post was addressed to him, he won't even bother to reply if he doesn't want to.  I don't think anyone could deter or dictate his posting.  He is a very experience trader and I noticed he comes and go anytime he wishes and he has much to give and share if he wants (to build up this community, then we are very honored to have him but if he choose to come here only if it benefit him, then it's also his prerogative, as much as yours ). 

You are one of the users who contribution extensively and thus you won my deep respect.  I know you have good forum ethics such as trying not to hijack a topic.  But not everyone knows of this "unspoken" rules.   

Yes, I've been here a long time to bear with many kinds of users.  Though I do wish some are more tolerance of others and we have the space to chill and chat too and joke around (without personal attack).  And yes, I do at times, feel there isn't much discussion here and hence, the last thing, I want, is to see new comers feel unwelcome or worried whether they posted wrongly in the wrong chat, etc  cos who knows, one day such new comers are going to be a strong contributor too.

I also understand that people are capable of tracking the thread and won't be affected by the "last" post.  People have the tendency to pick what interest them, they are not dictated by what's the last post.

I hold you and Geektrader in high regard and we have much to learn from you both and if you think this forum isn't worthy of your time, then I've nothing to say.  I wanted to quit at times too but I still stayed on because I think we can still make this a better place for learning and supporting one another.


Now Geektrader, back to you...(I know you are a busy person and if you want to reply, then kindly enlighten us with your extensive experience, surely you aren't a person who is so easily bruised in your ego)

1. When you use 32 years historical data, how much do you select for OOS% or do you use the entire 32 years data as your IS?

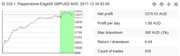
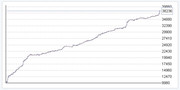
2. I saw the graph you posted, it has very high monthly returns (wow, impressive) are these just backtesting results or do you experience the same outcome also in your live results, i.e. what you see (in the backtesting results) is also reflected in your live trading?  I used to think it is "redundant" to use such long historical data but your stats are impressive enough to make me have second thoughts. 

3.

geektrader wrote:

So basically my systems, before they go live, have passed 192 combined years of backtests and 160 years of these completely OOS with at least a 4 return / dd ratio.

  this statement gave tremendous credit and no wonder your systems are good. 

So the question is, what's the % of these strategies failed in live trading?  i.e. these strategies that passed your extensive testing before live, how many % of these continue to do well in live trading? 100%?


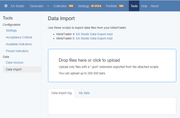
3. When you use EA Studio, do you use the 32 years data for Generating only or you also use the Reactor (with optimization? Walk forward? how many segment?) in another words, what would you recommend as a successful workflow/settings?

In the nutshell, is there any particular workflow that you think will offer higher successful rate when using EA Studio?  Bear with me, I only switched over to use EA Studio recently, about 2mth ago.  And I also noticed that EA Studio yield rather good results (what puzzled me most is to examine the rules and find the them somehow odd, something that I won't be using for manual trading, against conventional rules, ie. buy when indicator is falling instead of rising).

17

Re: Straighter equity curve?

Dear Sleytus,

With all due respect, I honestly believe no one has tried to hijack the discussion as you claim. I simply saw someone asking a question and tried to help as a matter of elementary politeness, nothing else. I also believe that the person who asked this had a genuine interest in the discussion that was going on, and simply asked about the procedure so he/she could perform the tests you were discussing.

As for my comment about the 32 years of EURUSD, I have to admit I didn't know about there was synthetic history available (although I'm not sure about its effectiveness). Considering such lack of knowledge I expressed my surprise of seeing a chart with a big amount of what I thought it was non-existent data. Again, my intention was never to insult or distract anyone from the original discussion.

I have read many of your posts, and I believe you are truly commited to master this amazing discipline. I also believe most people around here share that same drive. That's why I believe it is very unfair from your part to characterize everyone as lazy or having nothing to say.

Having said that, I offer you my honest apologies and hope you don't withdraw yourself from the discussions, because I do truly believe your input is very valuable and I'm convinced that altogether can turn things into a vibrant and engaging discussion, like Hannah says.

With best regards,

mw

Re: Straighter equity curve?

ok, with a bit of work I can manage to get better curve, mainly allowing the generator to have looser criteria (all in-sample) to feed into the optimiser which uses tighter ISS / OSS criteria, so I can see how it gets better. 

However the next issue is data...tried using TrueFX data using Tick Data Suite & testing via tick data as supposed to be feed for Pepperstone but when I switch back to Pepperstone broker MT4 data changes a lot, so back to square 1! That's topic for another post.

https://s8.postimg.cc/shvdy1rap/Capture.jpg