---
Hello!
I understand your frustration with inconsistent results when testing new data. From what you described, it appears that your strategy may be over-adjusted to historical data, which causes it to perform poorly in previously unseen market conditions. I'll share how I usually approach creating and validating strategies to avoid these types of problems.
1. **Acceptance Criteria:** I use strict acceptance criteria that include a minimum rate of return per period, a maximum acceptable drawdown, and other performance criteria such as the recovery factor. This helps me ensure the strategy is robust and can withstand different market conditions.
2. **TimeFrame:** I vary the timeframe depending on the nature of the strategy, but I generally use 1-hour (H1) or daily (D1) data. This provides a good balance between trading frequency and sensitivity to market noise.
3. **Data Bars / Date Range:** I typically use around 250,000 data bars to develop the strategy. For example, this could cover a period from 2008 to 2016. It is important not to validate the results in 'Walk Forward' with the same data set so as not to introduce bias.
4. **Predefined Indicators:** I tend to use indicators that do not fit the data too much. Preferably, "broader" indicators such as the simple moving average, RSI, and MACD. This helps ensure that the strategy is not just capturing specific anomalies in the data set.
5. **Strategy Settings:** I always go for validation using the Monte Carlo Method and adjusting the simulator to test the robustness of the strategy in different types of market conditions. Then, I validate with a new set of data from the period following the original, from 2016 to the current date.
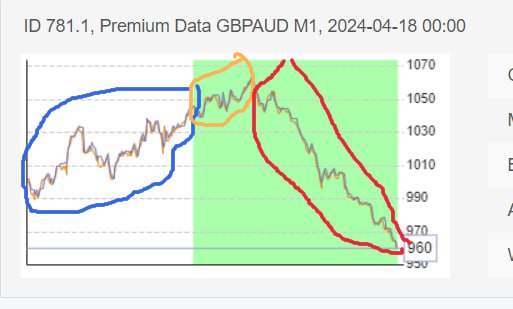
If you are seeing good results initially on new data but then experience declines, it could be a matter of overfitting or perhaps the strategy is not well adapted to more recent changes in market behavior. I suggest reviewing whether the indicators and entry conditions are truly aligned with the long-term characteristics of the market and not just particularities of the previous data set.
I hope these tips help improve the robustness of your strategies. Good luck!
---
