Re: Forex Technical Analysis & Forecast by RoboForex
Murrey Math Lines 12.04.2022 (AUDUSD, NZDUSD)
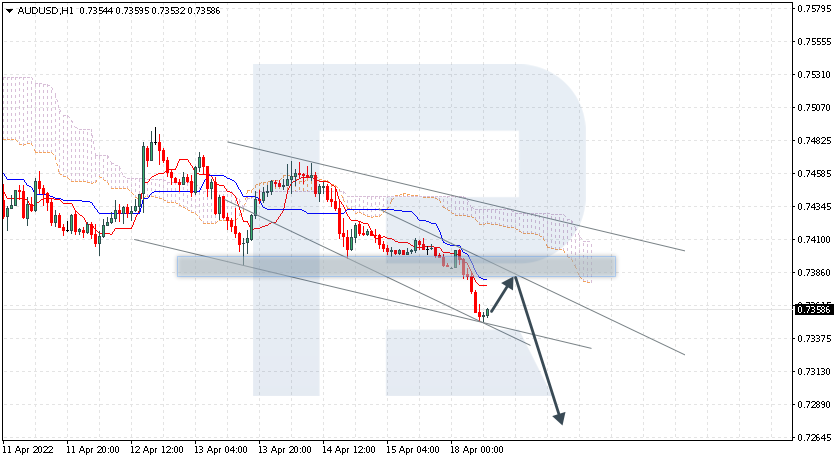
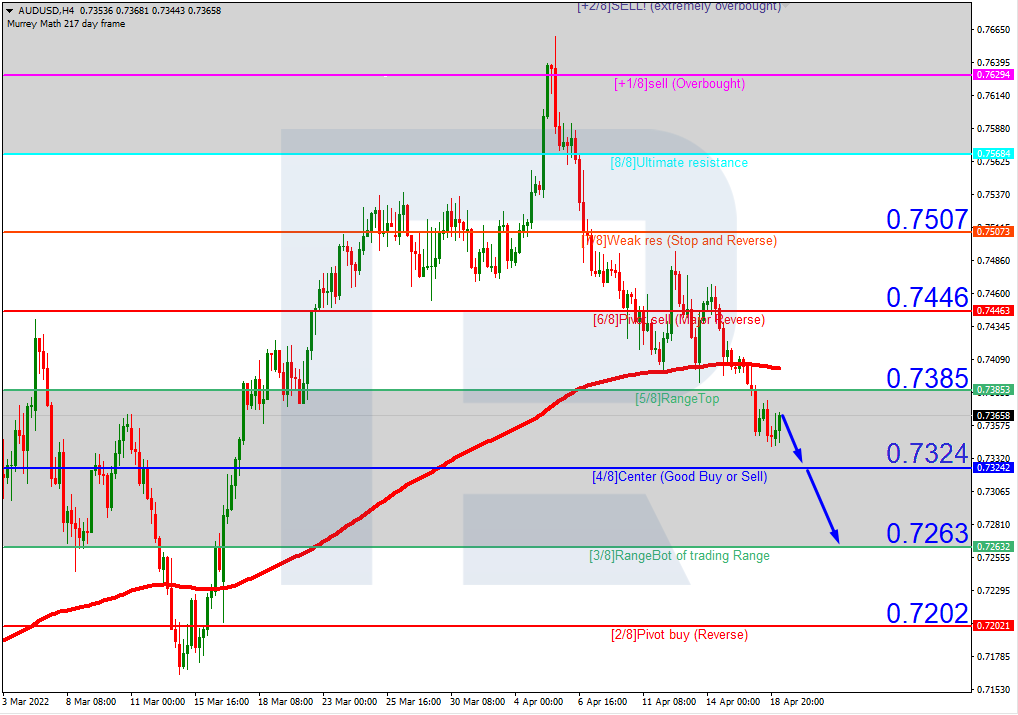
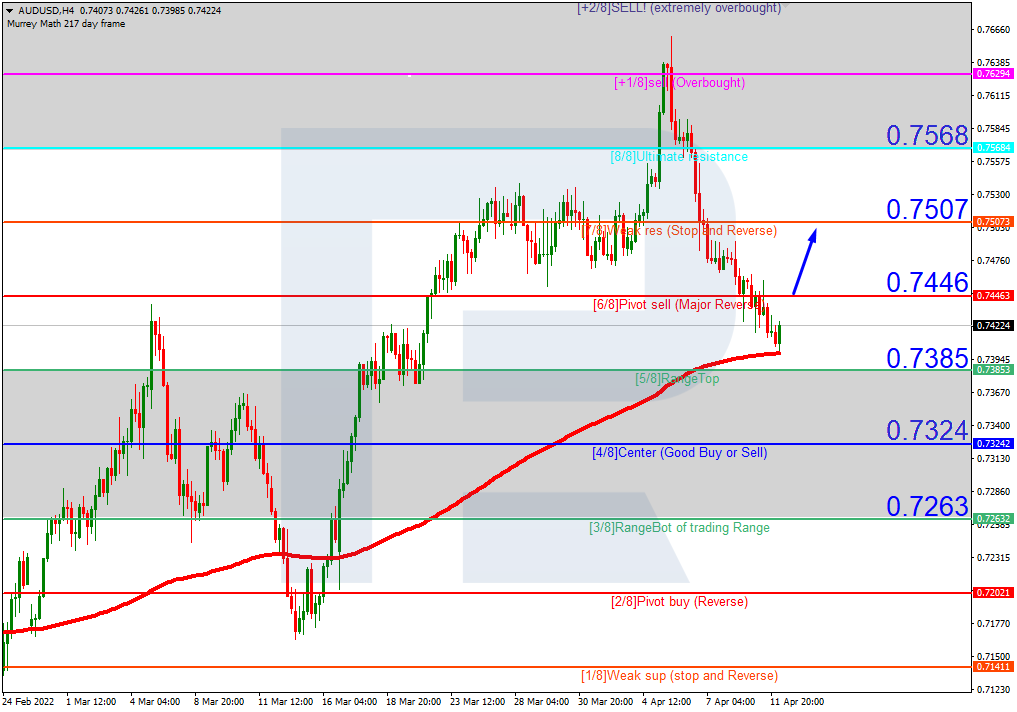
AUDUSD, “Australian Dollar vs US Dollar”
As we can see in the H4 chart, AUDUSD is trading above the 200-day Moving Average to indicate an ascending tendency. In this case, the price is expected to test 6/8, break it, and then continue growing to reach the resistance at 7/8. However, this scenario may no longer be valid if the price breaks the support at 5/8 to the downside. After that, the instrument may reverse and fall towards 4/8.
Read more - Murrey Math Lines AUDUSD, NZDUSD