forex software

Create and Test Forex Strategies

forex software

Skip to forum content

Forex Software

Create and Test Forex Strategies

You are not logged in. Please login or register.


(Page 28 of 44)

Forex Software → Market Analysis → Forex Technical Analysis & Forecast by RoboForex

Pages Previous 1 26 27 28 29 30 44 Next

You must login or register to post a reply

RSS topic feed

Posts: 676 to 700 of 1,098

Re: Forex Technical Analysis & Forecast by RoboForex

Murrey Math Lines 24.05.2022 (AUDUSD, NZDUSD)

AUDUSD, “Australian Dollar vs US Dollar”

As we can see in the H4 chart, AUDUSD is trading below the 200-day Moving Average to indicate a descending tendency. In this case, the price is expected to break 2/8 and then continue falling to reach the support at 1/8. However, this scenario may no longer be valid if the price breaks the resistance at 3/8 to the upside. After that, the instrument may reverse and grow towards 4/8.

https://roboforex.com/uploads/roboforecast/roboforex.com/99/2022/Murrey/may/24/1.png

Read more - Murrey Math Lines AUDUSD, NZDUSD

Re: Forex Technical Analysis & Forecast by RoboForex

Murrey Math Lines 25.05.2022 (USDJPY, USDCAD)

USDJPY, “US Dollar vs. Japanese Yen”

In the H4 chart, after breaking the 200-day Moving Average, USDJPY is trading below it to indicate a possible descending tendency. In this case, the price is expected to break 1/8 and then continue falling to reach the support at 0/8. However, this scenario may no longer be valid if the price breaks the resistance at 2/8 to the upside. After that, the instrument may reverse and move towards 4/8.

https://roboforex.com/uploads/roboforecast/roboforex.com/99/2022/Murrey/may/25/1.png

Read more - Murrey Math Lines USDJPY, USDCAD

Re: Forex Technical Analysis & Forecast by RoboForex

Forex Technical Analysis & Forecast 26.05.2022

EURUSD, “Euro vs US Dollar”

After finishing the descending impulse at 1.0643 along with the correction up to 1.0705, EURUSD is forming a new descending structure to break 1.0640 and may later continue trading downwards with the short-term target at 1.0575.

https://roboforex.com/uploads/roboforecast/roboforex.com/99/2022/TA/may/26/EURUSDH1.png

Read more - Forex Technical Analysis & Forecast 26.05.2022

Re: Forex Technical Analysis & Forecast by RoboForex

Japanese Candlesticks Analysis 27.05.2022 (XAUUSD, NZDUSD, GBPUSD)

XAUUSD, “Gold vs US Dollar”

As we can see in the H4 chart, XAUUSD has formed a Hammer reversal pattern not far from the support area. At the moment, the asset is reversing in the form of a new rising impulse. In this case, the upside target may be the resistance level at 1885.50. At the same time, an opposite scenario implies that the price may correct to reach 1840.50 before resuming the ascending tendency.

https://roboforex.com/uploads/roboforecast/roboforex.com/99/2022/Candles/may/27/XAUUSDH4.png

Read more - Japanese Candlesticks Analysis XAUUSD, NZDUSD, GBPUSD

Re: Forex Technical Analysis & Forecast by RoboForex

Ichimoku Cloud Analysis 30.05.2022 (GBPUSD, USDJPY, AUDUSD)

GBPUSD, “Great Britain Pound vs US Dollar”

GBPUSD is rebounding from Tenkan-Sen. The instrument is currently moving above Ichimoku Cloud, thus indicating an ascending tendency. The markets could indicate that the price may test Kijun-Sen at 1.2545 and then resume moving upwards to reach 1.2905 Another signal in favour of a further uptrend will be a rebound from the rising channel’s downside border. However, the bullish scenario may no longer be valid if the price breaks the cloud’s downside border and fixes below 1.2305. In this case, the pair may continue falling towards 1.2210.

https://roboforex.com/uploads/roboforecast/roboforex.com/99/2022/Ichimoku/may/30/gbpusd.png

Read more - Ichimoku Cloud Analysis GBPUSD, USDJPY, AUDUSD

Re: Forex Technical Analysis & Forecast by RoboForex

Murrey Math Lines 31.05.2022 (AUDUSD, NZDUSD)

AUDUSD, “Australian Dollar vs US Dollar”

As we can see in the H4 chart, after breaking the 200-day Moving Average, AUDUSD is trading above it to indicate an ascending tendency. In this case, the price is expected to break 3/8 and then continue growing to reach the resistance at 4/8. However, this scenario may no longer be valid if the price breaks the support at 2/8 to the downside. After that, the instrument may reverse and resume falling towards 1/8.

https://roboforex.com/uploads/roboforecast/roboforex.com/99/2022/Murrey/may/31/1.png

Read more - Murrey Math Lines AUDUSD, NZDUSD

Re: Forex Technical Analysis & Forecast by RoboForex

Forex Technical Analysis & Forecast 01.06.2022

EURUSD, “Euro vs US Dollar”

Having completed the descending impulse at 1.0680 along with the correction up to 1.0746, EURUSD is forming another descending wave towards 1.0623. Later, the market may form one more ascending structure to return to 1.0680 and then resume moving within the downtrend with the target at 1.0584.

https://roboforex.com/uploads/roboforecast/roboforex.com/99/2022/TA/june/01/EURUSDH1.png

Read more - Forex Technical Analysis & Forecast 01.06.2022

Re: Forex Technical Analysis & Forecast by RoboForex

The Aussie is retreating. Overview for 01.06.2022

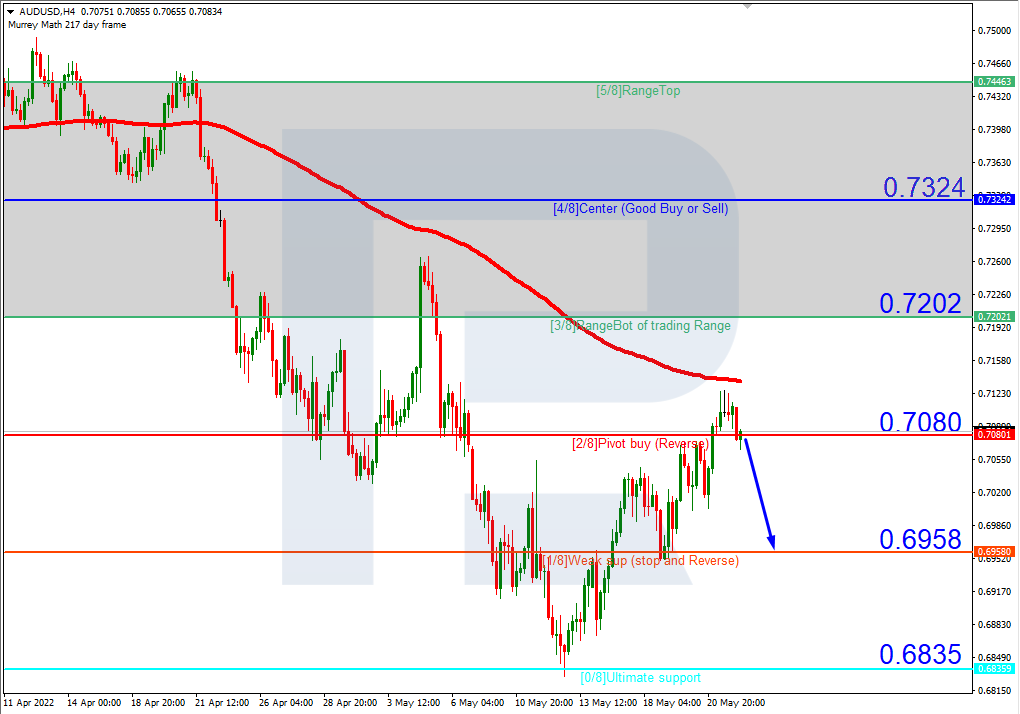
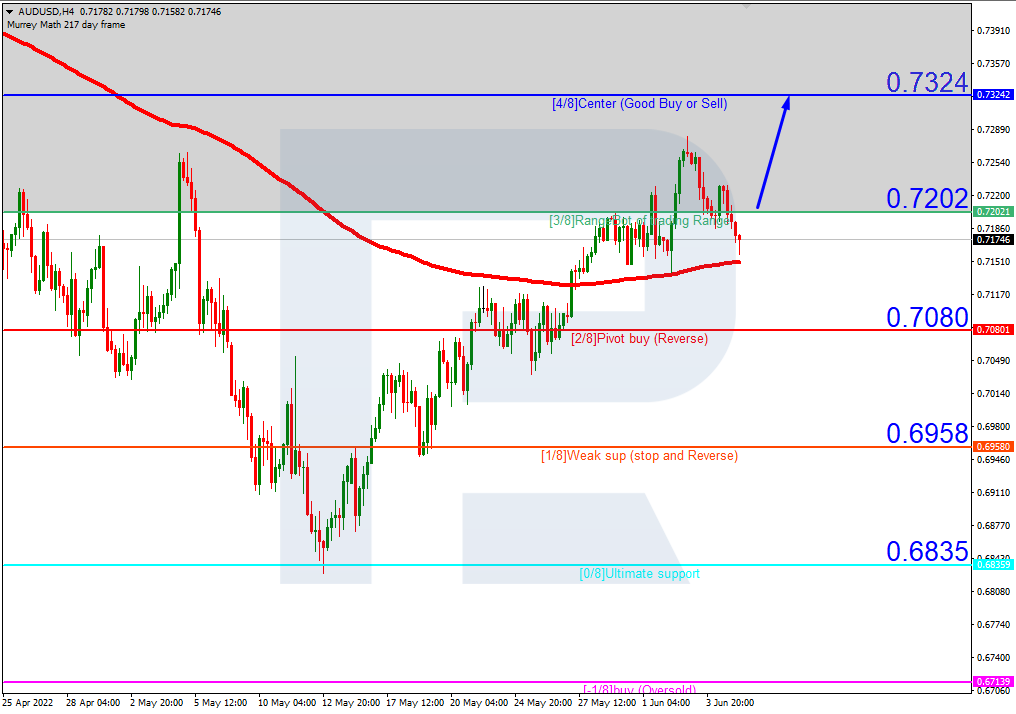
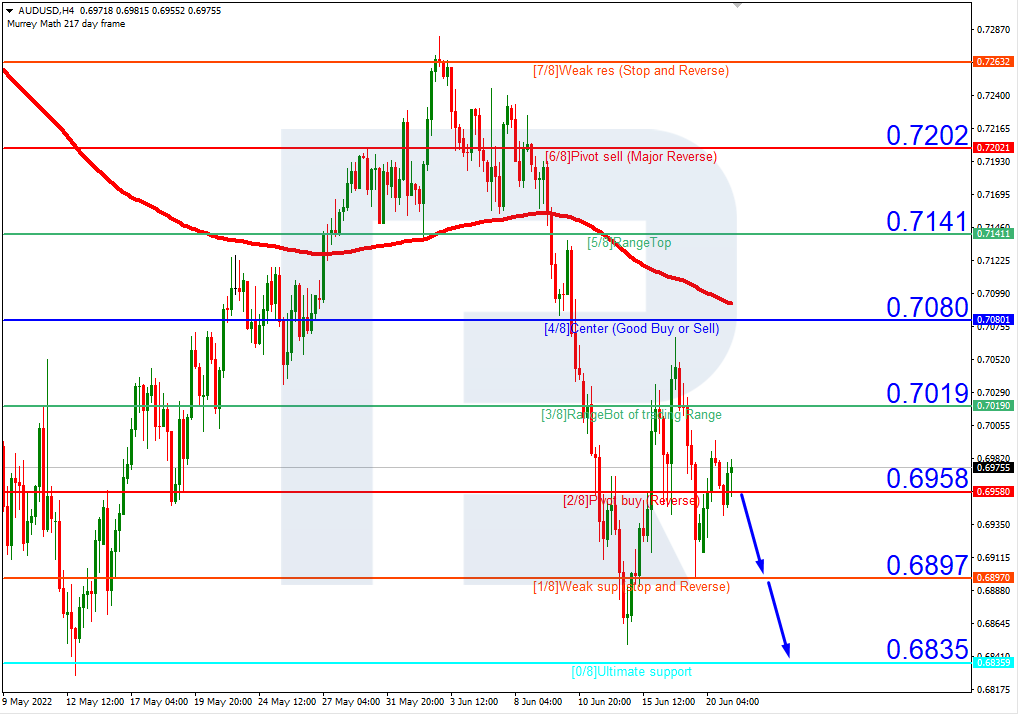
After growing earlier, AUDUSD is now correcting.

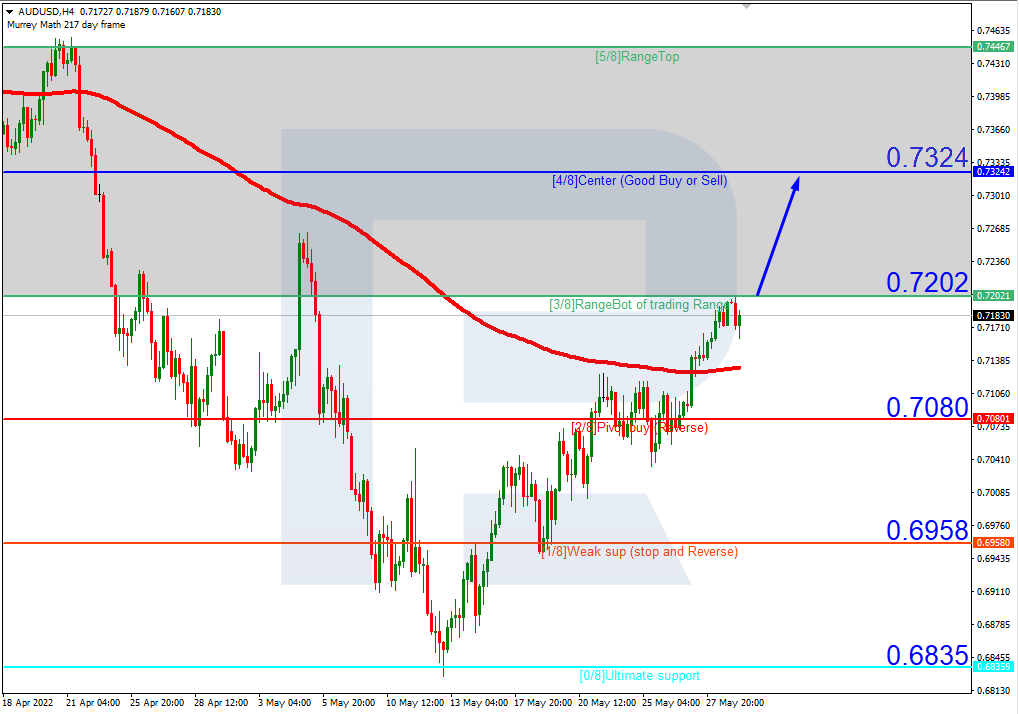
The Australian Dollar is falling a bit against the USD on Wednesday. The current quote for the instrument is 0.7180.

The Aussie had a great run and now requires a correction. On the other hand, the “greenback” is increasing the pressure – investors need “safe haven” assets as the external background is getting worse.

Today’s statistics showed that the Australian GDP added 0.8% q/q in the first quarter of 2022 after gaining 3.6% q/q the quarter before and against the expected reading of 0.6% q/q. On YoY, the indicator showed +3.3% against market expectations of +3.0%

The labour market in Australia is stable, which means that consumer incomes are stable as well. The question is about spending: how strong should inflation be to make people revise their spending and even cut it? One more negative factor is Chinese lockdowns – China remains Australia’s key trade and economic partner.

High oil and energy prices affect inflation and, hence, the GDP dynamics as well. Nevertheless, one should admit that Australia is doing a good job in handling the CPI so far.

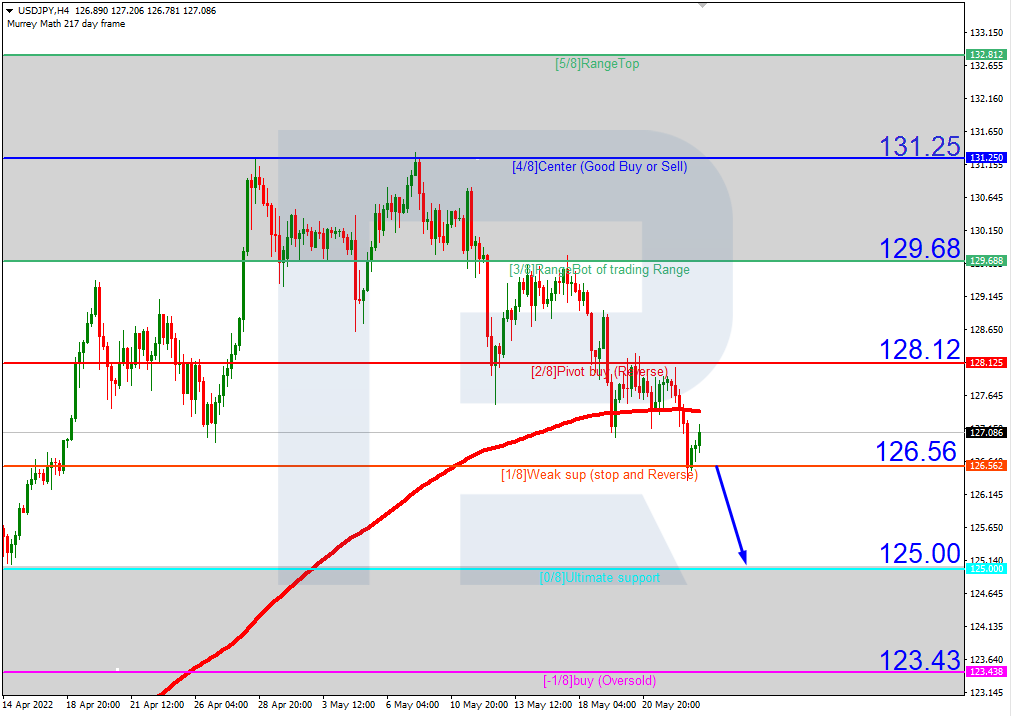
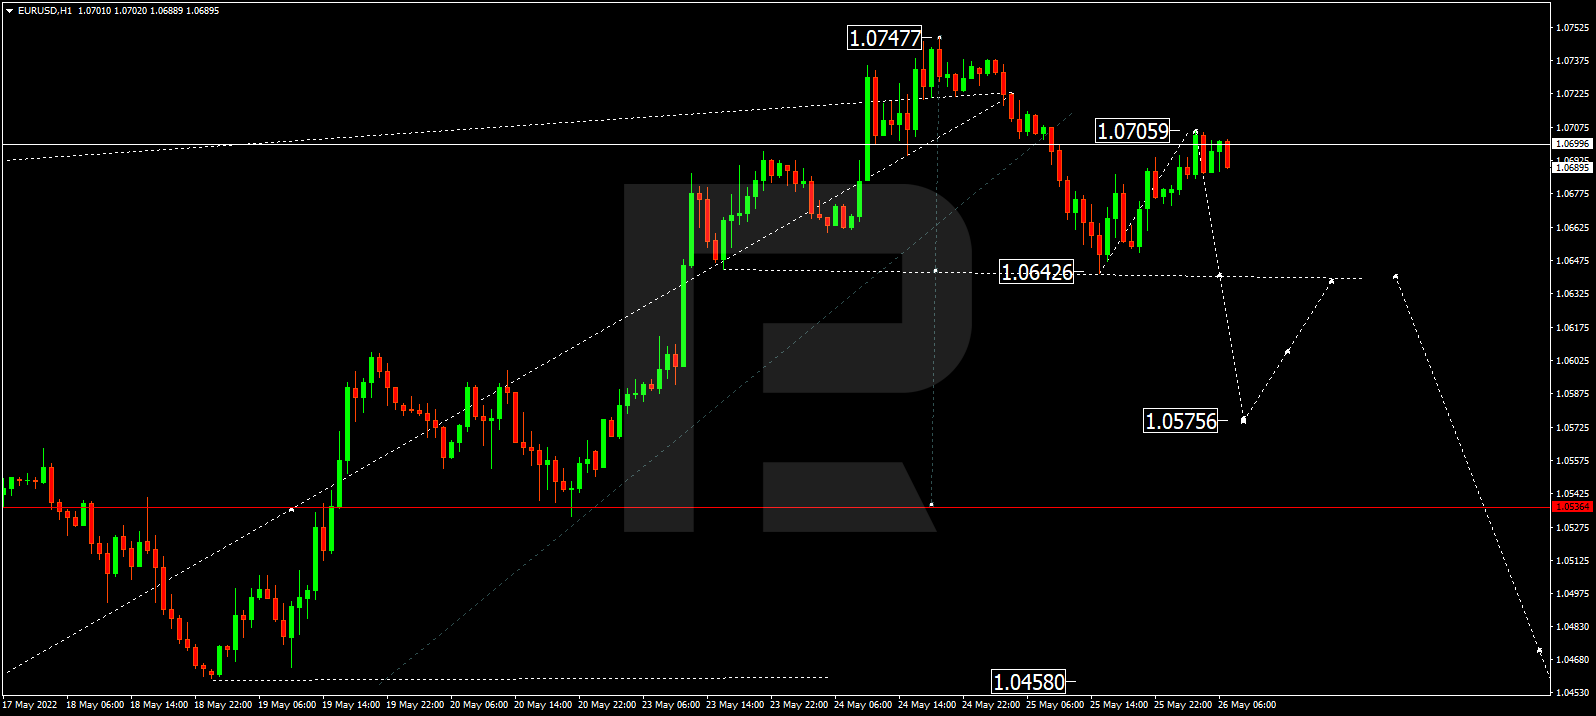
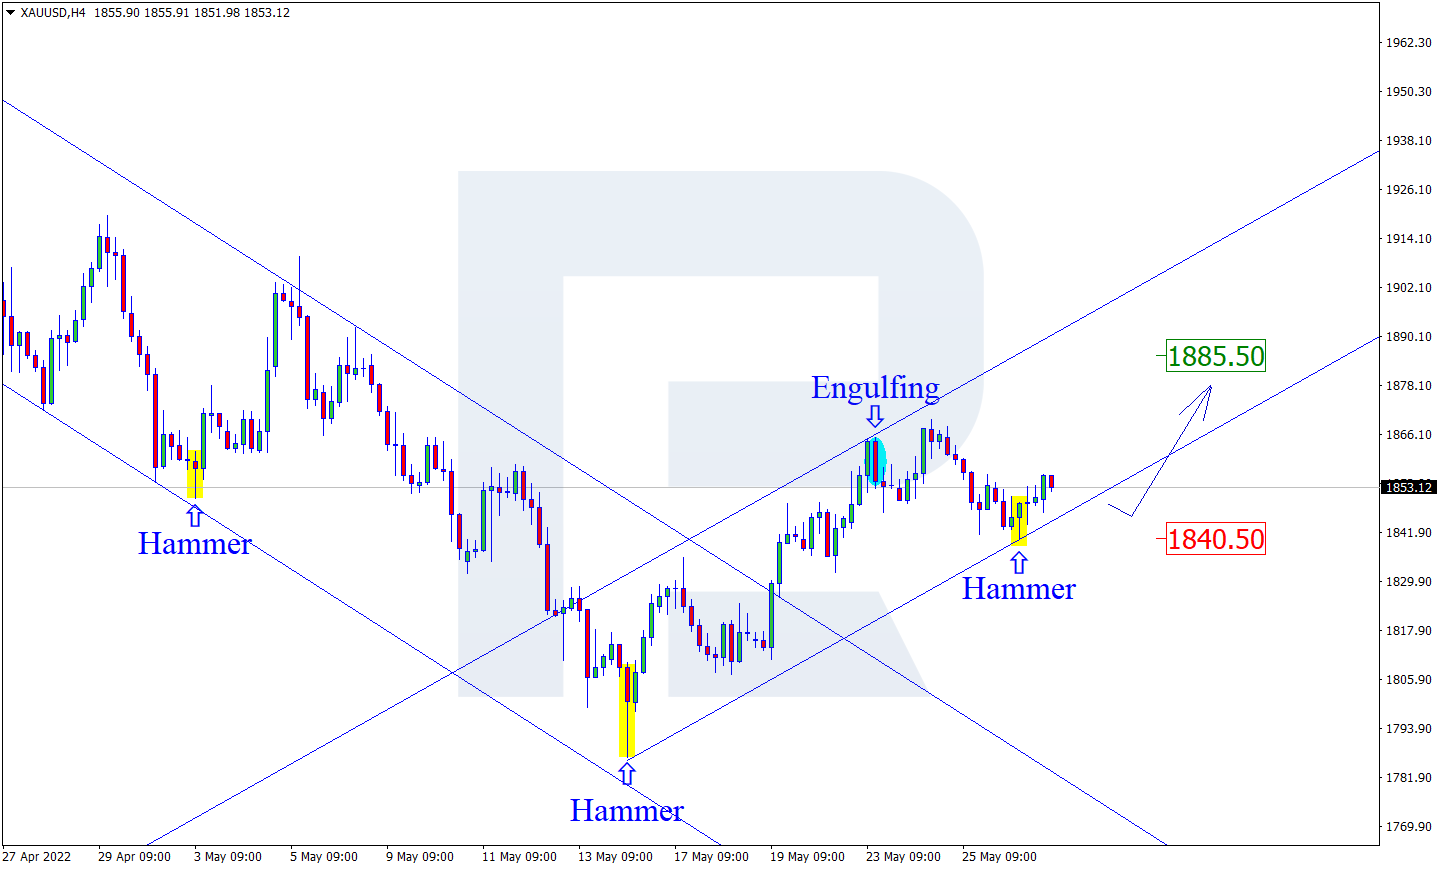
Forecasts for other instruments can be found in the section "Forex Forecasts and Analysis" on our website.

Re: Forex Technical Analysis & Forecast by RoboForex

Murrey Math Lines 02.06.2022 (USDCHF, GOLD)

USDCHF, “US Dollar vs Swiss Franc”

As we can see in the H4 chart, USDCHF is trading below the 200-day Moving Average to indicate a possible descending tendency. In this case, the pair is expected to rebound from 3/8 and then resume falling to reach the support at 1/8. However, this scenario may be cancelled if the price breaks the resistance at 3/8 to the upside. After that, the instrument may reverse and grow towards 4/8.

https://roboforex.com/uploads/roboforecast/roboforex.com/99/2022/Murrey/june/02/1.png

Read more - Murrey Math Lines USDCHF, GOLD

Re: Forex Technical Analysis & Forecast by RoboForex

Japanese Candlesticks Analysis 03.06.2022 (EURUSD, USDJPY, EURGBP)

EURUSD, “Euro vs US Dollar”

As we can see in the H4 chart, the asset has formed a Hanging Man reversal pattern close to the resistance area. At the moment, EURUSD may reverse in the form of a new descending impulse. In this case, the downside correctional target may be at 1.0700. However, an alternative scenario implies that the price may grow to reach 1.0840 without correcting towards the support level.

https://roboforex.com/uploads/roboforecast/roboforex.com/99/2022/Candles/june/03/EURUSDH4.png

Read more - Japanese Candlesticks Analysis EURUSD, USDJPY, EURGBP

Re: Forex Technical Analysis & Forecast by RoboForex

Ichimoku Cloud Analysis 06.06.2022 (GBPUSD, XAUUSD, NZDUSD)

GBPUSD, “Great Britain Pound vs US Dollar”

GBPUSD is rebounding from the cloud’s downside border. The instrument is currently moving inside Ichimoku Cloud, thus indicating a sideways tendency. The markets could indicate that the price may test the cloud’s downside border at 1.2530 and then resume moving upwards to reach 1.2825 Another signal in favour of a further uptrend will be a rebound from the rising channel’s downside border. However, the bullish scenario may no longer be valid if the price breaks the cloud’s downside border and fixes below 1.2425. In this case, the pair may continue falling towards 1.2335. To confirm a further uptrend, the price must break the descending channel’s upside border and fix above 1.2605.

https://roboforex.com/uploads/roboforecast/roboforex.com/99/2022/Ichimoku/june/06/gbpusd.png

Read more - Ichimoku Cloud Analysis GBPUSD, XAUUSD, NZDUSD

Re: Forex Technical Analysis & Forecast by RoboForex

Murrey Math Lines 07.06.2022 (AUDUSD, NZDUSD)

AUDUSD, “Australian Dollar vs US Dollar”

As we can see in the H4 chart, AUDUSD is trading above the 200-day Moving Average to indicate an ascending tendency. In this case, the price is expected to break 3/8 and then continue growing to reach the resistance at 4/8. However, this scenario may no longer be valid if the price breaks the support at 2/8 to the downside. After that, the instrument may reverse and resume falling towards 1/8.

https://roboforex.com/uploads/roboforecast/roboforex.com/99/2022/Murrey/june/07/1.png

Read more - Murrey Math Lines AUDUSD, NZDUSD

Re: Forex Technical Analysis & Forecast by RoboForex

Forex Technical Analysis & Forecast 08.06.2022

EURUSD, “Euro vs US Dollar”

EURUSD has completed the correction at 1.0713; right now, it is falling to break 1.0674 and may later continue trading downwards to reach 1.0630. After that, the instrument may resume growing to test 1.0674 from below and then start a new decline with the target at 1.0587.

https://roboforex.com/uploads/roboforecast/roboforex.com/99/2022/TA/june/08/EURUSDH1.png

Read more - Forex Technical Analysis & Forecast 08.06.2022

Re: Forex Technical Analysis & Forecast by RoboForex

Murrey Math Lines 09.06.2022 (USDCHF, GOLD)

USDCHF, “US Dollar vs Swiss Franc”

In the H4 chart, after breaking the 200-day Moving Average, USDCHF is trading above to indicate a possible ascending tendency. In this case, the pair is expected to continue growing to reach the resistance at 5/8. However, this scenario may be cancelled if the price breaks the support at 4/8 to the downside. After that, the instrument may reverse and fall towards 3/8.

https://roboforex.com/uploads/roboforecast/roboforex.com/99/2022/Murrey/june/09/1.png

Read more - Murrey Math Lines USDCHF, GOLD

Re: Forex Technical Analysis & Forecast by RoboForex

Japanese Candlesticks Analysis 10.06.2022 (USDCAD, AUDUSD, USDCHF)

USDCAD, “US Dollar vs Canadian Dollar”

As we can see in the H4 chart, after forming a Doji reversal pattern close to the resistance level, USDCAD may reverse in the form of another descending impulse. In this case, the downside target may be at 1.2595. However, an alternative scenario implies that the asset may grow to rebound from the resistance level at 1.2750 and resume the descending tendency after the pullback.

https://roboforex.com/uploads/roboforecast/roboforex.com/99/2022/Candles/june/10/USDCADH4.png

Read more - Japanese Candlesticks Analysis USDCAD, AUDUSD, USDCHF

Re: Forex Technical Analysis & Forecast by RoboForex

Murrey Math Lines 14.06.2022 (AUDUSD, NZDUSD)

AUDUSD, “Australian Dollar vs US Dollar”

On H4, the quotes are under the 200-days Moving Average, which indicates a downtrend. A test of 1/8 is expected, followed by a breakaway and a decline to the support level of 0/8. The scenario can be cancelled by a breakaway of the support level of 3/8 upwards. In this case, the pair can grow to 5/8.

https://roboforex.com/uploads/roboforecast/roboforex.com/99/2022/Murrey/june/14/1.png

Read more - Murrey Math Lines AUDUSD, NZDUSD

Re: Forex Technical Analysis & Forecast by RoboForex

Forex Technical Analysis & Forecast 15.06.2022

EURUSD, “Euro vs US Dollar”

The pair completed a wave of correction to 1.0477. Today the market keeps developing a declining wave to 1.0400, and with a breakaway of this level downwards, a pathway to 1.0270 will open.

https://roboforex.com/uploads/roboforecast/roboforex.com/99/2022/TA/june/15/EURUSDH1.png

Read more - Forex Technical Analysis & Forecast 15.06.2022

Re: Forex Technical Analysis & Forecast by RoboForex

Ichimoku Cloud Analysis 16.06.2022 (GBPUSD, BRENT, USDCAD)

GBPUSD, "Great Britain Pound vs US Dollar"

The pair is correcting upon bouncing off the support area. The pair is moving under the Ichimoku Cloud suggesting a downtrend. A test of the Kijun-Sen line is expected at 1.2205, followed by falling to 1.1845. An additional signal confirming the decline will be a bounce off the upper border of the descending channel. The scenario can be cancelled by a breakaway of the upper border of the Cloud and securing above 1.2365, which will indicate further growth to 1.2455.

https://roboforex.com/uploads/roboforecast/roboforex.com/99/2022/Ichimoku/june/16/gbpusd.png

Read more - Ichimoku Cloud Analysis GBPUSD, BRENT, USDCAD

Re: Forex Technical Analysis & Forecast by RoboForex

Japanese Candlesticks Analysis 17.06.2022 (EURUSD, USDJPY, EURGBP)

EURUSD, "Euro vs US Dollar"

On H4, at the resistance level, the pair has formed a Shooting Star reversal pattern. Going by the pattern, the pair might find itself in a descending impulse. The goal of the decline will be 1.0445. However, the price might still pull back to 1.0560 before resuming the downtrend.

https://roboforex.com/uploads/roboforecast/roboforex.com/99/2022/Candles/june/17/EURUSDH4.png

Read more - Japanese Candlesticks Analysis EURUSD, USDJPY, EURGBP

Re: Forex Technical Analysis & Forecast by RoboForex

Forex Technical Analysis & Forecast 20.06.2022

EURUSD, “Euro vs US Dollar”

The pair is forming a consolidation range around 1.0500. With an escape upwards, the correction might continue to 1.0620, followed by a decline to 1.0220. With an escape downwards, a pathway directly to 1.0220 will open.

https://roboforex.com/uploads/roboforecast/roboforex.com/99/2022/TA/june/20/EURUSDH1.png

Read more - Forex Technical Analysis & Forecast 20.06.2022

Re: Forex Technical Analysis & Forecast by RoboForex

Murrey Math Lines 21.06.2022 (AUDUSD, NZDUSD)

AUDUSD, “Australian Dollar vs US Dollar”

As we can see in the H4 chart, AUDUSD is trading below the 200-day Moving Average to indicate a descending tendency. In this case, the price is expected to test 2/8, break it, and then continue falling to reach the support at 0/8. However, this scenario may no longer be valid if the price breaks the resistance at 3/8 to the upside. After that, the instrument may reverse and resume growing towards 4/8.

https://roboforex.com/uploads/roboforecast/roboforex.com/99/2022/Murrey/june/21/1.png

Read more - Murrey Math Lines AUDUSD, NZDUSD

Re: Forex Technical Analysis & Forecast by RoboForex

Forex Technical Analysis & Forecast 22.06.2022

EURUSD, “Euro vs US Dollar”

After completing the correction at 1.0577, EURUSD is forming a new descending structure to break 1.0395 and may later continue falling with the target at 1.0210.

https://roboforex.com/uploads/roboforecast/roboforex.com/99/2022/TA/june/22/EURUSDH1.png

Read more - Forex Technical Analysis & Forecast 22.06.2022

Re: Forex Technical Analysis & Forecast by RoboForex

Murrey Math Lines 23.06.2022 (USDCHF, GOLD)

USDCHF, “US Dollar vs Swiss Franc”

As we can see in the H4 chart, USDCHF is trading inside the “oversold area”. In this case, the pair is expected to test -1/8, break it, and then continue growing to reach the resistance at 0/8. However, this scenario may be cancelled if the price breaks the support at -2/8 to the downside. After that, the lines in the chart will be redrawn, thus helping us to define new downside targets.

https://roboforex.com/uploads/roboforecast/roboforex.com/99/2022/Murrey/june/23/1.png

Read more - Murrey Math Lines USDCHF, GOLD

Re: Forex Technical Analysis & Forecast by RoboForex

Japanese Candlesticks Analysis 24.06.2022 (USDCAD, AUDUSD, USDCHF)

USDCAD, “US Dollar vs Canadian Dollar”

As we can see in the H4 chart, after forming a Harami reversal pattern close to the support level, USDCAD may reverse in the form of another ascending impulse. In this case, the upside target may be the resistance area at 1.3095. Later, the market may break this level and continue growing. However, an alternative scenario implies that the asset may correct to reach 1.2920 first and then resume trading upwards.

https://roboforex.com/uploads/roboforecast/roboforex.com/99/2022/Candles/june/24/USDCADH4.png

Read more - Japanese Candlesticks Analysis USDCAD, AUDUSD, USDCHF

Re: Forex Technical Analysis & Forecast by RoboForex

Forex Technical Analysis & Forecast 27.06.2022

EURUSD, “Euro vs US Dollar”

EURUSD is consolidating around 1.0555. Possibly, the pair may form one more ascending structure towards 1.0630. Later, the market may trade downwards to break 1.0550 and then continue falling with the target at 1.0440.

https://roboforex.com/uploads/roboforecast/roboforex.com/99/2022/TA/june/27/EURUSDH1.png

Read more - Forex Technical Analysis & Forecast 27.06.2022

Posts: 676 to 700 of 1,098

Pages Previous 1 26 27 28 29 30 44 Next

You must login or register to post a reply

Forex Software → Market Analysis → Forex Technical Analysis & Forecast by RoboForex

Similar topics in this forum