forex software

Create and Test Forex Strategies

forex software

Skip to forum content

Forex Software

Create and Test Forex Strategies

You are not logged in. Please login or register.


(Page 16 of 44)

Forex Software → Market Analysis → Forex Technical Analysis & Forecast by RoboForex

Pages Previous 1 14 15 16 17 18 44 Next

You must login or register to post a reply

RSS topic feed

Posts: 376 to 400 of 1,098

Re: Forex Technical Analysis & Forecast by RoboForex

Fibonacci Retracements Analysis 18.03.2021 (Brent, DAX30)
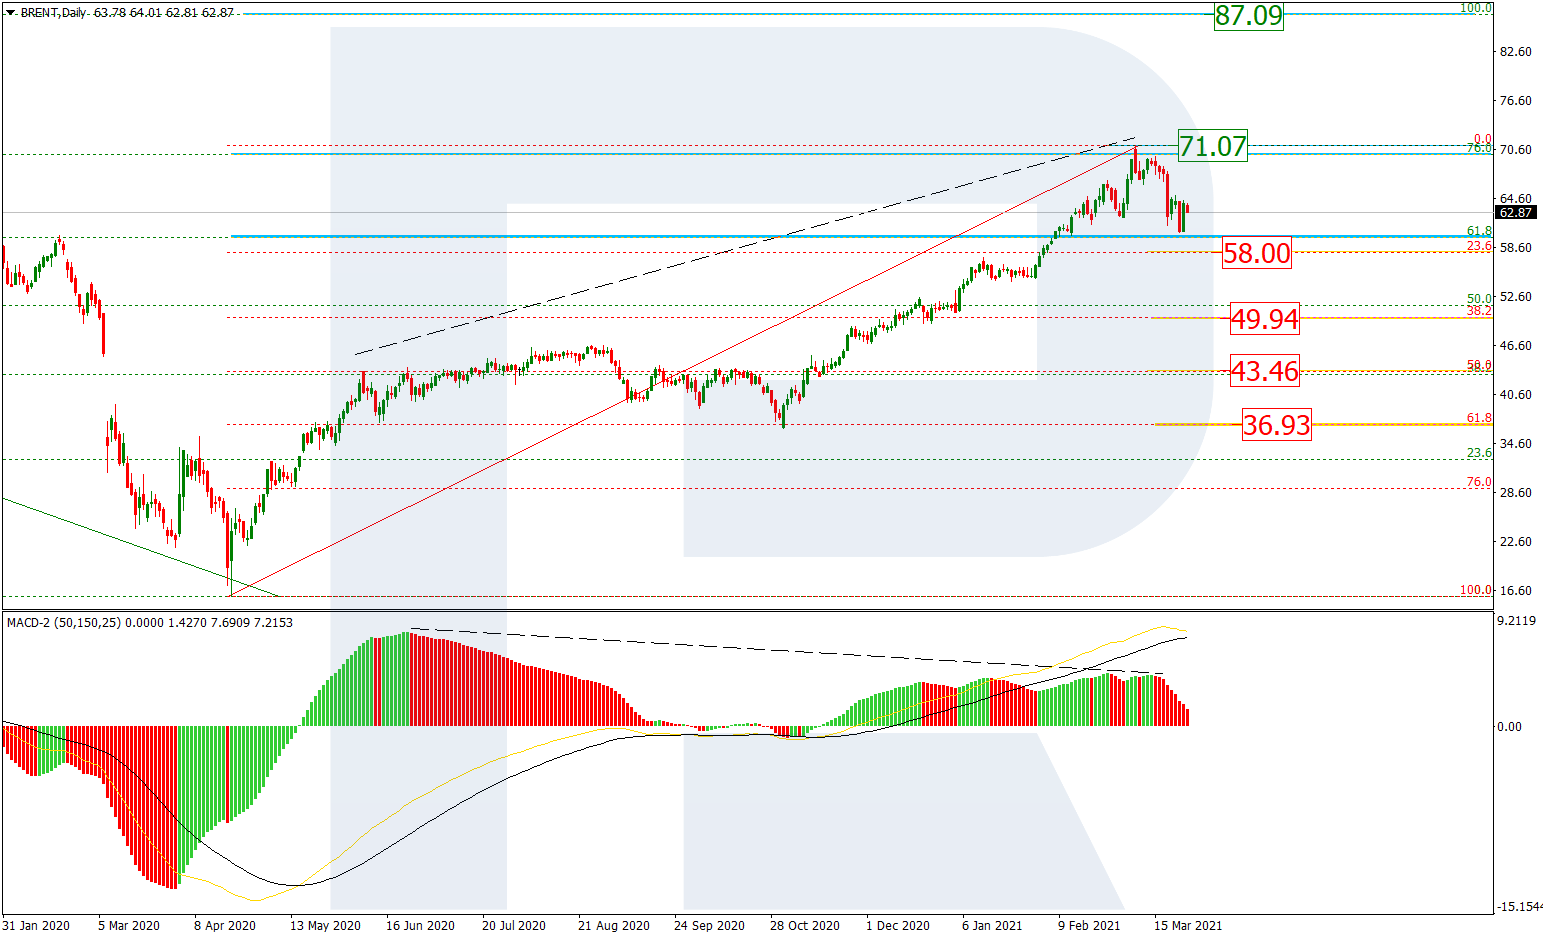
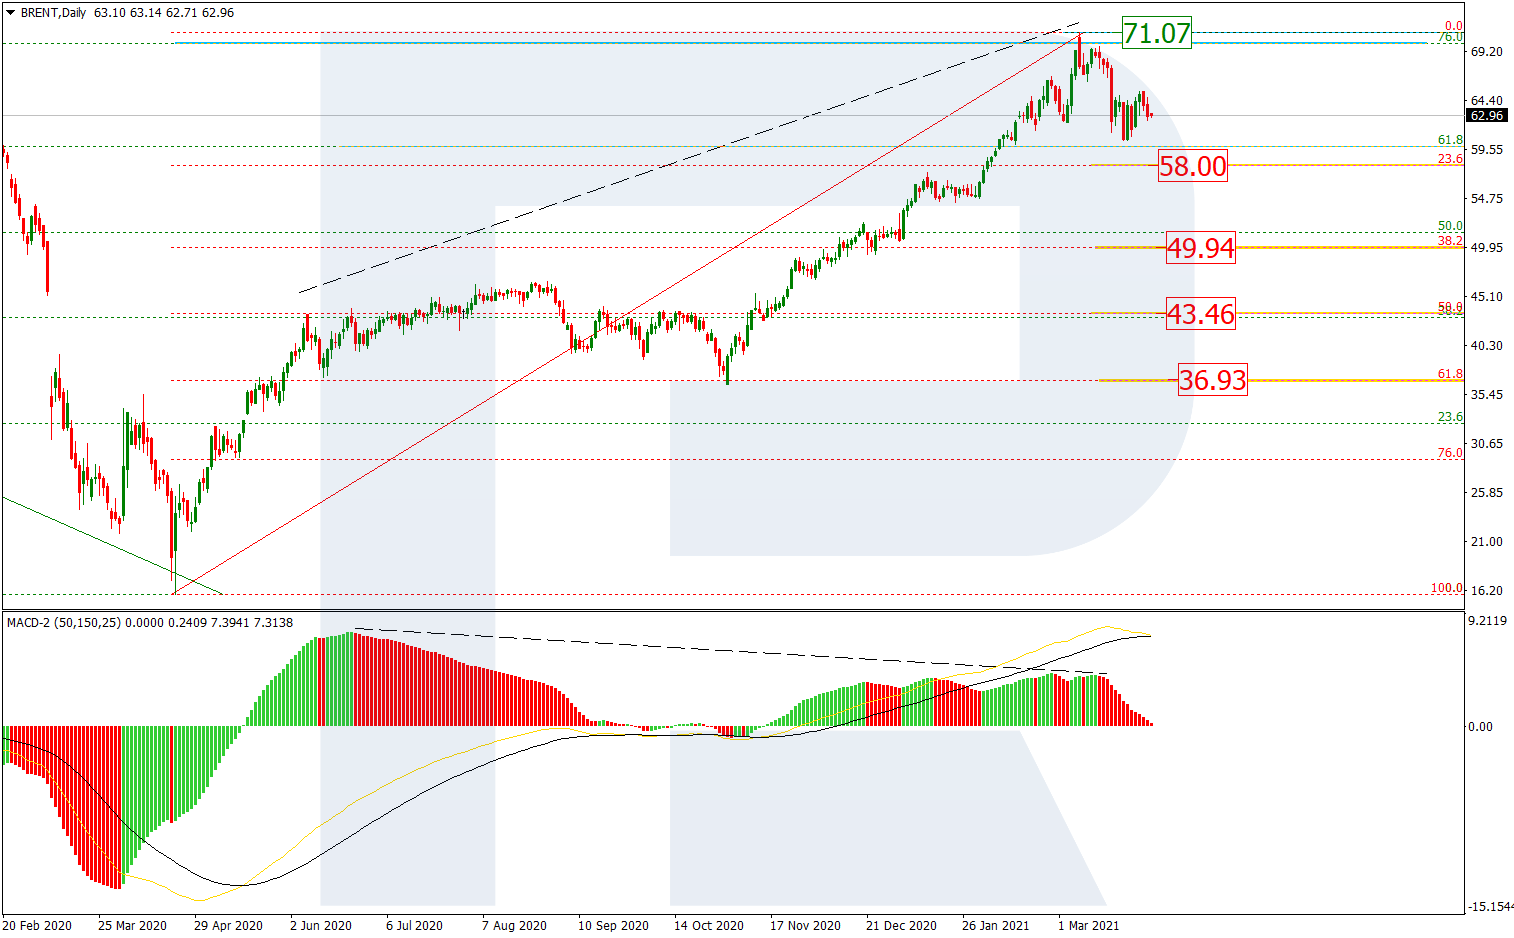
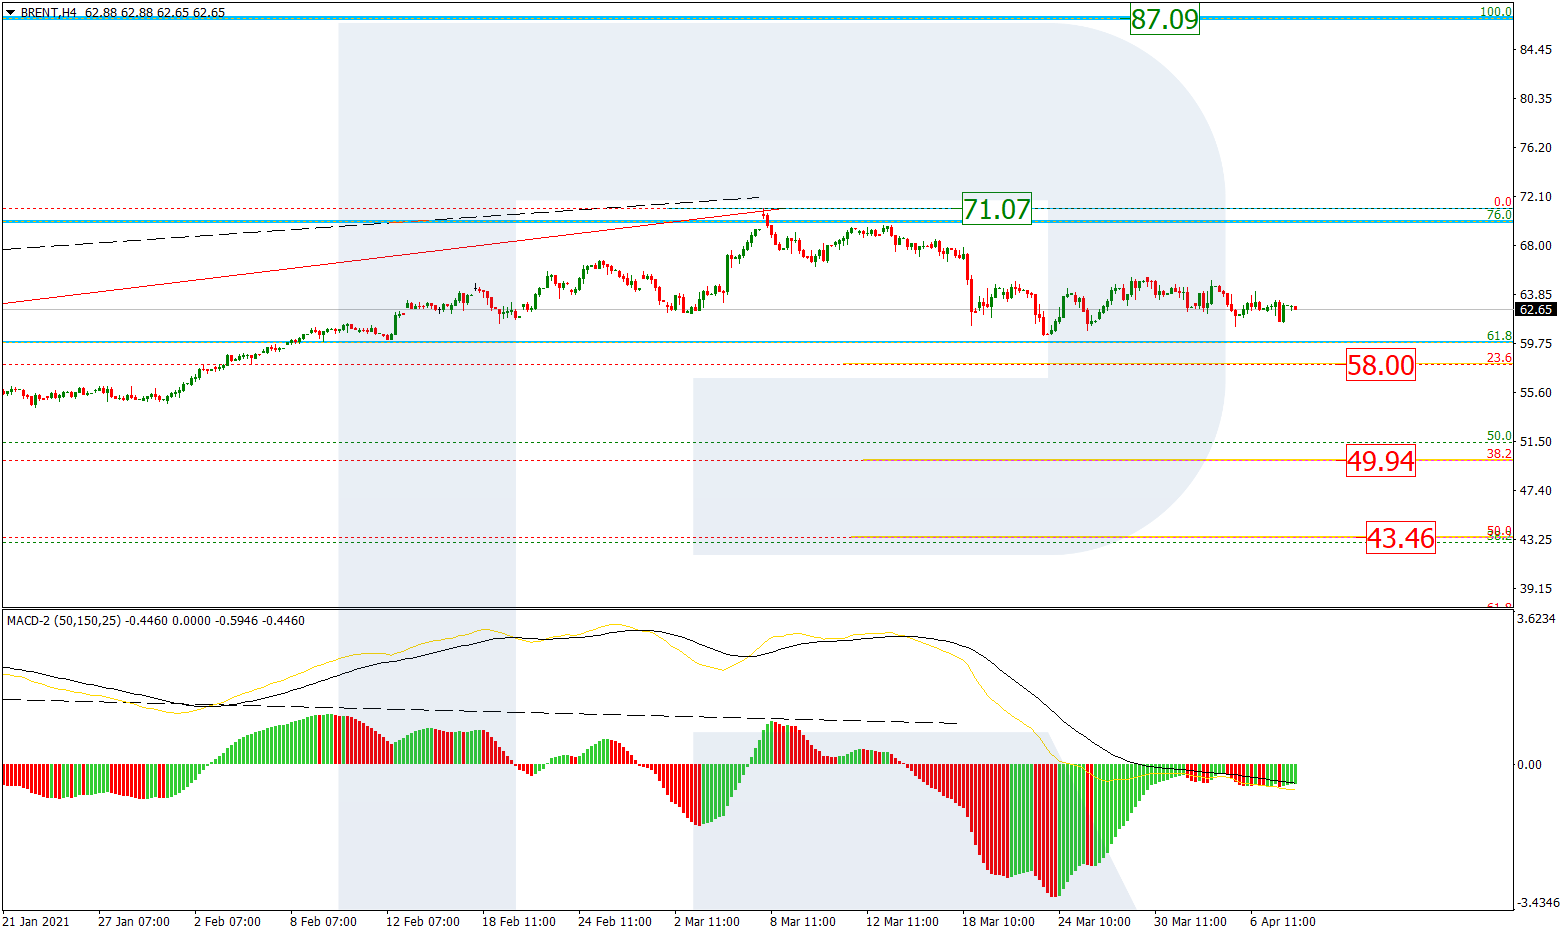
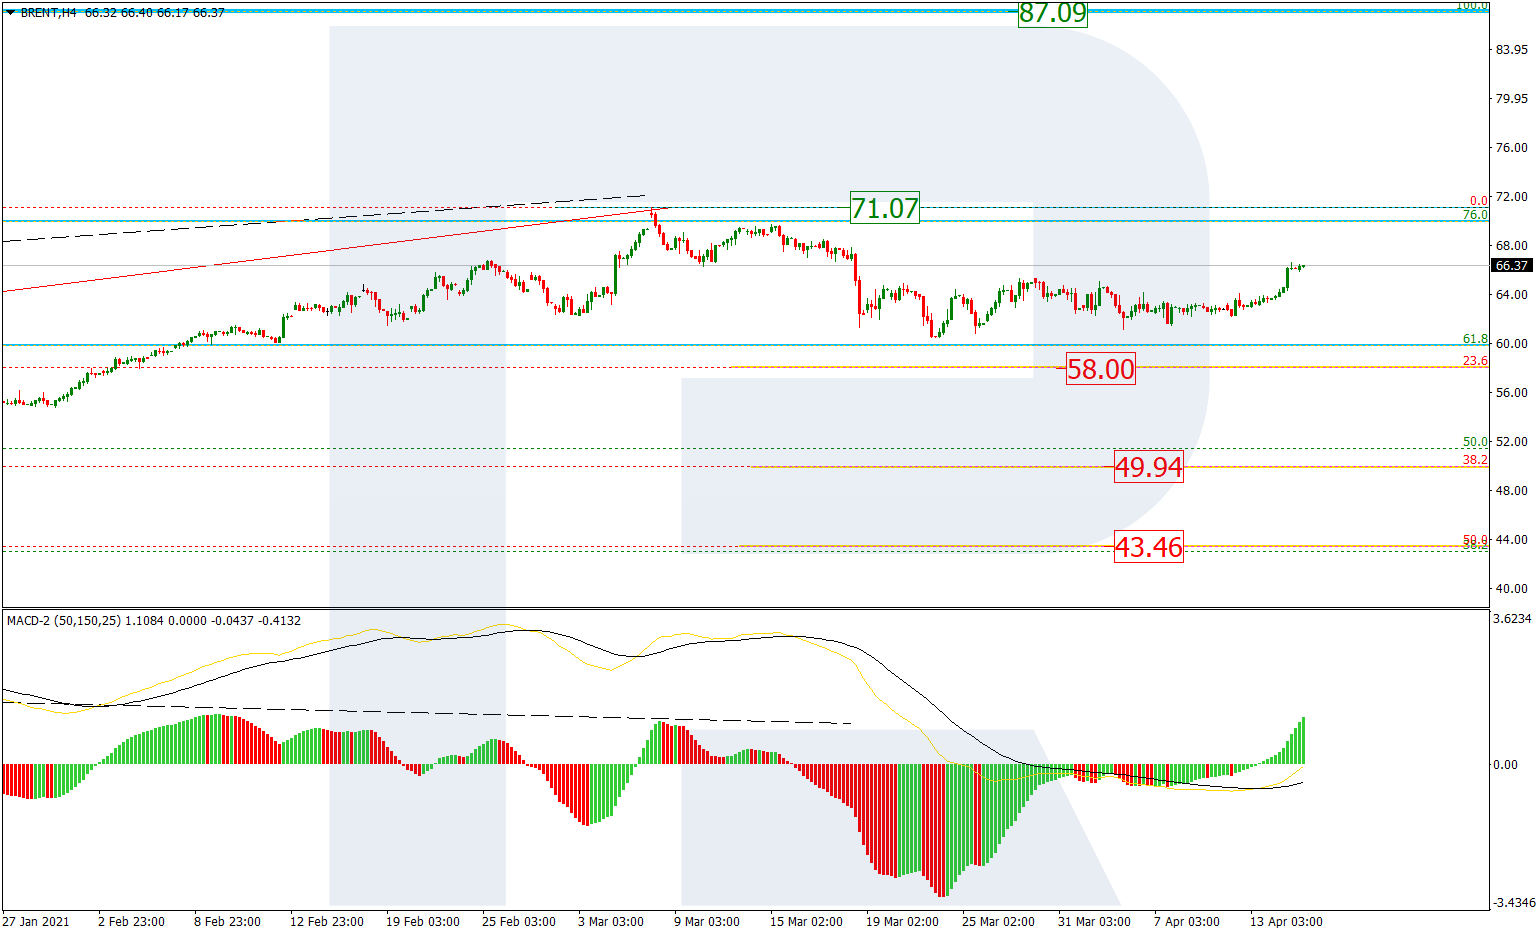
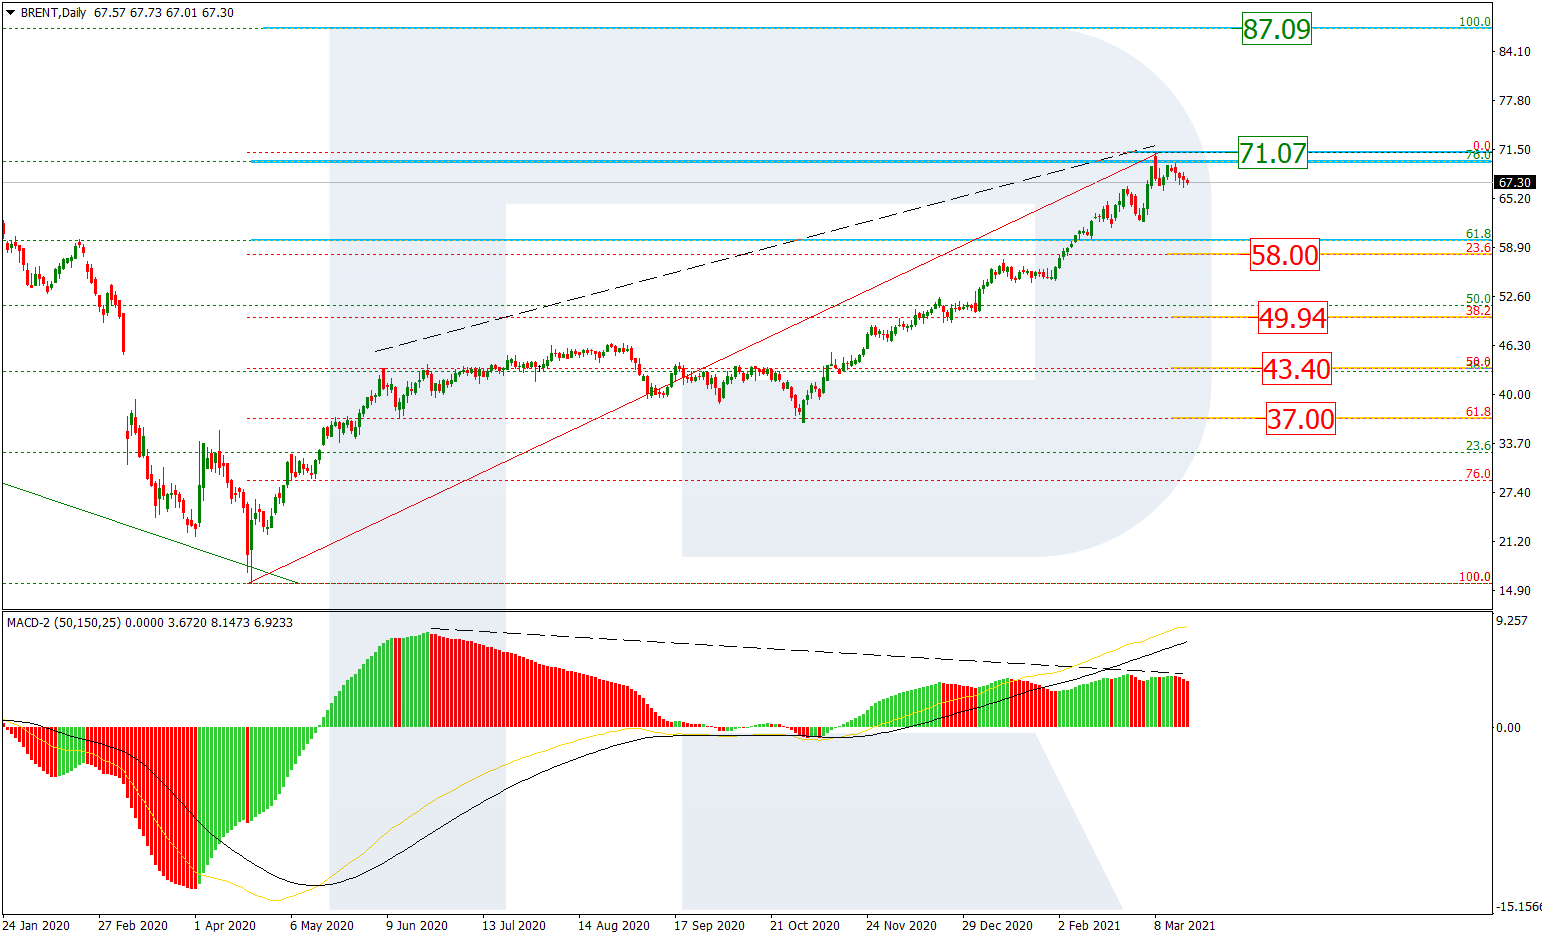
Brent

The daily chart shows a long-term ascending tendency, which still seems pretty stable. However, one should note that after reaching the long-term 76.0% fibo, Brent has started a new short-term pullback, which may transform into a proper downtrend towards 23.6%, 38.2%, 50.0%, and 61.8% fibo at 58.00, 49.94, 43.40, and 37.00 respectively. A breakout of the high at 71.07 may complete the correction and lead to a further uptrend to reach the fractal high at 87.09.

https://roboforex.com/uploads/roboforecast/roboforex.com/99/2021/Fibo/march/18/BRENTDaily.png

Read more - Fibonacci Retracements Analysis Brent, DAX30

Re: Forex Technical Analysis & Forecast by RoboForex

Japanese Candlesticks Analysis 19.03.2021 (USDCAD, AUDUSD, USDCHF)

USDCAD, “US Dollar vs Canadian Dollar”

As we can see in the H4 chart, after forming several reversal patterns, including Hammer, not far from the support level, USDCAD is reversing in the form of a correction and may reach the resistance area. In this case, the upside target is at 1.2555. After testing the resistance area, the price may rebound and resume its descending tendency.

https://roboforex.com/uploads/roboforecast/roboforex.com/99/2021/Candles/march/19/USDCADH4.png

Read more - Japanese Candlesticks Analysis USDCAD, AUDUSD, USDCHF

378 (edited by RF roboforex 2021-03-22 12:08:46)

Re: Forex Technical Analysis & Forecast by RoboForex

Ichimoku Cloud Analysis 22.03.2021 (EURUSD, USDCAD, EURJPY)

EURUSD, “Euro vs US Dollar”

EURUSD is trading at 1.1889; the instrument is moving below Ichimoku Cloud, thus indicating a descending tendency. The markets could indicate that the price may test the cloud’s upside border at 1.1925 and then resume moving downwards to reach 1.1685. Another signal in favor of a further downtrend will be a rebound from the descending channel’s upside border. However, the bearish scenario may be canceled if the price breaks the cloud’s upside border and fixes above 1.1975. In this case, the pair may continue growing towards 1.2065.

https://roboforex.com/uploads/roboforecast/roboforex.com/99/2021/Ichimoku/march/22/eurusd.png

Read more - Ichimoku Cloud Analysis EURUSD, USDCAD, EURJPY

Re: Forex Technical Analysis & Forecast by RoboForex

Murrey Math Lines 23.03.2021 (AUDUSD, NZDUSD)

AUDUSD, “Australian Dollar vs US Dollar”

In the H4 chart, after rebounding from 3/8, AUDUSD is trading below the 200-day Moving Average, thus indicating a descending tendency. In this case, the price is expected to break 2/8 and then continue moving downwards to reach the support at 1/8. However, this scenario may be canceled if the price breaks 3/8 to the upside. After that, the instrument may grow towards the resistance at 4/8.

https://roboforex.com/uploads/roboforecast/roboforex.com/99/2021/Murrey/march/23/1.png

Read more - Murrey Math Lines AUDUSD, NZDUSD

Re: Forex Technical Analysis & Forecast by RoboForex

Forex Technical Analysis & Forecast 24.03.2021

EURUSD, “Euro vs US Dollar”

After breaking 1.1900 and forming a downside continuation pattern there, EURUSD has completed another descending structure at 1.1850; right now, it is consolidating above the latter level. Possibly, the pair may grow to test 1.1900 from below and then resume trading downwards with the target at 1.1830.

https://roboforex.com/uploads/roboforecast/roboforex.com/99/2021/TA/march/24/EURUSDH1.png

Read more - Forex Technical Analysis & Forecast 24.03.2021

Re: Forex Technical Analysis & Forecast by RoboForex

Fibonacci Retracements Analysis 25.03.2021 (Brent, Dow Jones)

Brent

In the daily chart, the asset is forming a new descending correction after testing the long-term 76.0% fibo. Another signal in favor of a possible reversal is a divergence on MACD. Right now, the price is moving close to its first target, 23.6% fibo at 58.00, and may later continue falling to reach the next ones at 38.2%, 50.0%, and 61.8% fibo at 49.94, 43.46, and 36.93 respectively. A breakout of the high at 71.07 may complete the correction and lead to a further uptrend to reach the fractal high at 87.09.

https://roboforex.com/uploads/roboforecast/roboforex.com/99/2021/Fibo/march/25/BRENTDaily.png

Read more - Fibonacci Retracements Analysis Brent, Dow Jones

Re: Forex Technical Analysis & Forecast by RoboForex

Japanese Candlesticks Analysis 26.03.2021 (GOLD, NZDUSD, GBPUSD)

XAUUSD, “Gold vs US Dollar”

As we can see in the H4 chart, the sideways tendency continues. After forming several reversal patterns, such as Hammer, close to the support level, XAUUSD may reverse and resume growing towards the resistance area. In this case, the upside target may be at 1780.00. At the same time, an opposite scenario implies that the price may correct to reach 1715.00 before resuming its growth.

https://roboforex.com/uploads/roboforecast/roboforex.com/99/2021/Candles/march/26/XAUUSDH4.png

Read more - Japanese Candlesticks Analysis GOLD, NZDUSD, GBPUSD

Re: Forex Technical Analysis & Forecast by RoboForex

Ichimoku Cloud Analysis 29.03.2021 (EURJPY, BRENT, NZDCAD)

EURJPY, “Euro vs Japanese Yen”

EURJPY is trading at 128.91; the instrument is moving below Ichimoku Cloud, thus indicating a descending tendency. The markets could indicate that the price may test Tenkan-Sen and Kijun-Sen at 129.10 and then resume moving downwards to reach 127.55. Another signal in favor of a further downtrend will be a rebound from the descending channel’s upside border. However, the bearish scenario may no longer be valid if the price breaks the cloud’s upside border and fixes above 129.95. In this case, the pair may continue growing towards 130.85. To confirm further decline, the asset must break the rising channel’s downside border and fix below 128.55.

https://roboforex.com/uploads/roboforecast/roboforex.com/99/2021/Ichimoku/march/29/eurjpy.png

Read more - Ichimoku Cloud Analysis EURJPY, BRENT, NZDCAD

Re: Forex Technical Analysis & Forecast by RoboForex

Murrey Math Lines 30.03.2021 (AUDUSD, NZDUSD)

AUDUSD, “Australian Dollar vs US Dollar”

As we can see in the H4 chart, AUDUSD is trading below the 200-day Moving Average, thus indicating a descending tendency. However, right now, the asset is correcting upwards and may reach 2/8. In this case, the price is expected to test 2/8, rebound from it, and then resume moving downwards to reach the support at 0/8. However, this scenario may be canceled if the price breaks 1/8 to the downside. After that, the instrument may fall towards 0/8 without testing 2/8.

https://roboforex.com/uploads/roboforecast/roboforex.com/99/2021/Murrey/march/30/1.png

Read more - Murrey Math Lines AUDUSD, NZDUSD

Re: Forex Technical Analysis & Forecast by RoboForex

Forex Technical Analysis & Forecast 31.03.2021

EURUSD, “Euro vs US Dollar”

After reaching its short-term downside target, EURUSD is expected to consolidate near the lows. Possibly, the pair may expand the range down to 1.1700. Later, the market may break the descending channel and resume trading upwards with the target at 1.1990.

https://roboforex.com/uploads/roboforecast/roboforex.com/99/2021/TA/march/31/EURUSDH4.png

Read more - Forex Technical Analysis & Forecast 31.03.2021

Re: Forex Technical Analysis & Forecast by RoboForex

Fibonacci Retracements Analysis 01.04.2021 (Brent, Dow Jones)

Brent

In the daily chart, the situation hasn’t changed much as the asset is still forming its descending correction after testing the long-term 76.0% fibo and a divergence on MACD. Right now, the price is moving close to its first target, 23.6% fibo at 58.00, and trading as if it can’t decide whether to continue falling or not. The next downside targets might be 38.2%, 50.0%, and 61.8% fibo at 49.94, 43.46, and 36.93 respectively. A breakout of the high at 71.07 may complete the correction and lead to a further uptrend to reach the fractal high at 87.09.

https://roboforex.com/uploads/roboforecast/roboforex.com/99/2021/Fibo/april/01/BRENTDaily.png

Read more - Fibonacci Retracements Analysis Brent, Dow Jones

Re: Forex Technical Analysis & Forecast by RoboForex

Japanese Candlesticks Analysis 02.04.2021 (EURUSD, USDJPY, EURGBP)

EURUSD, “Euro vs. US Dollar”

As we can see in the H4 chart, the asset is still correcting within the uptrend. While testing the support area, the pair has formed several reversal patterns, including Engulfing. At the moment, EURUSD may reverse and form a pullback towards the resistance area. In this case, the correctional target may be at 1.1825. However, an alternative scenario implies that the price may continue falling to reach 1.1665 without testing the resistance area.

https://roboforex.com/uploads/roboforecast/roboforex.com/99/2021/Candles/april/02/EURUSDH4.png

Read more - Japanese Candlesticks Analysis EURUSD, USDJPY, EURGBP

Re: Forex Technical Analysis & Forecast by RoboForex

Ichimoku Cloud Analysis 05.04.2021 (EURUSD, XAGUSD, USDRUB)

EURUSD, “Euro vs US Dollar”

The currency pair is trading at 1.1748 under the Ichimoku Cloud, suggesting a downtrend. A test of the lower border of the Cloud at 1.1765 is expected, followed by falling to 1.1625. An additional signal supporting the growth can be a bounce off the upper border of the descending channel. The scenario can be canceled by a breakaway of the upper border of the Cloud and securing above 1.1855, which will entail further growth to 1.1945.The decline will be confirmed by a breakaway of the lower border of the Triangle and securing under 1.1685.

https://roboforex.com/uploads/roboforecast/roboforex.com/99/2021/Ichimoku/april/05/eurusd.png

Read more - Ichimoku Cloud Analysis EURUSD, XAGUSD, USDRUB

Re: Forex Technical Analysis & Forecast by RoboForex

Murrey Math Lines 06.04.2021 (AUDUSD, NZDUSD)

AUDUSD, "Australian Dollar vs US Dollar"

On H4, the quotations have escaped the oversold area and are now trading above 1/8. We currently expect it to grow to 2/8. If this level is overcome, this will mean further growth to the resistance at 3/8. The scenario can be canceled by a breakaway of 1/8 downwards. In this case, the pair will return to 0/8.

https://roboforex.com/uploads/roboforecast/roboforex.com/99/2021/Murrey/april/06/1.png

Read more - Murrey Math Lines AUDUSD, NZDUSD

390 (edited by RF roboforex 2021-04-07 10:26:47)

Re: Forex Technical Analysis & Forecast by RoboForex

Forex Technical Analysis and Forecast 07.04.2021

EURUSD, “Euro vs US Dollar”

The currency pair formed a consolidation area around 1.1808 and broke it away upwards. Practically, the market suggested the extension og the wave of growth. Today the market has reached the local goal of this extension at 1.1877. We expect a new vonsolidation are to form under 1.1877, which might extend to 1.1880. Then the price might escape this range downwards, correcting to 1.1803 (a test from above) and then grow to 1.1909.

https://roboforex.com/uploads/roboforecast/roboforex.com/99/2021/TA/april/07/EURUSDH1.png

Read more - Forex Technical Analysis & Forecast 07.04.2021

Re: Forex Technical Analysis & Forecast by RoboForex

Fibonacci Retracement Analysis 08.04.2021 (BRENT, Dow Jones)

Brent

On H4, the situation has hardly changed. The quotations are forming a consolidation channel. After a test of a long-term Fibo level of 76.0% and a divergence, the wave of decline is just nearing the first target level of 23.6% (58.00). The next goals might be 38.2% (49.94) and 50.0% (43.46). A breakaway of the high of 71.07 might signal the end of the correction and further growth to the fractal high of 87.09.

https://roboforex.com/uploads/roboforecast/roboforex.com/99/2021/Fibo/april/08/BRENTH4.png

Read more - Fibonacci Retracements Analysis BRENT, Dow Jones

Re: Forex Technical Analysis & Forecast by RoboForex

Japanese Candlestick Analysis 09.04.2021 (USDCAD, AUDUSD, USDCHF)

USDCAD, "US Dollar vs Canadian Dollar"

On H4, the pair has formed several reversal patterns at the resistance line, including a Shooting star. Going by the patterns will currently make the quotations decline to the support level of 1.2455. Upon testing the support level, tge quotations might go on developing the downtrend. However, the price might still return to the resistance level at 1.2625 before resuming the downtrend.

https://roboforex.com/uploads/roboforecast/roboforex.com/99/2021/Candles/april/09/USDCADH4.png

Read more - Japanese Candlesticks Analysis USDCAD, AUDUSD, USDCHF

Re: Forex Technical Analysis & Forecast by RoboForex

Ichimoku Cloud Analysis 12.04.2021 (EURUSD, GBPUSD, EURGBP)

EURUSD, “Euro vs US Dollar”

EURUSD is trading at 1.1889; the instrument is moving above Ichimoku Cloud, thus indicating an ascending tendency. The markets could indicate that the price may test the cloud’s upside border at 1.1860 and then resume moving upwards to reach 1.2075. Another signal in favor of a further uptrend will be a rebound from the descending channel’s upside border. However, the bullish scenario may be canceled if the price breaks the cloud’s downside border and fixes below 1.1775. In this case, the pair may continue falling towards 1.1665.

https://roboforex.com/uploads/roboforecast/roboforex.com/99/2021/Ichimoku/april/12/eurusd.png

Read more - Ichimoku Cloud Analysis EURUSD, GBPUSD, EURGBP

Re: Forex Technical Analysis & Forecast by RoboForex

Murrey Math Lines 13.04.2021 (AUDUSD, NZDUSD)

AUDUSD, “Australian Dollar vs US Dollar”

In the H4 chart, AUDUSD is trading below the 200-day Moving Average, thus indicating a descending tendency. In this case, the price is expected to test 0/8, rebound from it, and then resume moving downwards to reach the support at -1/8. However, this scenario may be canceled if the price breaks 1/8 to the upside. After that, the instrument may grow towards the resistance at 2/8.

https://roboforex.com/uploads/roboforecast/roboforex.com/99/2021/Murrey/april/13/1.png

Read more - Murrey Math Lines AUDUSD, NZDUSD

Re: Forex Technical Analysis & Forecast by RoboForex

Forex Technical Analysis & Forecast 14.04.2021

EURUSD, “Euro vs US Dollar”

After rebounding from 1.1877, EURUSD has broken 1.1920 to the upside. Possibly, today the pair may grow to reach 1.1967 and then start a new correction to test 1.1920 from above. Later, the market may resume trading upwards to reach 1.1980 and then form a new descending structure with the first target at 1.1860.

https://roboforex.com/uploads/roboforecast/roboforex.com/99/2021/TA/april/14/EURUSDH1.png

Read more - Forex Technical Analysis & Forecast 14.04.2021

Re: Forex Technical Analysis & Forecast by RoboForex

Fibonacci Retracements Analysis 15.04.2021 (Brent, Dow Jones)

Brent

In the H4 chart, after failing to reach 23.6% fibo at 58.00, Brent is moving upwards again, probably to update the high at 71.07, a breakout of which may result in a further uptrend towards the fractal high at 87.09. At the same time, the asset may yet rebound from the high and resume falling. In this case, the next downside targets might be 23.6, 38.2%, and 50.0% fibo at 58.00, 49.94, and 43.46 respectively.

https://roboforex.com/uploads/roboforecast/roboforex.com/99/2021/Fibo/april/15/BRENTH4.png

Read more - Fibonacci Retracements Analysis Brent, Dow Jones

Re: Forex Technical Analysis & Forecast by RoboForex

Japanese Candlesticks Analysis 16.04.2021 (GOLD, NZDUSD, GBPUSD)

XAUUSD, “Gold vs US Dollar”

As we can see in the H4 chart, the ascending tendency continues. After forming several reversal patterns, such as Harami, close to the resistance level, XAUUSD may reverse and start a new pullback towards the support area. In this case, the correctional target may be at 1753.00. At the same time, an opposite scenario implies that the price may continue growing to reach 1785.00 without testing the support level.

https://roboforex.com/uploads/roboforecast/roboforex.com/99/2021/Candles/april/16/XAUUSDH4.png

Read more - Japanese Candlesticks Analysis GOLD, NZDUSD, GBPUSD

Re: Forex Technical Analysis & Forecast by RoboForex

Ichimoku Cloud Analysis 19.04.2021 (XAUUSD, NZDUSD, AUDCHF)

XAUUSD, “Gold vs US Dollar”

XAUUSD is trading at 1776.00; the instrument is moving above Ichimoku Cloud, thus indicating an ascending tendency. The markets could indicate that the price may test the cloud’s upside border at 1750.00 and then resume moving upwards to reach 1830.00. Another signal in favor of a further uptrend will be a rebound from the rising channel’s downside border. However, the bullish scenario may no longer be valid if the price breaks the cloud’s downside border and fixes below 1705.00. In this case, the pair may continue falling towards 1635.00.

https://roboforex.com/uploads/roboforecast/roboforex.com/99/2021/Ichimoku/april/19/xauusd.png

Read more - Ichimoku Cloud Analysis XAUUSD, NZDUSD, AUDCHF

399 (edited by RF roboforex 2021-04-20 08:40:44)

Re: Forex Technical Analysis & Forecast by RoboForex

Murrey Math Lines 20.04.2021 (AUDUSD, NZDUSD)

AUDUSD, “Australian Dollar vs US Dollar”

In the H4 chart, AUDUSD is approaching the “overbought area”. In this case, the price is expected to test 8/8, rebound from it, and then resume moving downwards to reach the support at 5/8. However, this scenario may be canceled if the price breaks 8/8 to the upside. After that, the instrument may grow towards the resistance at +1/8.

https://roboforex.com/uploads/roboforecast/roboforex.com/99/2021/Murrey/april/20/1.png

Read more - Murrey Math Lines AUDUSD, NZDUSD

400 (edited by RF roboforex 2021-04-21 08:29:08)

Re: Forex Technical Analysis & Forecast by RoboForex

Forex Technical Analysis & Forecast 21.04.2021

EURUSD, “Euro vs US Dollar”

After completing the ascending wave at 1.2077 along with the descending impulse towards 1.2010, EURUSD is consolidating below the latter level. Today, the pair may start another correction to reach 1.2048 and then resume trading downwards with the short-term target at 1.1982.

https://roboforex.com/uploads/roboforecast/roboforex.com/99/2021/TA/april/21/EURUSDH1.png

Read more - Forex Technical Analysis & Forecast 21.04.2021

Posts: 376 to 400 of 1,098

Pages Previous 1 14 15 16 17 18 44 Next

You must login or register to post a reply

Forex Software → Market Analysis → Forex Technical Analysis & Forecast by RoboForex

Similar topics in this forum