Re: Forex Technical Analysis & Forecast by RoboForex
Fibonacci Retracements Analysis 29.12.2020 (EURUSD, USDJPY)
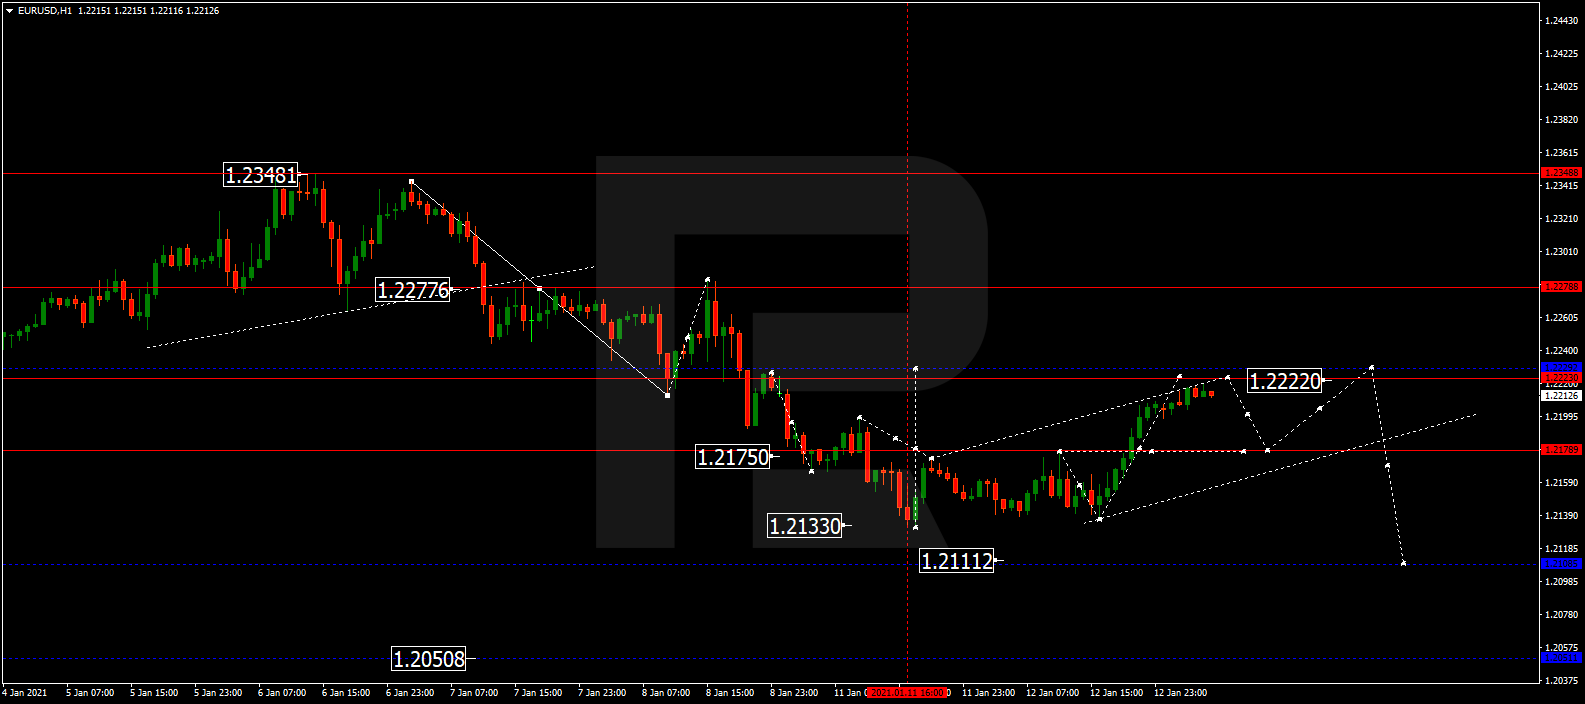
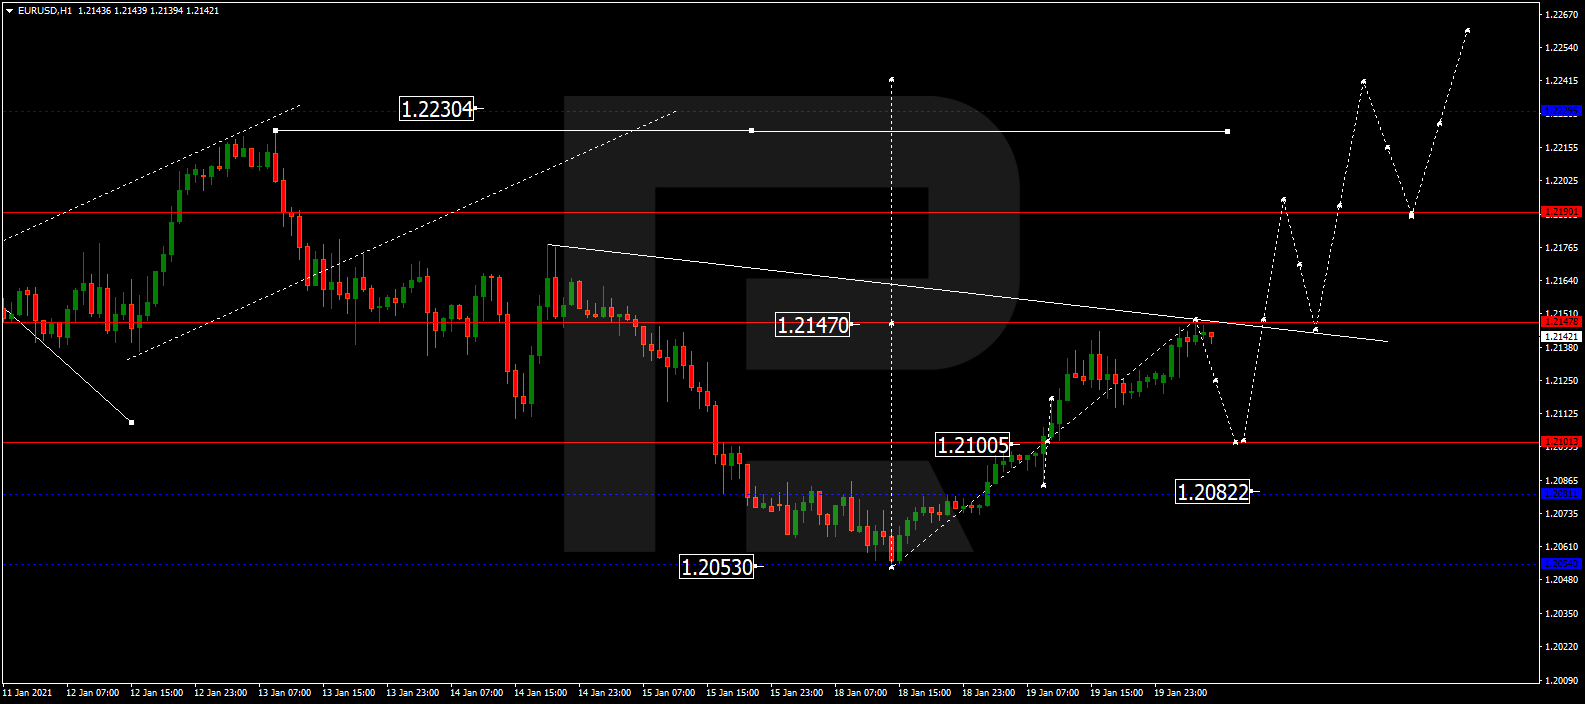
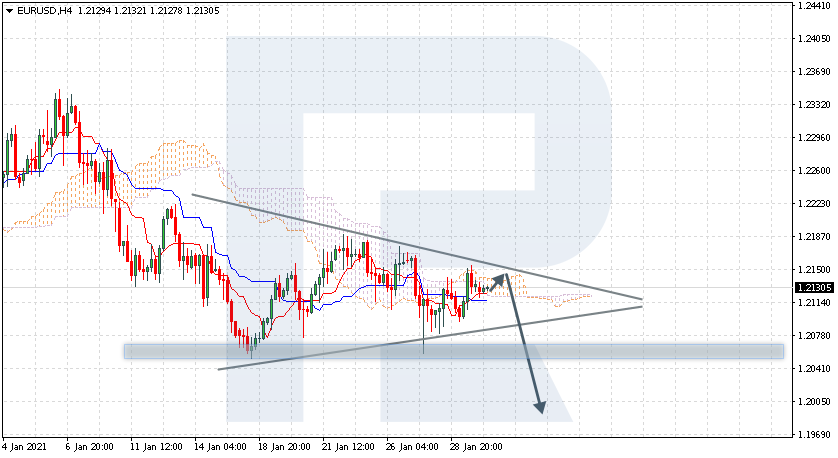
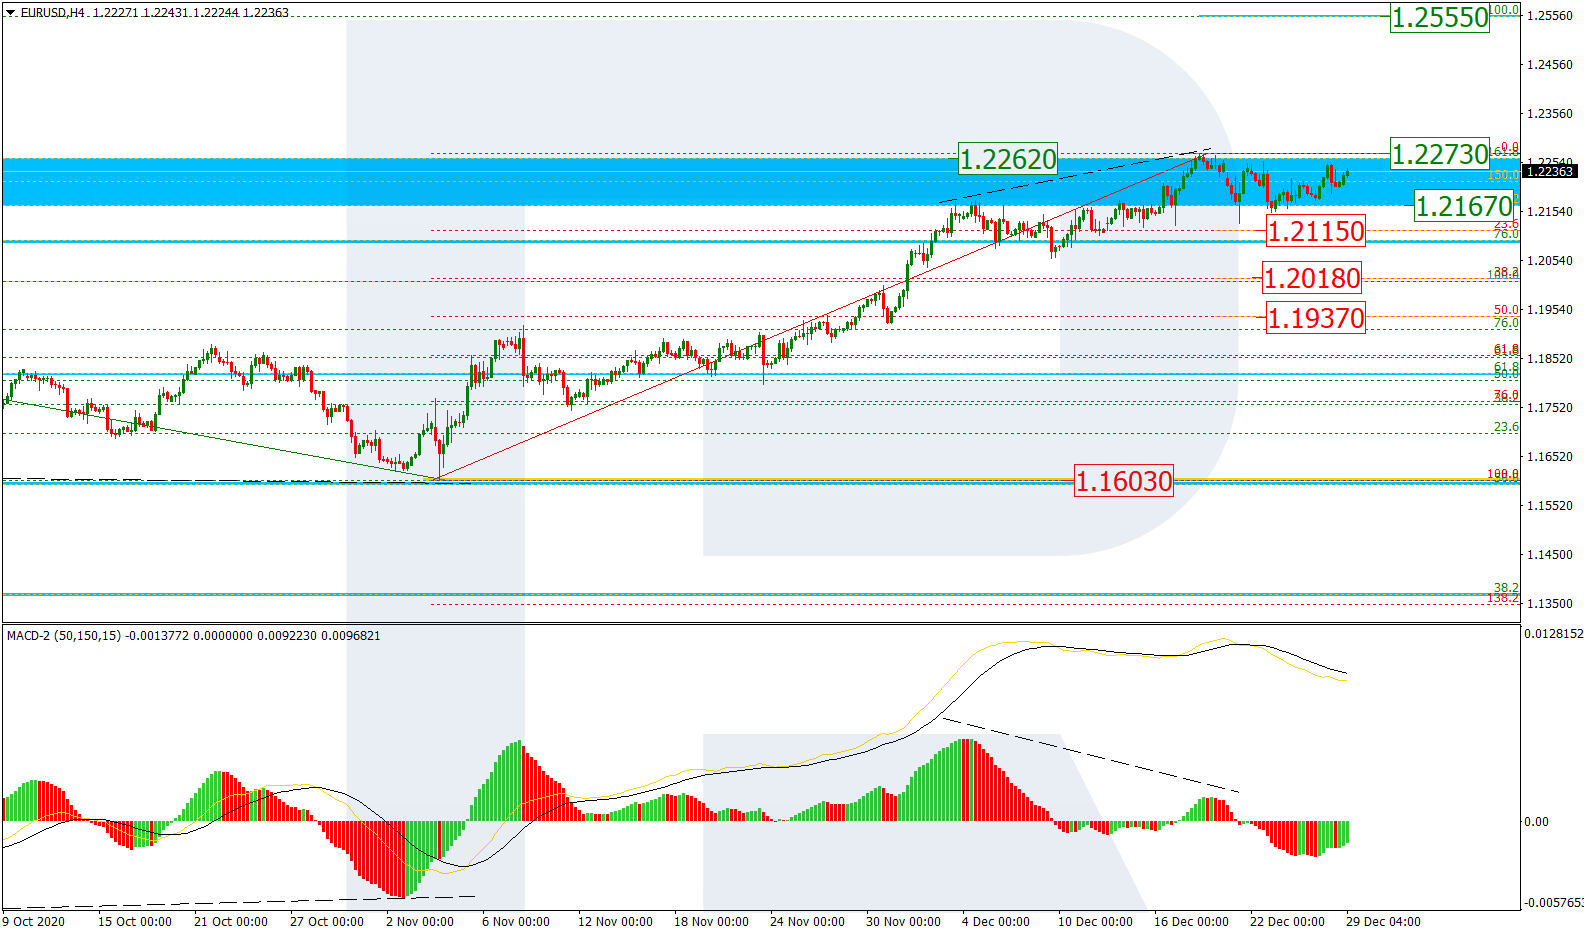
EURUSD, “Euro vs US Dollar”
As we can see in the H4 chart, after a divergence on MACD, EURUSD is stuck within the post-correctional extension area between 138.2% and 161.8% fibo at 1.2167 and 1.2262 respectively. The first descending impulse tried to reach 23.6% fibo at 1.2115 but failed. If the asset fails to break the high at 1.2273, it may start a new decline towards 38.2% and 50.0% fibo at 1.2018 and 1.1937 respectively. However, if the price does break the high, the pair may continue growing to reach the long-term fractal high at 1.2555.
Read more - Fibonacci Retracements Analysis EURUSD, USDJPY