forex software

Create and Test Forex Strategies

forex software

Skip to forum content

Forex Software

Create and Test Forex Strategies

You are not logged in. Please login or register.


(Page 47 of 49)

Forex Software → Market Analysis → Forex Analysis by LiteForex

Pages Previous 1 45 46 47 48 49 Next

You must login or register to post a reply

RSS topic feed

Posts: 1,151 to 1,175 of 1,210

Re: Forex Analysis by LiteForex

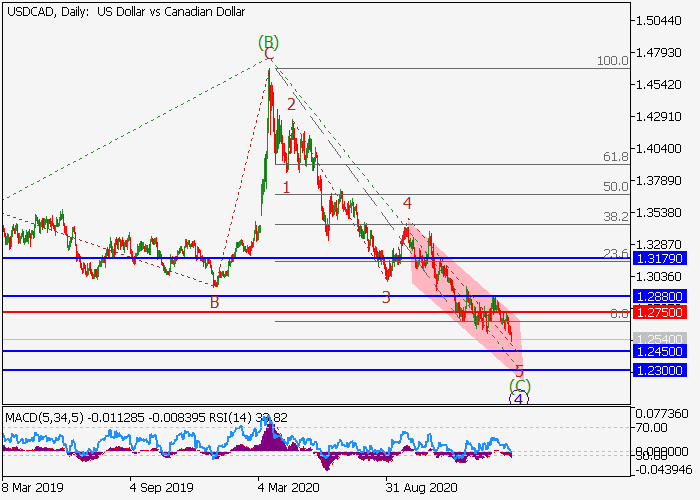
USD/CAD: wave analysis

The pair may fall.

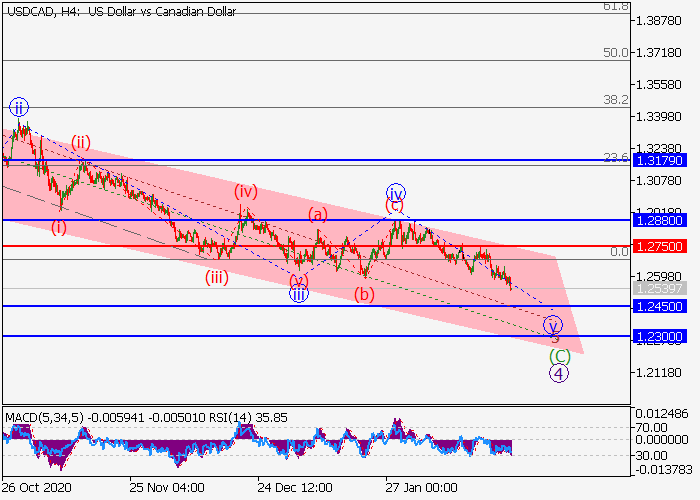
On the daily chart, the downward wave of the higher level (C) of 4 develops, within which the fifth wave 5 of (C) forms. Now, the third wave of the lower level iii of 5 has formed, a local correction has formed as the wave iv of 5, and the wave v of 5 is developing. If the assumption is correct, the pair will fall to the levels of 1.2450–1.2300. In this scenario, critical stop loss level is 1.2750.

https://media.clawshorns.com/uploads/files/7d402f055eb4cb1703f4a9547acf2160.png

https://media.clawshorns.com/uploads/files/35410338e4b88a6ab5df1713e3f385a1.png

Re: Forex Analysis by LiteForex

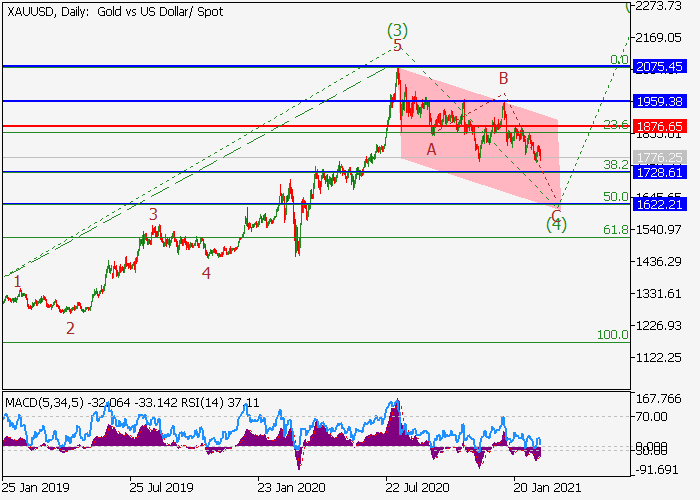
XAU/USD: wave analysis

The pair is in a correction, a fall is possible.

On the daily chart, the third wave of the higher level (3) formed, and a downward correction develops as the fourth wave (4). Now, the wave C of (4) is forming, within which the wave iii of C is developing. If the assumption is correct, the pair will fall to the levels of 1728.61–1622.21. In this scenario, critical stop loss level is 1876.65.

https://media.clawshorns.com/uploads/files/e3559726515e28038f0f181e7d4d85ea.png

https://media.clawshorns.com/uploads/files/1c8a99b59510fc8a5b2dd6224a71fca2.png

Re: Forex Analysis by LiteForex

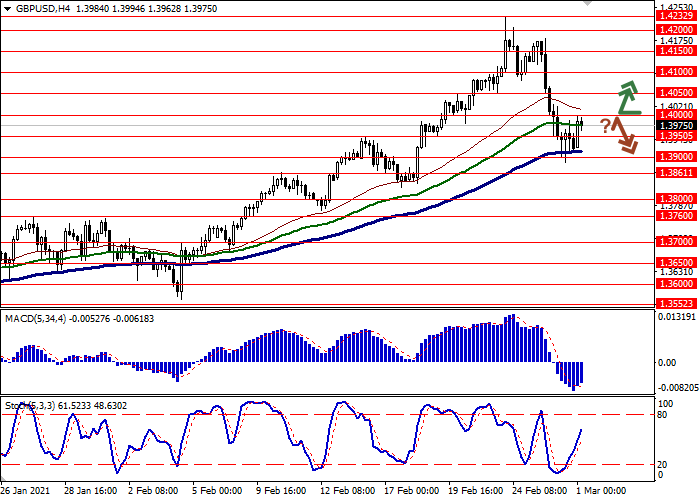
GBP/USD: recovery after correction

Current trend

GBP is correcting against USD in the trading session this morning, recovering from a confident decline at the end of the previous trading week. The weakening of GBP was facilitated by a large-scale correction in the bond market, which provoked a decrease in demand for risky assets. GBP was also under pressure from the comments of the Bank of England officials. Last Friday, the chief economist of the regulator, Andy Haldane, made a speech in which he pointed to the risks of inflation, noting that it will be extremely difficult to contain it as the global economy recovers from the effects of the pandemic.

Meanwhile, investors continue to praise the effectiveness of the UK coronavirus vaccination campaign, expecting the latest travel restrictions to be fully lifted by summer or fall 2021. Today, traders are awaiting the release of February UK Manufacturing PMI from Markit. Also, data on the dynamics of consumer credit in January will be released.

Support and resistance

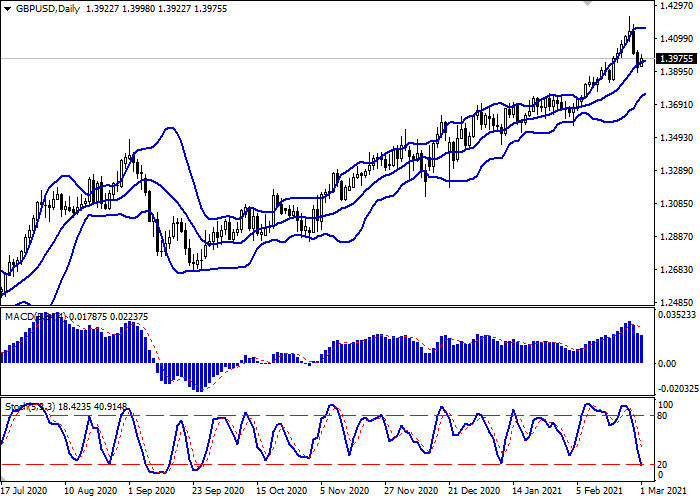
On the D1 chart, Bollinger Bands demonstrate a tendency to reverse into a horizontal plane. The price range is narrowing, reflecting the emergence of ambiguous dynamics of trading in the short term. MACD is going down preserving a stable sell signal (located below the signal line). Stochastic demonstrates similar dynamics but its line is rapidly approaching its lows, pointing at risks of oversold GBP in the ultra-short term.

Resistance levels: 1.4000, 1.4050, 1.4100, 1.4150.
Support levels: 1.3950, 1.3900, 1.3861, 1.3800.

https://media.clawshorns.com/uploads/files/430db0afec23efdf0f8aca7c6f40bf64.png

https://media.clawshorns.com/uploads/files/682c1f015a34ad0e2043c4edee81531f.png

Re: Forex Analysis by LiteForex

USD/CAD: recovery after a minor correction

Current trend

Today during the Asian session, the USD/CAD pair grows moderately, recovering from Monday's decline, which did not allow it to renew local highs.

Yesterday’s USD weakening was largely technical since the fundamental picture did not change significantly. Some pressure on the price was exerted by the decline in the yield of American bonds, however, positive US macroeconomic statistics helped to smooth out this negative effect. Thus, ISM Manufacturing PMI for February rose from 58.7 to 60.8 points, while the forecasts assumed growth only to 58.8 points. Markit Manufacturing PMI rose from 58.5 to 58.6 points, in line with market expectations.

On Tuesday, investors are focused on a block of statistics on the dynamics of Canada's GDP for December and the fourth quarter of 2020. According to preliminary data, the country's economy slowed significantly at the end of last year, which is associated with continuing restrictions due to the coronavirus pandemic.

Support and resistance

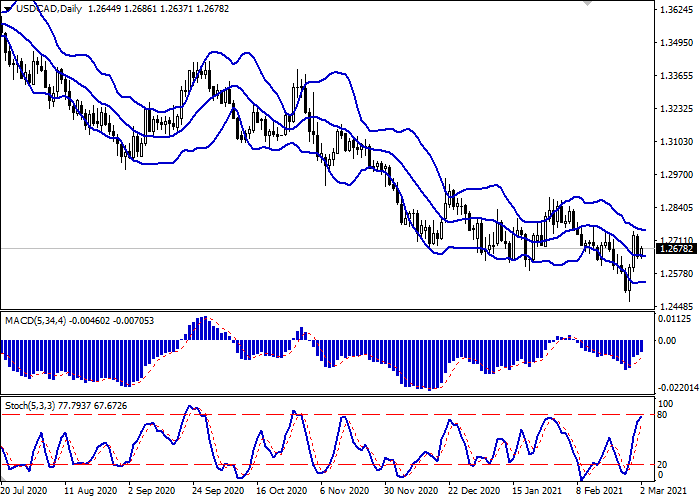
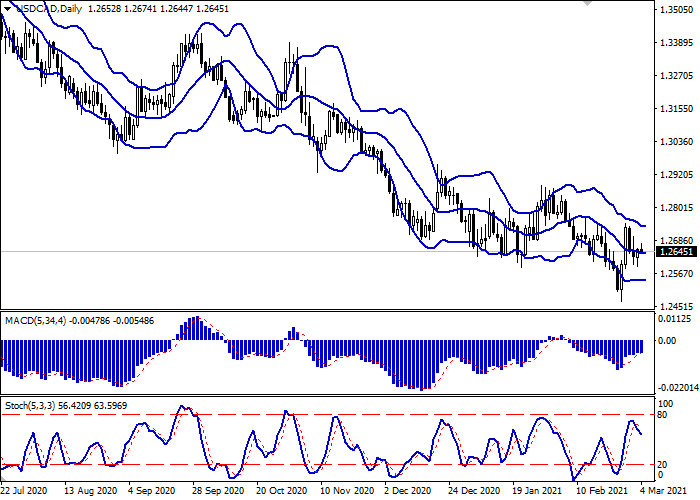
On the daily chart, Bollinger Bands reverse horizontally. The price range tries to consolidate but remains spacious enough for the current level of activity in the market. MACD grows, maintaining a strong buy signal (the histogram is above the signal line). Stochastic grows but rapidly approaches its highs, signaling that the instrument may become overbought in the ultra-short term.

It is better to keep the current long positions until the signals from technical indicators are clarified.

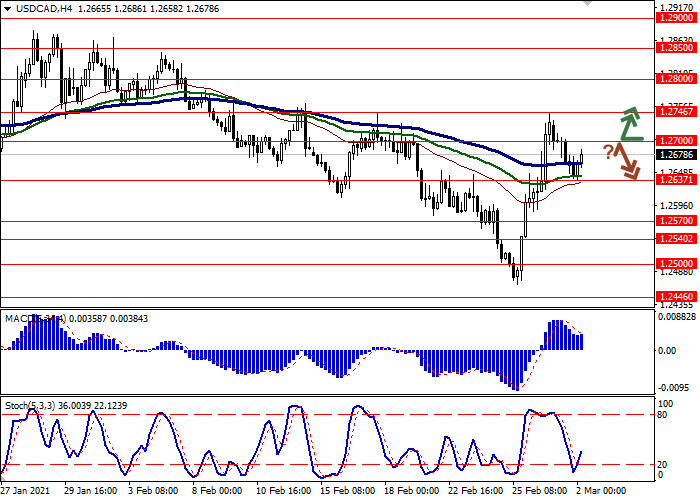
Resistance levels: 1.2700, 1.2746, 1.2800, 1.2850.
Support levels: 1.2637, 1.2570, 1.2540, 1.2500.

https://media.clawshorns.com/uploads/files/3e83b49b813adee4bfaf52b6addf0144.png

https://media.clawshorns.com/uploads/files/cfa8fc905602a206a2951918caf585e7.png

Re: Forex Analysis by LiteForex

WTI Crude Oil: prices remain under pressure

Current trend

Today, during the Asian session, oil prices are slightly increasing, correcting after a three-day decline, which led to the consolidation of the instrument below the psychological level of $60 per barrel.

Investors expect the emergence of new drivers on the market, which may be the results of tomorrow's OPEC+ meeting. Analysts expect that the cartel may decide to ease restrictions on oil supplies, which could put additional pressure on quotes.

The American Petroleum Institute's report on energy reserves released yesterday had a negative impact on the instrument. For the week of February 26, the figure rose sharply by 7.356 million barrels after increasing by 1.026 million in the previous period. On Wednesday, traders await the publication of the final report from the US Department of Energy. Forecasts assume a decrease in inventories for the week of February 26 by 1.85 million barrels after rising by 1.285 barrels in the previous period.

Support and resistance

On the daily chart, Bollinger Bands reverse into a horizontal plane. The price range is narrowing slightly, reflecting the emergence of multidirectional dynamics in the past few weeks. The MACD indicator is going down, maintaining a strong sell signal (the histogram is below the signal line). Stochastic is also directed downwards but it is near its lows, which indicates that the instrument may become oversold in the ultra-short term.

Resistance levels: 60.50, 62.18, 63.00, 64.00.
Support levels: 58.51, 57.25, 55.00, 53.00.

https://media.clawshorns.com/uploads/files/47e146b6f83b64b89c5f11331c7541ad.png

https://media.clawshorns.com/uploads/files/bfb1a42a59e0cb79e839e451f64d9a82.png

Re: Forex Analysis by LiteForex

USD/CAD: US macro statistics restrain the “bullish” activity

Current trend

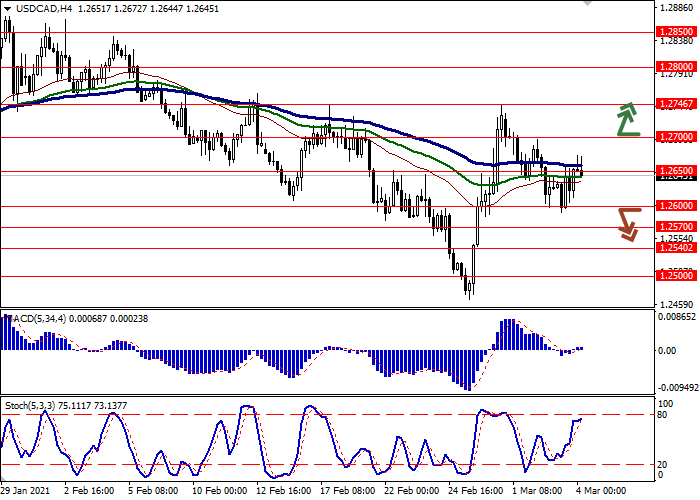
Today during the Asian session, the USD/CAD pair trades ambiguously, consolidating near the level of 1.2650.

The US dollar retains its upward momentum, formed yesterday. However, the American macroeconomic statistics slightly restrain the “bullish” activity on the instrument. In particular, investors reacted negatively to the release of the ADP Nonfarm Payrolls for February and are eagerly awaiting the publication of the final data on the US labor market at the end of the week.

The data from Canada were slightly better but did not significantly affect the instrument. Building permits for January rose sharply by 8.2% MoM after declining by 4.4% MoM for the previous period.

Support and resistance

On the daily chart, Bollinger bands are moving flat. The price range is trying to consolidate but remains wide enough for the current level of market activity. The MACD indicator is growing, maintaining a poor buy signal (the histogram is above the signal line). Stochastic, having not reached the border of the overbought area, reversed into a downward plane, responding to strong "bearish" pressure at the beginning of the week.

To open new trading positions, it is better to wait for the signals from technical indicators to be clarified.

Resistance levels: 1.2650, 1.2700, 1.2746, 1.2800.
Support levels: 1.2600, 1.2570, 1.2540, 1.2500.

https://media.clawshorns.com/uploads/files/3a137298a1c89c6c9c4fff381ee3058a.png

https://media.clawshorns.com/uploads/files/016ddca01722253ce0c546b3341de81e.png

Re: Forex Analysis by LiteForex

EUR/USD: strong USD hinders the growth of the pair

Current trend

The day before, the EUR/USD pair fell by 93 points, which was catalyzed by the speech of the US Fed Chair Jerome Powell.

Investors began to get rid of US stocks and bonds after the head of the regulator disappointed the markets, refraining from decisive action against the growth of Treasury bond yields, considering the fears of the traders far-fetched. He made it clear that at the moment no steps are being prepared to contain the rise in interest rates. The rhetoric of the Fed also contributed to the fall in quotes of the indices: the S&P 500 closed at its lowest level in five weeks, losing 1.3%, while rates on 10-year bonds exceeded 1.5%. Further downtrend in stock indices is likely to lead to the movement of investor capital to more reliable assets such as USD and gold.

The European Central Bank also does not see the need for decisive action to combat the rise in bond yields, believing that the risk to the economy can be managed through verbal intervention and the flexibility of quantitative easing programs. In turn, high yields on government bonds pose a problem for the eurozone as they are used by banks as a benchmark for lending. According to the ECB representatives, at the moment there is no need to expand the emergency bond purchase program, which is EUR 1.85 trillion. If at the next meeting the regulator voices its concerns about the high rate of EUR, this may negatively affect the quotes in the near future.

Support and resistance

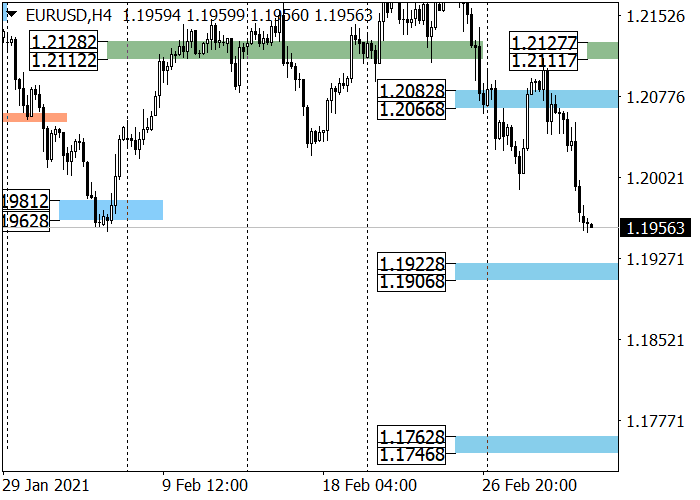
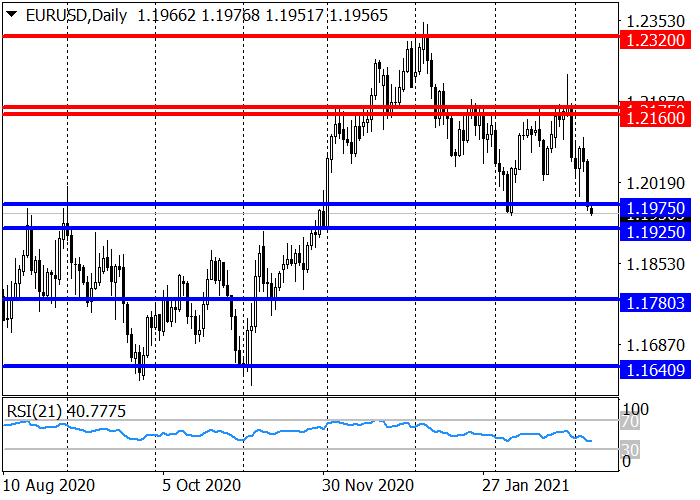
After holding resistance at 1.2175 last month, EUR rate dropped to the support area of 1.1975–1.1925, in case of a breakdown of which, the instrument will continue to fall with the target at 1.1740.

This week, the medium-term trend changed to a downtrend (the target zone 1.2082–1.2066 was broken down). The next target is at support at 1.1922–1.1906. The border of the new trend is shifting to the levels of 1.2127–1.2111.

Resistance levels: 1.2066, 1.2127.
Support levels: 1.1906, 1.1780.

https://media.clawshorns.com/uploads/files/0fa3011526a1314efc5bf015ffe86c15.png

https://media.clawshorns.com/uploads/files/9ea1ce5ae74e6491fdc4302320c9ab6b.png

Re: Forex Analysis by LiteForex

Morning Market Review

EUR/USD

Today, during the Asian session, the EUR/USD pair is growing as part of the correction, recovering after a confident "bearish" rally, which led to the renewal of local minimums of November 24, 2020. The current growth of EUR is caused only by technical factors, while the fundamental picture on the market changes insignificantly. Monday’s macroeconomic data from Germany put additional pressure on the instrument. Industrial production fell by 2.5% MoM for January after rising by 1.9% MoM for the previous month. Analysts had expected the index to rise by 0.2% MoM. Also, it declined by 3.9% YoY after rising by 1.0% YoY for the previous period. The markets were slightly supported only by the indicator of investor confidence for March from Sentix, which rose from –0.2 to 5 points against the forecast of +1.9 points. On Tuesday, European investors are focusing on the renewed data on the dynamics of GDP in the euro area for the fourth quarter of 2020.

GBP/USD

Today during the Asian session, the GBP/USD pair is growing slightly, developing the “bullish” signal formed yesterday. Now the activity of buyers in the market has not changed the balance of power for the instrument, even in the short term but new drivers are expected soon. USD is in demand after the publication of a strong report on the US labor market, as well as in anticipation of the approval of a program to support the national economy of $1.9 trillion. The bill passed a vote in the Senate, having undergone several amendments. Now it will be returned to the House of Representatives, after which he will go for approval of US President Joe Biden, who hopes to complete the process this week. In turn, on Tuesday, GBP was supported by statistics on the dynamics of retail sales from the Confederation of British Industrialists. In February, the indicator accelerated from +7.1% YoY to +9.5% YoY, beating the forecasts of +7.0% YoY.

NZD/USD

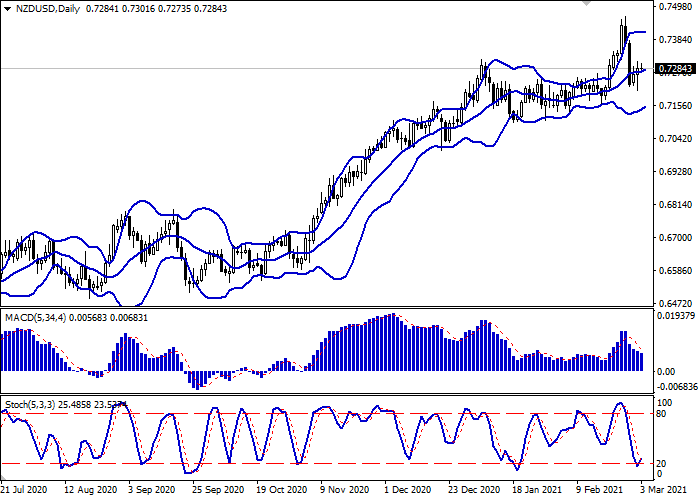
Today, during the Asian session, the NZD/USD pair is declining, developing a “bearish” trend in the short term and trading near local lows since mid-January 2021. The demand for commodity assets remains moderate, especially against the backdrop of positive macroeconomic signals from the US economy and the readiness of congressmen to approve a new package of large-scale support measures. The New Zealand dollar reacted positively to the data block from China on the dynamics of imports and exports, which indicates a further recovery in trade activity around the world. However, last week, the PRC set a GDP growth target at +6%, which was worse than market expectations of +8%. Macroeconomic statistics from New Zealand put additional pressure on the instrument on Tuesday. There, the volume of sales in the industrial sector for the fourth quarter of 2020 slowed down from +17.3% QoQ to +0.5% QoQ. The index of business optimism from the RBNZ for March fell sharply from 7 to 0 points.

USD/JPY

Today during the Asian session, the USD/JPY pair is steadily growing, developing a powerful “bullish” rally since February 23 and renewing record highs since June 2020. USD is in strong demand against the backdrop of positive macroeconomic publications from the United States, as well as anticipating a new impetus for the recovery of the American economy after the approval of the stimulus bill of $1.9 trillion. JPY, in turn, is retreating after the release of statistics from Japan. Thus, the revised data reflected a slowdown in GDP for the fourth quarter of 2020 from +3% QoQ to +2.8% QoQ. In annual terms, the growth rate of the Japanese economy was revised from +12.7% YoY to +11.7% YoY.

XAU/USD

Today, during the Asian session, gold prices are rising within a correction, recovering from another decline yesterday, which led to the renewal of record lows since June 2020. The reason for the next sales at the beginning of the week was the strong position of the US currency and the yield on American securities, which remains quite high and attractive. Gold is supported only by expectations of the final approval of a new package of measures to support the US economy of $1.9 trillion, which is expected to lead to a jump in inflationary pressures within the country

Resistance levels: 1.2066, 1.2127.
Support levels: 1.1906, 1.1780.
Re: Forex Analysis by LiteForex

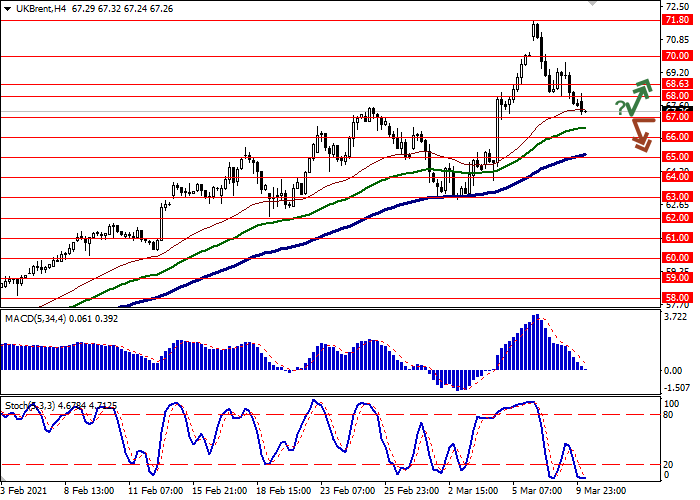
Brent Crude Oil: oil prices decline

Current trend

Today during the Asian session, oil prices slightly decline, developing the corrective momentum that was formed earlier when the instrument was trading at record highs since January 2020.

Earlier this week, the instrument was supported by attacks by Yemeni Houthi forces on oil production facilities in Saudi Arabia. Also, investors expect a fairly restrained OPEC+ policy, which does not provide for a sharp increase in supply volumes.

In turn, the growing dollar, which received a positive impulse after the decline in the yield of American bonds, exerts pressure on the quotes. An additional negative signal was another API report on US energy reserves. For the week of March 5, the figure again rose sharply by 12.792 million barrels after increasing by 7.356 million barrels in the previous period. On Wednesday, the focus of investors' attention is the report on the oil reserves from the US Department of Energy.

Support and resistance

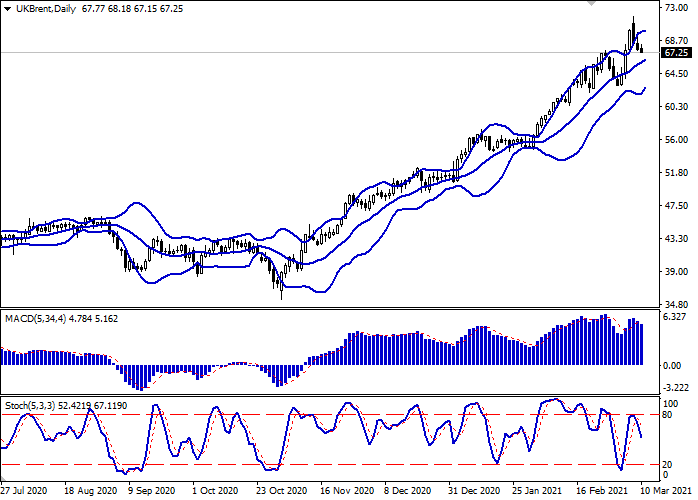
Bollinger bands grow steadily on the daily chart. The price range narrows from the bottom, reflecting the ambiguous nature of trading in the short term. MACD falls, maintaining a fairly strong sell signal (the histogram is below the signal line). Stochastic falls, reversed at the level of 80, which reflects that the instrument is overbought in the ultra-short term.

It is better to keep the current short positions and open new ones in the short and/or super short term.

Resistance levels: 68.00, 68.63, 70.00, 71.80.
Support levels: 67.00, 66.00, 65.00, 64.00.
https://media.clawshorns.com/uploads/files/d23fa9401a585d9571d82f909fd3f1ee.png

https://media.clawshorns.com/uploads/files/7b1f401616f039063ea38e8e61f108df.png

Re: Forex Analysis by LiteForex

WTI Crude Oil: US Department of Energy predicts a decline in prices

Current trend

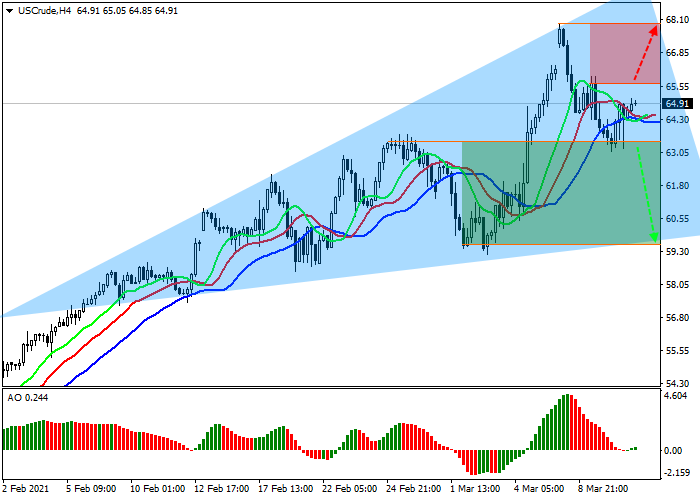
Oil quotes are declining within the correction, trading at 64.90.
Yesterday, the US Department of Energy released a renewed forecast for energy prices for the near term. According to the report, this year, the average oil price will be $60.67 per barrel, and in 2022 it will decrease to an average value of $58.51 per barrel. The forecast deals with Brent Crude Oil, therefore, WTI Crude Oil will cost 2–3 dollars cheaper, which is significantly lower than the current level.

Another factor putting pressure on the instrument is the reports of the American Petroleum Institute (API) and the Energy Information Administration (EIA). For the second week in a row, they report a significant increase in oil stocks. According to the API, the figure rose by 12.792M barrels, and according to the EIA, the increase was 13.798M. The US oil industry continues to experience an oversupply after the freeze, which temporarily paralyzed refining.

Support and resistance

Locally, the price moves within the Expanding formation pattern, forming another wave of decline. Technical indicators are in a state of uncertainty. Alligator indicator’s EMA fluctuations range narrowed, and the histogram of the AO oscillator reached the transition level.

Resistance levels: 65.70, 68.00.
Support levels: 63.40, 59.50.

https://media.clawshorns.com/uploads/files/92e168f21a9486918b3f05463cad504e.png

Re: Forex Analysis by LiteForex

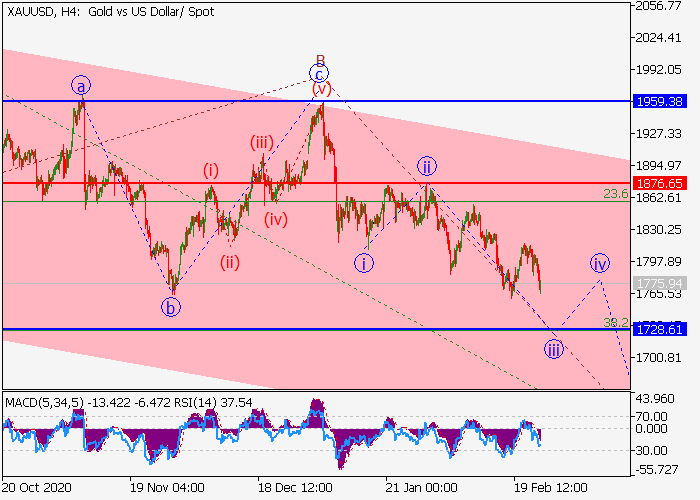
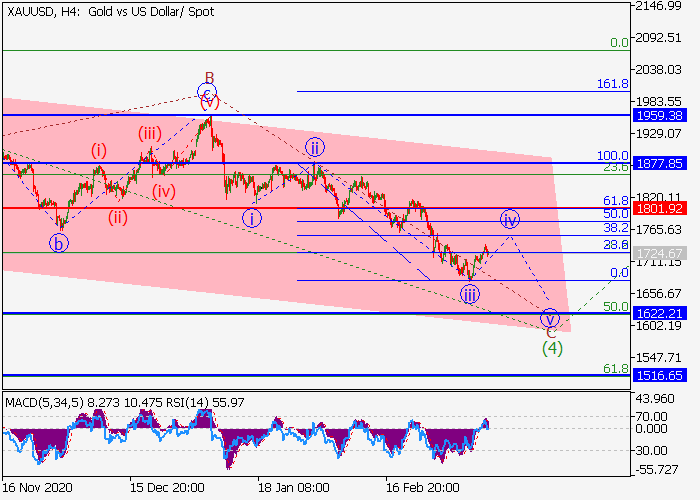
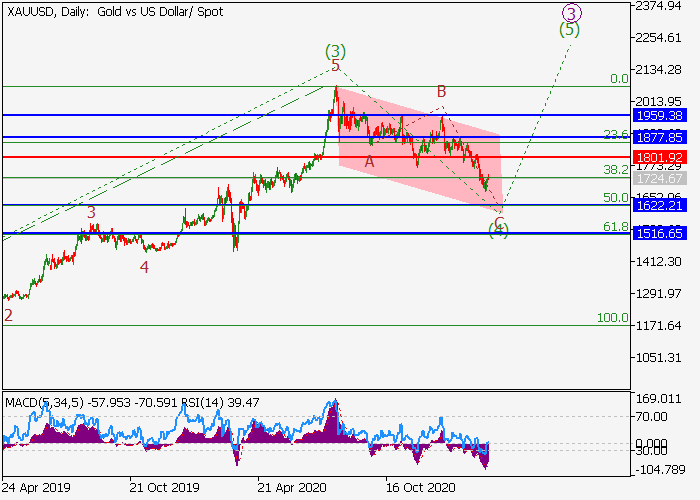
XAU/USD: wave analysis

The pair is in a correction, a fall is possible.

On the daily chart, the third wave of the higher level (3) formed, and a downward correction develops as the fourth wave (4). Now, the wave C of (4) is forming, within which the wave iii of C has formed, and a local correction is developing as the wave iv of C. If the assumption is correct, after the end of the correction, the pair will fall to the levels of 1622.21–1516.65. In this scenario, critical stop loss level is 1801.92.

https://media.clawshorns.com/uploads/files/ac706385da454a033df367ae116da2cf.png

https://media.clawshorns.com/uploads/files/2283c2f4cd8508a2bae1fff15181113c.png

Re: Forex Analysis by LiteForex

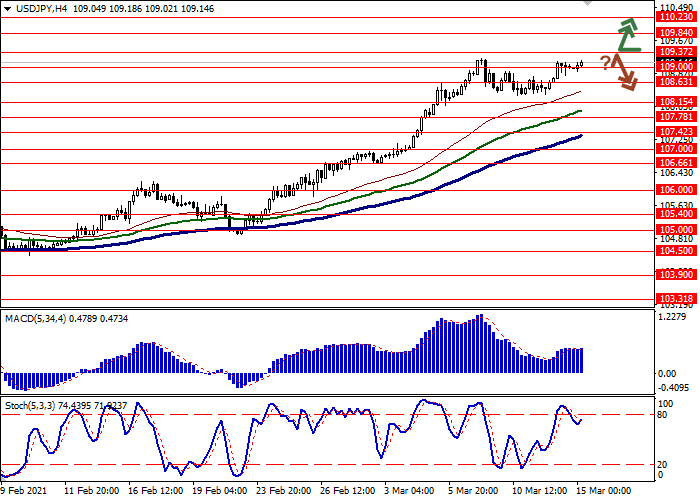
USD/JPY: return to the record highs

Current trend

USD continues to rally against JPY during today's morning session, trading near record highs and again trying to consolidate above the psychological level of 109.00. USD is in high demand amid yet another rise in the yield on US Treasury bonds. In addition, low demand for safe assets puts additional pressure on JPY.

Macroeconomic statistics from Japan published today does not have a significant impact on the dynamics of the instrument. Machinery Orders in Japan in January decreased by 4.5% MoM after growth by 5.2% MoM in the previous month. Analytical forecasts assumed a decrease in the indicator by 5.5% MoM. On an annualized basis, the indicator slowed sharply from +11.8% YoY to +1.5% YoY, which nevertheless was better than the negative forecasts of analysts at –0.2% YoY.

Support and resistance

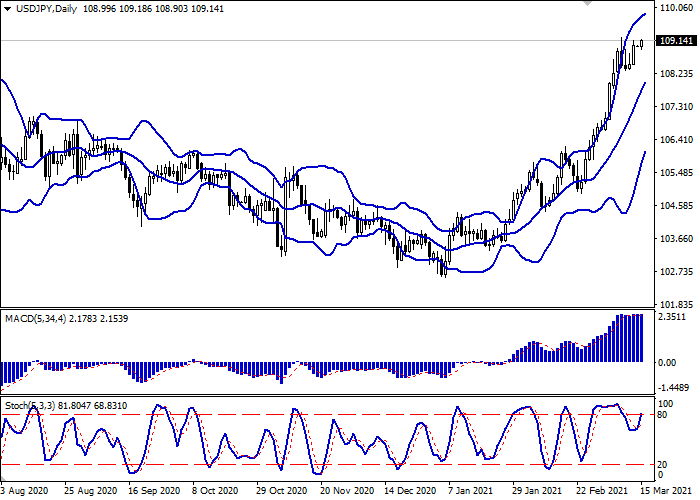
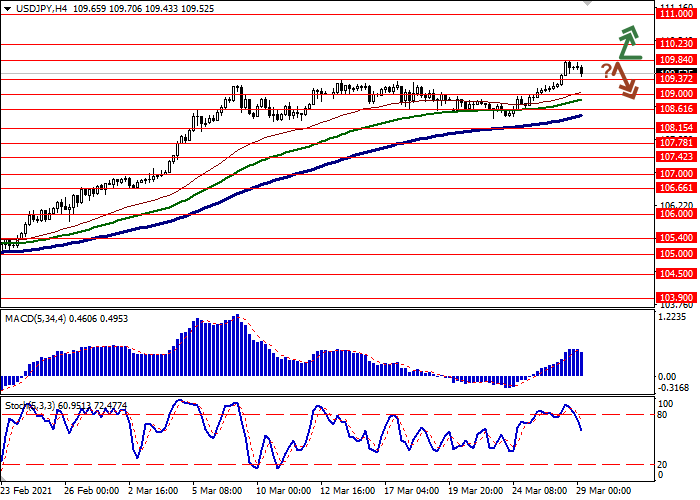
Bollinger Bands in D1 chart show stable growth. The price range is narrowing, reflecting ambiguous dynamics of trading in the short term. MACD indicator is growing preserving a weak buy signal (located above the signal line). Stochastic reversed upwards again after a short decline last week. The indicator readings continue to indicate that USD is overbought in the ultra-short term.

Current showings of the indicators do not contradict the further development of the "bullish" trend in the short term.

Resistance levels: 109.37, 109.84, 110.23.
Support levels: 109.00, 108.63, 108.15, 107.78.

https://media.clawshorns.com/uploads/files/7cf7e21effa78603ea6f75efaaf10f59.png

https://media.clawshorns.com/uploads/files/b220585592624042dc7b2ac32e9132b3.png

Re: Forex Analysis by LiteForex

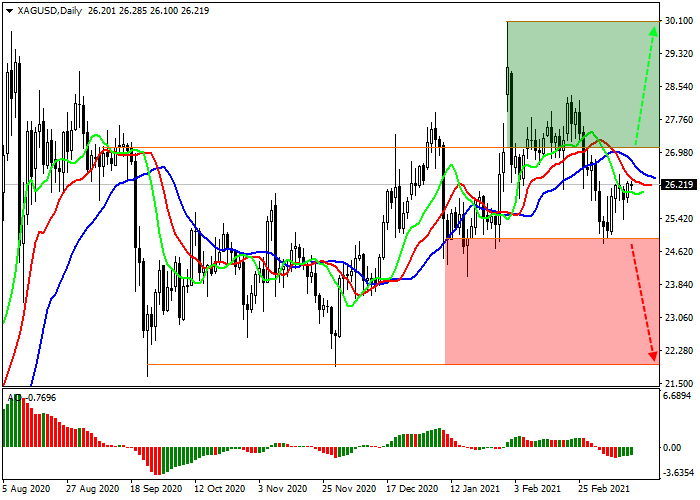
XAG/USD: return to upward dynamics

Current trend

Silver contracts are correcting upwards, trading above the level of $26.2 per ounce.

The quotes returned to their usual dynamics. Short-term factors in the form of mass purchase of assets by a certain group of private traders ceased to operate, and the main factors restraining the precious metals market began to come to the fore again, the main among which was the yield on US bonds. This indicator for key 10-year securities has retreated from the peaks of 1.634% and is currently at the level of 1.595%. Another reason that can provide short-term support for silver is the "monetization" of fiscal stimulus for the US economy of $1.9T, the first receipts to citizens' accounts for which are expected this week.

At the same time, the number of positions in silver is decreasing, and according to the Commodity Futures Trading Commission (CFTC), last week it was 36.1K against 39.6K a week earlier.

Support and resistance

On the global chart of the asset, after an active decline, the price returned to the upward trend. Technical indicators are in a sell state but are ready to reverse. The fluctuation range of the EMA on the Alligator indicator began to narrow, and the histogram of the AO oscillator is forming upward bars.

Support levels: 24.90, 21.90.
Resistance levels: 27.13, 30.00.

https://media.clawshorns.com/uploads/files/c987b58de7feee38f55c7c925f859e82.png

Re: Forex Analysis by LiteForex

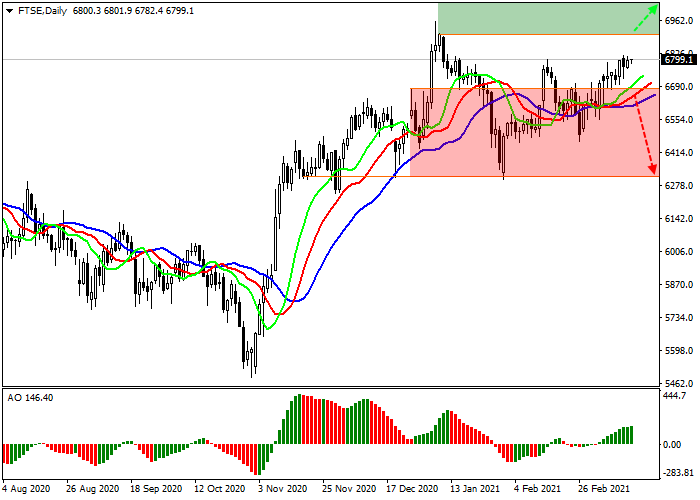
FTSE 100: bond yields hold back the growth of the index

Current trend

The FTSE 100 index shows a lateral trend, trading at 6800.0.

World stock indices continue trading near their highs, but recently the growth rates have noticeably decreased. The key point to which investors are turning their attention is the significant fluctuations in the bond markets of the leading countries.

The global uptrend in bonds began with the growth of securities in the US, but now this dynamics is supported by the markets of other countries. The yield on government bonds of Great Britain also showed an increase: over the last month, one can note an increase in the yield of annual bonds from –0.024% to –0.005%, five-year bonds growth from 0.137% to 0.364% and ten-year bonds increase from 0.623% to 0.785%.

The growth leaders in the index are: British Land Company Plc. (+4.60%), Rolls-Royce Holdings Plc. (+4.11%), Land Securities Group Plc. (+4.02%), AstraZeneca Plc. (+3.64%). Among the leaders of the decline are: Just Eat Takeaway (–2.15%), Royal Dutch Shell Plc. Class B (–1.84%) and CRH Plc. (–1.63%).

Support and resistance

Index quotes continue to correct, moving within the global sideways channel. Technical indicators are in a state of purchase. The fast EMAs of the Alligator indicator are above the signal line, and the histogram of the AO oscillator is in the positive zone.

Resistance levels: 6900.0, 7000.0.
Support levels: 6675.0, 6300.0.

https://media.clawshorns.com/uploads/files/b793a59912c6fa384ab8390f153b3ea8.png

Re: Forex Analysis by LiteForex

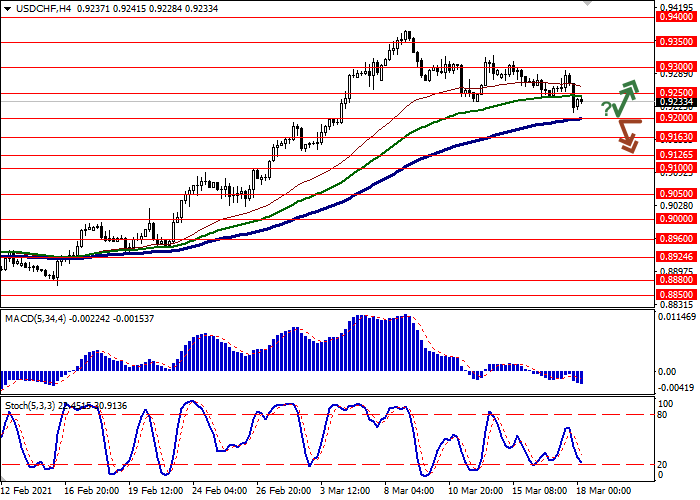
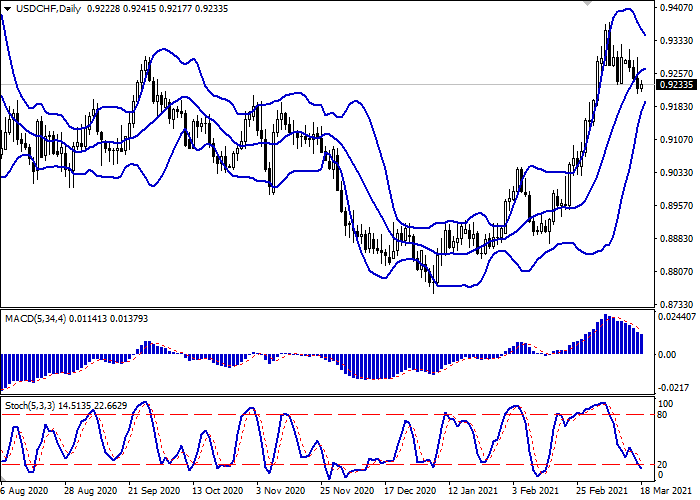
USD/CHF: dollar remains under pressure

Current trend

Today, during the Asian session, the USD/CHF pair grows slightly, correcting after yesterday’s active decline, which was caused by the US Fed’s Meeting Minutes. As expected, the regulator confirmed its commitment to low interest rates at least until the end of 2023, raising its forecasts for the GDP growth for the next few years. The problematic issue of the yield of US Treasury bonds was again left without due attention. The head of the department, Jerome Powell, does not see a threat to the current level of inflation, the target of which is the level of 2%.

On Thursday, investors are focused on the Swiss statistics on the dynamics of imports and exports for February and data on the dynamics of manufacturing inflation for the same period. In the US, Initial Jobless Claims will be released. The index may drop below 700K for the first time in a long time.

Support and resistance

On the daily chart, Bollinger Bands reverse into a horizontal plane. The price range actively narrows, reflecting the emergence of ambiguous dynamics in the short term. MACD falls, maintaining a strong sell signal (the histogram is below the signal line). Stochastic falls but is near its lows, indicating that USD may become oversold in the ultra-short term.

It is better to keep current short positions in the short-term and/or ultra-short term until the signals from technical indicators are clarified.

Resistance levels: 0.9250, 0.9300, 0.9350, 0.9400.
Support levels: 0.9200, 0.9163, 0.9126, 0.9100.

https://media.clawshorns.com/uploads/files/65dacb8a152df91b3ba27995de4d2117.png

https://media.clawshorns.com/uploads/files/7fe96dc5b6481a518f2c1900198716aa.png

Re: Forex Analysis by LiteForex

USD/CAD: the dollar is consolidating

Current trend

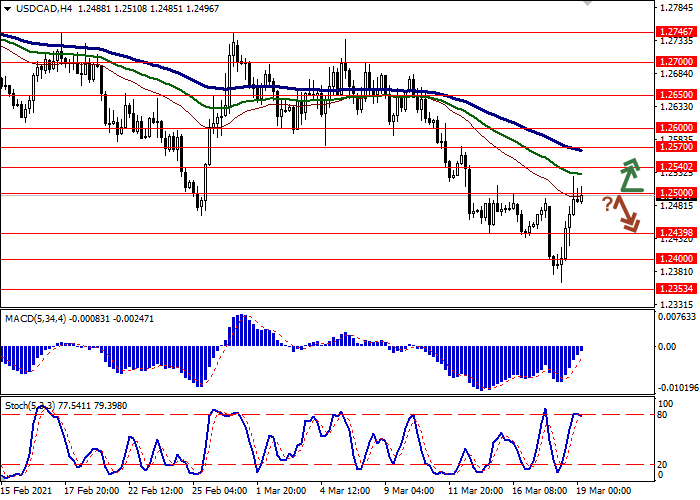
Today, during the Asian session, the USD/CAD pair is showing flat dynamics, consolidating near the level of 1.2500.

On Thursday, the US dollar was actively strengthening, responding to the growth of US Treasury bond yields. Yesterday, the 10-year notes renewed 13-month highs, rising above 1.70%, supported by the generally positive sentiment regarding the fundamental outlook for the US economy. Earlier, the currency declined after the publication of the minutes of the US Feds meeting, which reflected the reluctance of the regulator to respond to the surge in yields and also reduced the degree of speculation on a possible increase in interest rates.

Yesterday, the Canadian currency was negatively impacted by the ADP employment report for Canada. For February, the figure fell by 100.8K after falling by 65.8K for the previous period.

Support and resistance

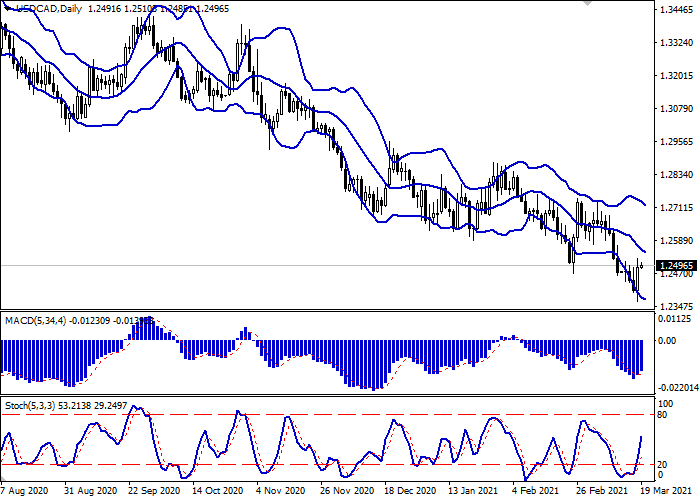
On the daily chart, Bollinger bands are actively declining. The price range is narrowing, indicating ambiguous trading dynamics in the short term. The MACD indicator reversed upwards, forming a new buy signal (the histogram is above the signal line). Stochastic maintains a confident upward trend, signaling in favor of further development of the “bullish” dynamics in the ultra-short term.

It is better to keep current long positions and open new ones in the short-term and/or super-short term until the signals from technical indicators are clarified.

Resistance levels: 1.2500, 1.2540, 1.2570, 1.2600.
Support levels: 1.2439, 1.2400, 1.2353, 1.2300.

https://media.clawshorns.com/uploads/files/5d080702b9c1685e54ab4e9fe9d8f365.png

https://media.clawshorns.com/uploads/files/7bd4ae28bb5759c7912685cd17332765.png

Re: Forex Analysis by LiteForex

Brent Crude Oil: oil prices are consolidating

Current trend

On Friday, the price of Brent crude oil rose moderately, adding more than 1% and regaining some of the previous day’s losses. On Thursday, investors reacted sharply negatively to the worsening of the epidemiological situation in Europe, where new restrictive measures provoked fears of a further decline in fuel demand. Now, the consolidated forecast of the three main industry organizations assumes an increase in oil demand for 2021 by 5.5 million barrels per day, which is significantly lower than the values that OPEC proposed in the summer of 2020.

The situation in Iran exerts some pressure on the instrument. Iranian oil imports to China have been hitting record highs in recent months, while the market anticipates further easing of US sanctions on Tehran.

Published Friday, Baker Hughes' report on active oil platforms in the US showed another increase from 402 to 411 units, reflecting a gradual growth in production volumes.

Support and resistance

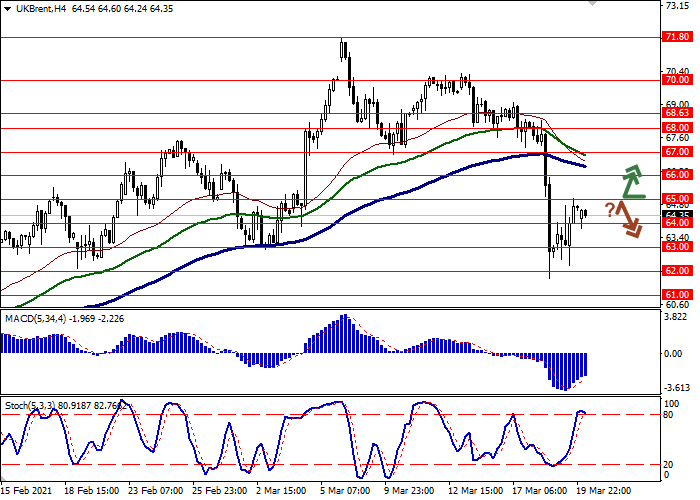
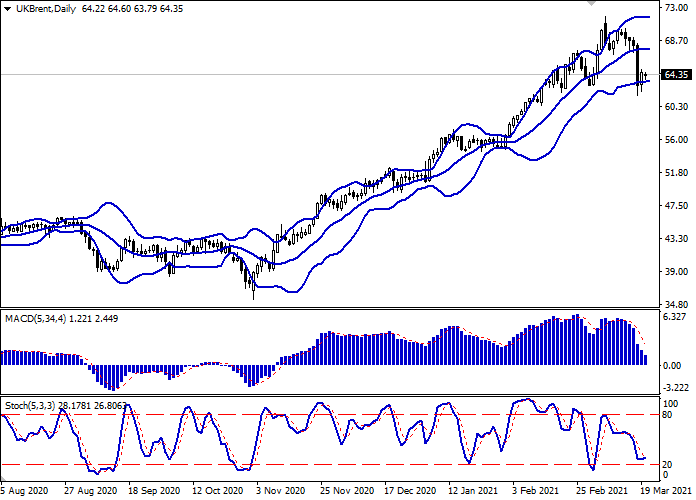
On the daily chart, Bollinger Bands reverse into a horizontal plane. The price range remains practically unchanged, remaining spacious enough for the current level of activity in the market. The MACD declines, maintaining a strong sell signal (the histogram is below the signal line). Stochastic, having approached the level of 20, reversed into a horizontal plane, responding to an attempt to grow the instrument at the end of last week.

Resistance levels: 65.00, 66.00, 67.00, 68.00.
Support levels: 64.00, 63.00, 62.00, 61.00.

Больше аналитики в блоге компании: https://ru.lite.forex/blog/analysts-opinions/

https://media.clawshorns.com/uploads/files/fa968f2666480f5b499ccb338c0547a4.png

https://media.clawshorns.com/uploads/files/7964822ee3017f384fe4d0b8866705fd.png

Re: Forex Analysis by LiteForex

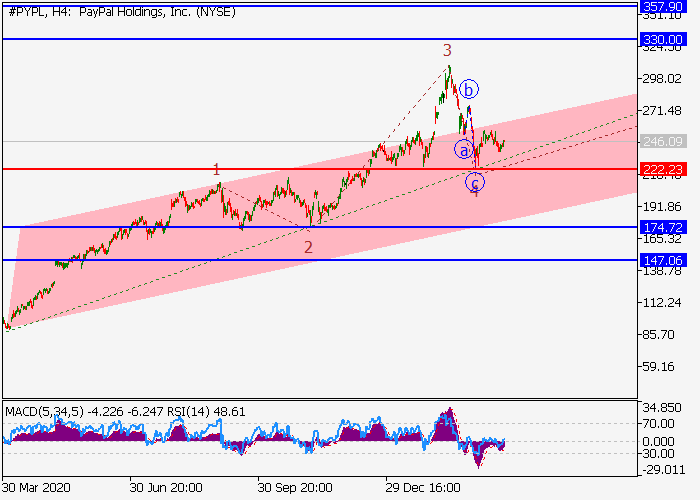
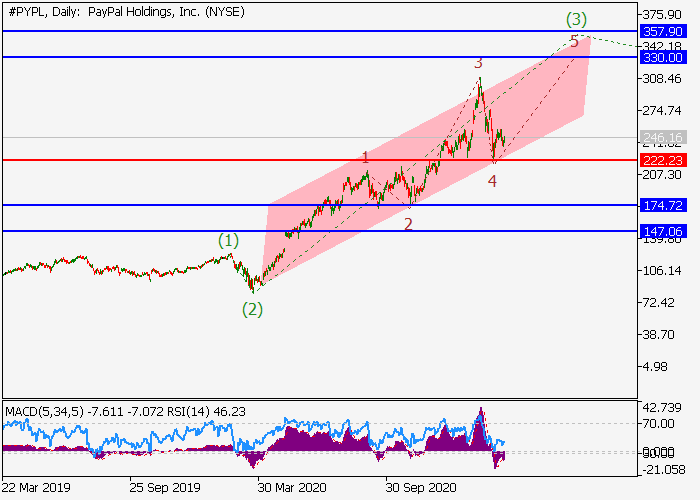
PayPal Holdings Inc.: wave analysis

The price may grow.

On the daily chart, the third wave of the higher level (3) develops, within which the wave 3 of (3) formed. Now, a downward correction has developed as the wave 4 of (3), within which the wave c of 4 has formed, and the development of the wave 5 of (3) has started. If the assumption is correct, the price will grow to the levels of 330.00–357.90. In this scenario, critical stop loss level is 222.23.

https://media.clawshorns.com/uploads/files/c7b7e03e1f3d5df2ed480f92dc112628.png

https://media.clawshorns.com/uploads/files/389e833193df480f36d26c3b129da91c.png

Re: Forex Analysis by LiteForex

Brent Crude Oil: the trend reversed downwards

Current trend

On Tuesday, Brent crude oil price hit its lowest level since early February, falling by 15% from recent highs in early March.

Yesterday, trading in futures closed at 60.79, the spread for the coming months for Brent and WTI Crude Oil turned into contango, where contracts are cheaper than in later months, which indicates a decrease in demand for crude oil. Market sentiment remains “bearish” as analysts fear a slowdown in demand recovery after new pandemic restrictions in Europe. For example, Germany, the largest oil consumer in the region, extended its isolation until April 18. In the US, the number of new infections may also grow during the spring break.

Over the past week, according to the American Petroleum Institute, US stocks of crude oil increased by 2.9M barrels, contrary to analysts' expectations of a decline of 900K. Official data from the Energy Information Agency will be released today. According to the forecast, a slight decrease in reserves by 272K barrels is expected.

Support and resistance

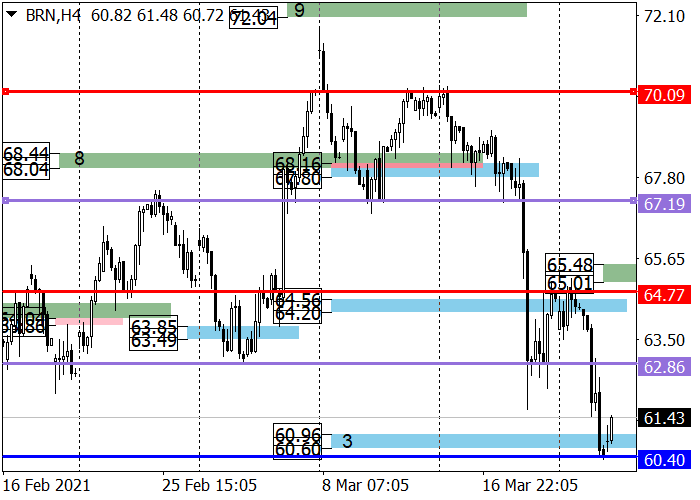
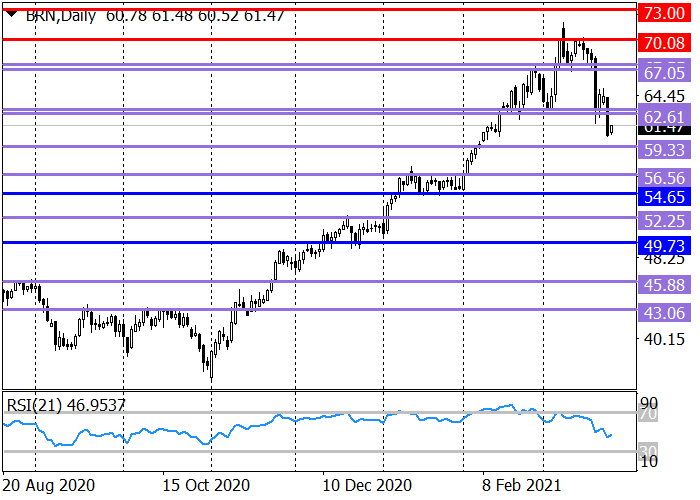
Yesterday, the key support of the long-term uptrend at the level of 63.03–62.61 was broken. The next downward target is the level of 59.33.

Within the medium-term downtrend, target zone 3 (60.96–60.60) was reached. The breakdown of 60.40 allows decline will continue to target zone 4 (57.36–57.00). The trend border shifts to 65.48–65.01.

Resistance levels: 63.03, 65.00, 67.55.
Support levels: 60.40, 59.33, 57.17.

https://media.clawshorns.com/uploads/files/271f601c678a98af1be5197277ec3a89.png

https://media.clawshorns.com/uploads/files/6973f825b6f79999a608fcddc31d84e3.png

Re: Forex Analysis by LiteForex

EUR/USD: slowing vaccination in Europe affects the price

Current trend

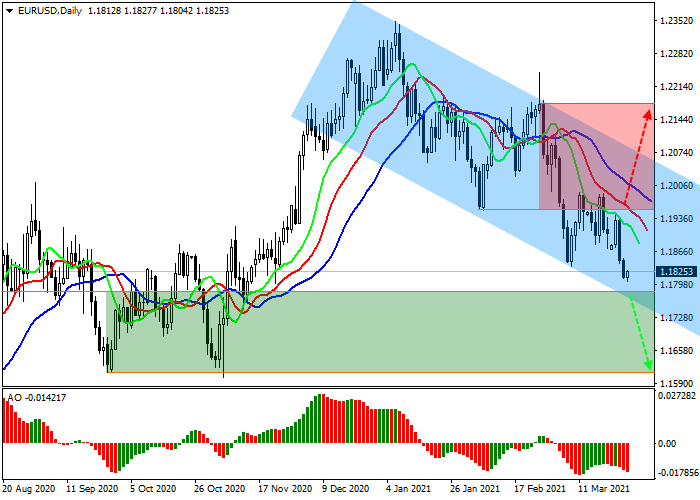
The EUR/USD pair is declining, trading around the level of 1.1825.

The topic of vaccination in the EU remains in the spotlight of investors. Yesterday, the European Commission issued a statement, which notes that the regulator still cannot achieve the goal of ensuring timely access to vaccines for all citizens of the block. Also, it was noted that “legal consequences” were not excluded against AstraZeneca for failing to meet its obligations to supply the vaccine. As for the macroeconomic statistics, they were moderately positive. Manufacturing PMI in Germany for March rose to 66.6 points from 60.7 points for February, while the same indicator in France was 58.8 points, which is also better than the 56.1 points shown earlier.

The USD Index grows moderately, trading above 92.500 points. Yesterday, traders were focused on the speech of the head of the US Federal Reserve, Jerome Powell. The official has slightly changed the tone of recent days and said that financial incentives, most likely, would not be able to have a serious impact on inflation, and there was no need to fear its growth. Also, he noted that in the event of a strong rise in prices, the regulator had effective containment mechanisms.

Support and resistance

Globally, the price decreases within a wide downwards channel. Technical indicators maintain a global sell signal. Fast EMAs on the Alligator indicator are below the signal on, and the AO oscillator histogram trades in the sell zone.

Resistance levels: 1.1957, 1.2176.
Support levels: 1.1774, 1.1600.

https://media.clawshorns.com/uploads/files/ebd8a2763916e107dff844c879e0261e.png

Re: Forex Analysis by LiteForex

GBP/USD: GBP wins back losses

Current trend

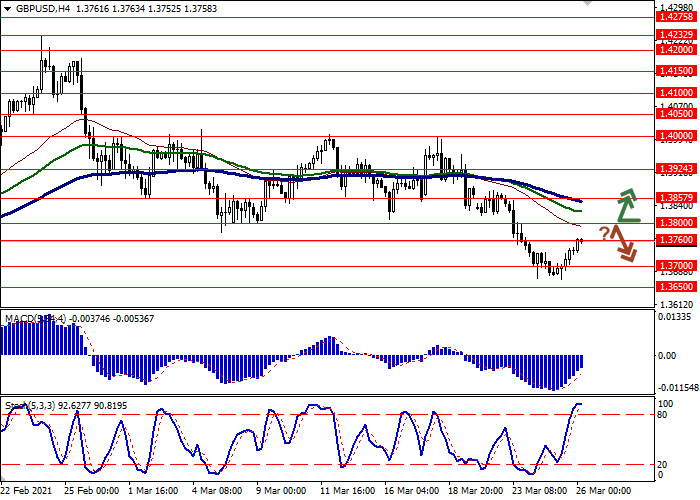
GBP is showing corrective gains against USD in today's morning session, developing the "bullish" signal formed the day before.

Technical factors are the reason for the strengthening of the instrument, while a further decrease in the yield of American bonds weakens USD.

In turn, yesterday USD received moderate support from macroeconomic publications in the USA. The revised data reflected the growth of the American economy in Q4 2020 by 4.3% YoY, which turned out to be 0.2% better than the forecast. The number of initial jobless claims for the week ending March 19 fell sharply from 781K to 684K, which also outstripped positive market expectations of a decline to 730K. Continuous jobless claims for the first time in a long time fell below 4M and consolidated at 3.87M after 4.134M in the previous period.

Today, the data on the retail sales in the UK for February is expected to be published.

Support and resistance

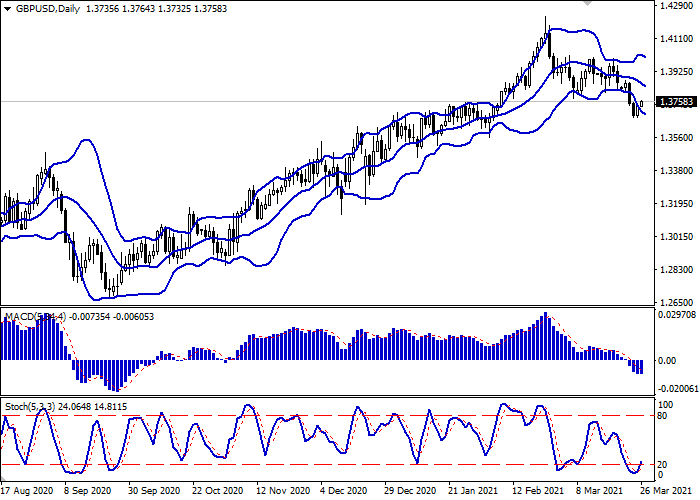
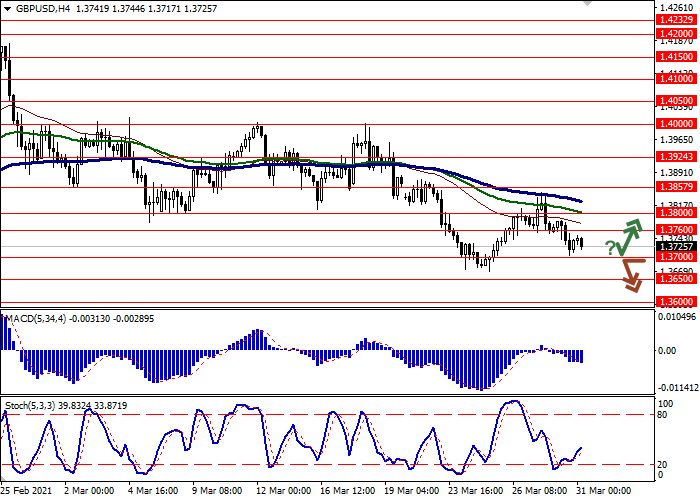
Bollinger Bands in D1 chart demonstrate a moderate decrease. The price range is changing slightly, but remains rather spacious for the current level of activity in the market. MACD is trying to reverse upwards but preserves its previous sell signal (located below the signal line). Stochastic is showing similar dynamics, reversing upwards close to its lows and indicating the oversold GBP in the ultra-short term.

Resistance levels: 1.3760, 1.3800, 1.3857, 1.3924.
Support levels: 1.3700, 1.3650, 1.3600.

https://media.clawshorns.com/uploads/files/8186ba63007d7ed402ec5278c7d0d7a3.png

https://media.clawshorns.com/uploads/files/3024ad5560fd486678ab3141b6f544bd.png

Re: Forex Analysis by LiteForex

USD/JPY: the instrument is declining

Current trend

USD is significantly declining against JPY in trading in today's Asian session, retreating from record highs since June 2020 updated at the end of last week.

Technical factors remain the reason for the appearance of the "bearish" trend for the instrument, since the news background is quite calm. Investors take a lead from the controversial macroeconomic statistics from the USA on the dynamics of personal income and spending in February, as well as assess the prospects for further recovery of the global economy as the coronavirus pandemic recedes.

This week, traders will focus on the March report on the US labor market, which will be published on Friday. The recovery in the world's largest economy is expected to accelerate sharply and the unemployment rate is expected to retreat to 6%.

Support and resistance

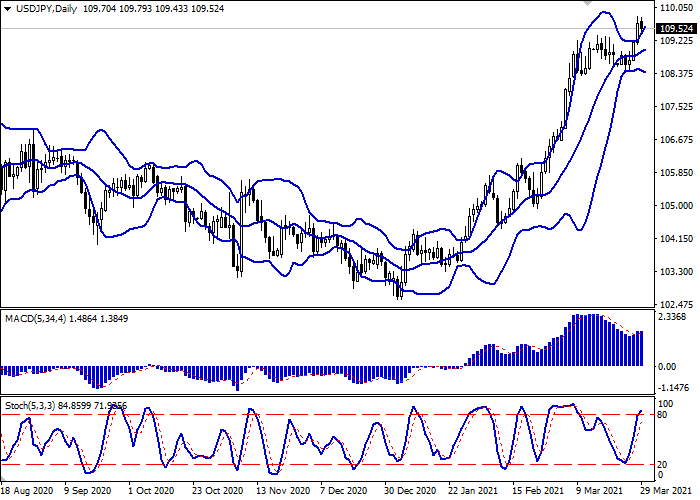
Bollinger Bands on the daily chart are showing moderate growth, signaling strong "bullish" potential in the short and medium term. The price range is expanding; however, it fails to keep up with the surge of last week's buyers' activity. MACD indicator is growing, having formed a new buy signal (located above the signal line). Stochastic keeps its upward direction but is rapidly approaching its highs, which reflects the risks of overbought USD in the ultra-short term.

Existing long positions should be kept until technical indicators are clarified.

Resistance levels: 109.84, 110.23, 111.00.
Support levels: 109.37, 109.00, 108.61, 108.15.

https://media.clawshorns.com/uploads/files/0d3fec400f44ce3e71df158f88756659.png

https://media.clawshorns.com/uploads/files/dcc8a1d47ed6ba40a718c58d31428fd4.png

Re: Forex Analysis by LiteForex

XAU/USD: active downtrend

Current trend

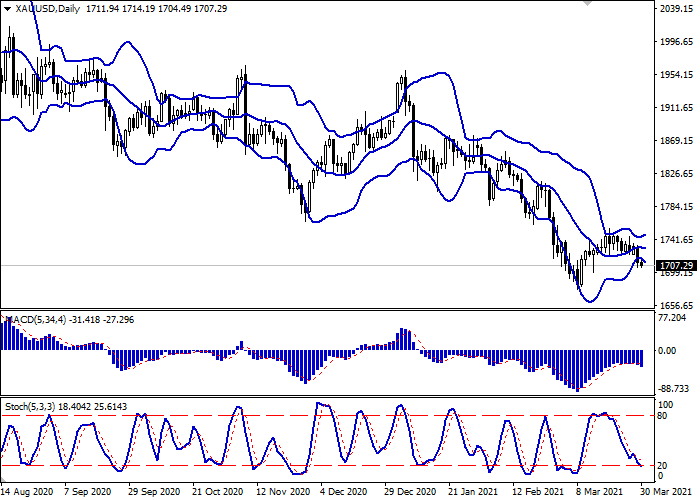
Gold prices show active downtrend during today's Asian session, developing a "bearish" momentum formed yesterday.

On Monday, quotations of the asset fell by more than 1%, responding to the further strengthening of USD, as well as amid expectations of a further recovery in the global economy. The development of the downtrend for the instrument was also facilitated by technical factors of profit fixation at the end of the month.

At the same time, investors are cautious against the backdrop of an extremely alarming epidemiological situation in Europe. The largest economies in the region (Germany and France) are close to another tightening of restrictive measures, as the incidence rate is growing rapidly. All this is taking place against the background of low rates of vaccination of the population, as many European countries have suspended the use of the drug from AstraZeneca due to reports that it can cause thrombosis.

Support and resistance

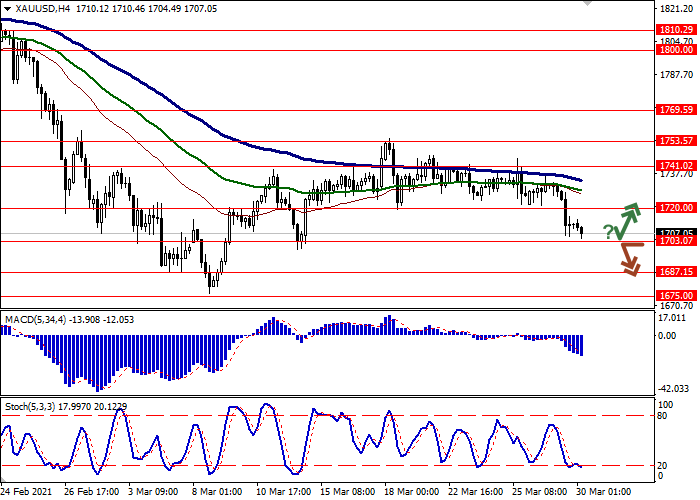
On the D1 chart Bollinger Bands are reversing downwards. The price range is expanding; however, it fails to catch the surge of the "bearish" sentiment at the moment. MACD reversed into a descending plane, having formed new sell signal (located below the signal line). Stochastic keeps a confident downward direction but is already approaching its lows, which indicates the risks of oversold instrument in the ultra-short term.

Existing short positions should be kept until technical indicators are clarified.

Resistance levels: 1720.00, 1741.02, 1753.57, 1769.59.
Support levels: 1703.07, 1687.15, 1675.00, 1660.15.

https://media.clawshorns.com/uploads/files/071a601eb56b5f75fdc99f00ecc3abac.png

https://media.clawshorns.com/uploads/files/7f7c8e06627b41ac1f909e1641620be7.png

Re: Forex Analysis by LiteForex

GBP/USD: downward trend

Current trend

GBP is declining against USD in trading this morning session, developing a "bearish" momentum formed at the beginning of this week.

Investors are actively buying USD amid growing yields on US bonds and are responding positively to the pace of vaccination, which allows them to hope that most of the quarantine restrictions will be lifted soon. However, given the current crisis in the incidence rate in Europe, not all analysts are so optimistic. There is an opinion that a too fast economic recovery and the abandonment of most of the restrictive measures could lead the USA to a third wave of coronavirus, which judging by European indicators will not be weaker than the first two. The same can be said about the UK, where the rate of vaccination of the population is one of the highest to date.

Today, investors are focused on the updated statistics on the UK GDP for Q4 2020, as well as the March data on Nationwide Housing Prices.

Support and resistance

Bollinger Bands in D1 chart demonstrate a stable decrease. The price range is almost unchanged, but it remains rather spacious for the current level of activity in the market. MACD is declining keeping a weak sell signal (located below the signal line). Stochastic is reversing downwards again after a brief increase last week. The current showings of the indicator do not contradict the further development of the downtrend in the ultra-short term.

Resistance levels: 1.3760, 1.3800, 1.3857, 1.3924.
Support levels: 1.3700, 1.3650, 1.3600.

https://media.clawshorns.com/uploads/files/cebdb5a64ce76b4f921fd3fa33362dc7.png

https://media.clawshorns.com/uploads/files/d77635c0618d9edf8483f4f6902418a3.png

Re: Forex Analysis by LiteForex

USD/CHF: updating record highs

Current trend

USD has shown moderate gains against CHF during today's Asian trading session, updating record highs since mid-July 2020. Market activity is gradually declining, given the upcoming Easter holidays, but investors are awaiting the publication of the US labor market report for March, which will take place on Friday. Market forecasts suggest a marked increase in the number of new jobs created by the US economy outside the agricultural sector. The unemployment rate may also decline and reach 6%.

Today the focus of investors will be on the statistics on business activity in the US and Switzerland in March, which will help assess the prospects for economic recovery.

Support and resistance

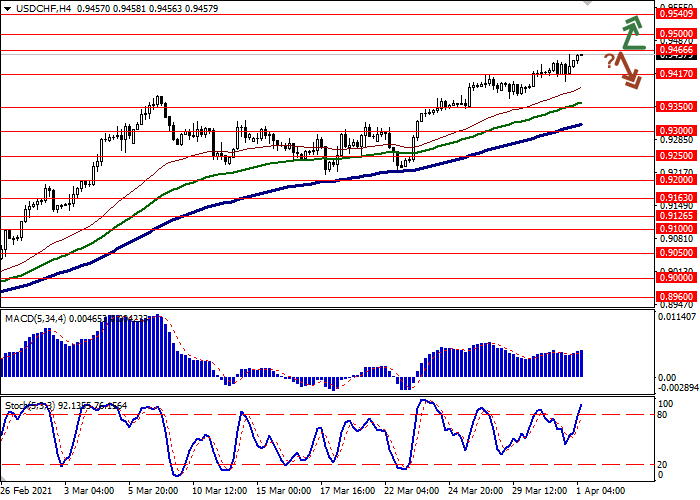
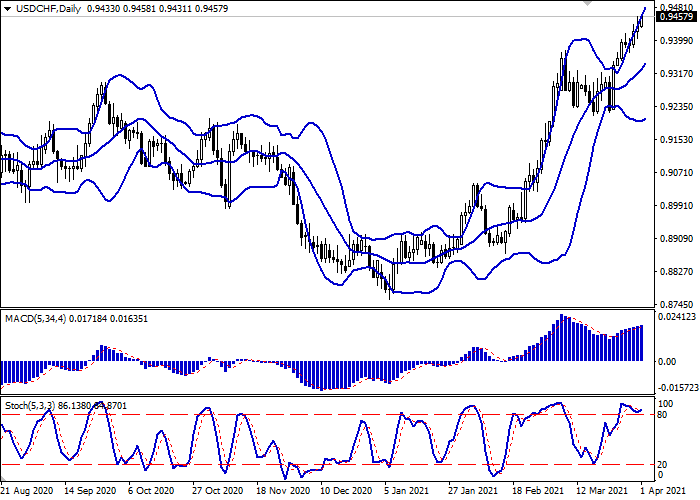
Bollinger Bands in D1 chart show stable growth. The price range expands, freeing a path to new record highs for the "bulls". MACD indicator is growing preserving a weak buy signal (located above the signal line). Stochastic is still in close proximity to its highs, signaling strongly overbought USD in the ultra-short term.

To open new positions, it is necessary to wait for the trade signals to become clear.

Resistance levels: 0.9466, 0.9500, 0.9540.
Support levels: 0.9417, 0.9350, 0.9300, 0.9250.

https://media.clawshorns.com/uploads/files/d97a439c6ca9f5e06dc0a3fc4d006827.png

https://media.clawshorns.com/uploads/files/5f74277fd53415efe039dac8bea551e9.png

Posts: 1,151 to 1,175 of 1,210

Pages Previous 1 45 46 47 48 49 Next

You must login or register to post a reply

Forex Software → Market Analysis → Forex Analysis by LiteForex

Similar topics in this forum