forex software

Create and Test Forex Strategies

forex software

Skip to forum content

Forex Software

Create and Test Forex Strategies

You are not logged in. Please login or register.


(Page 46 of 62)

Forex Software → Market Analysis → InstaForex Analysis

Pages Previous 1 44 45 46 47 48 62 Next

You must login or register to post a reply

RSS topic feed

Posts: 1,126 to 1,150 of 1,547

Re: InstaForex Analysis

Forex Analysis & Reviews: Forecast for GBP/USD on July 26, 2022

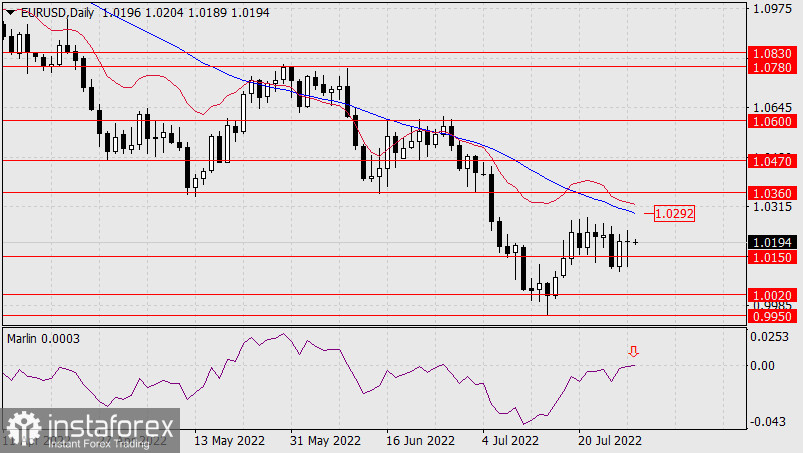
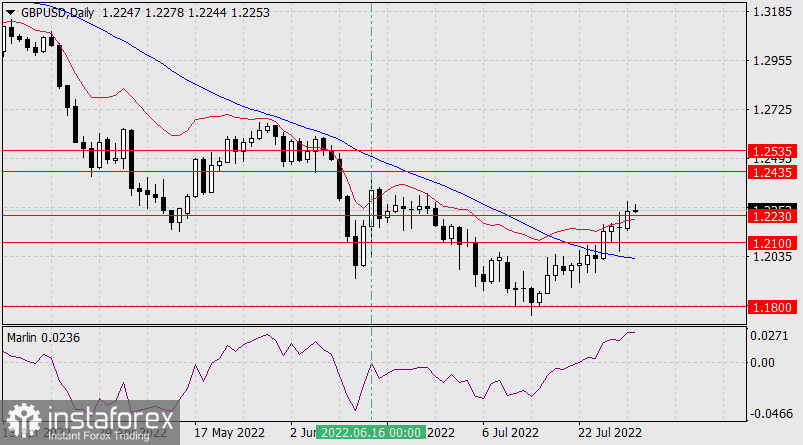
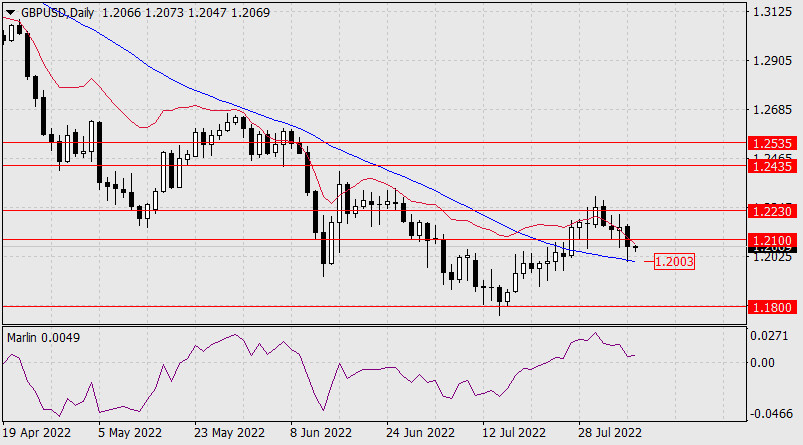
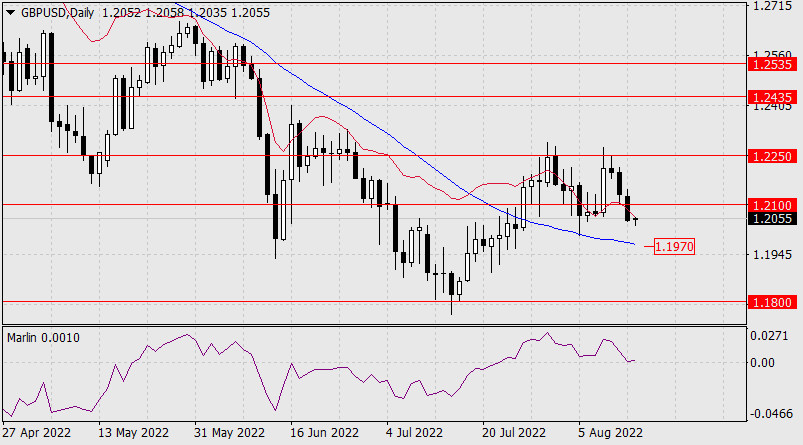
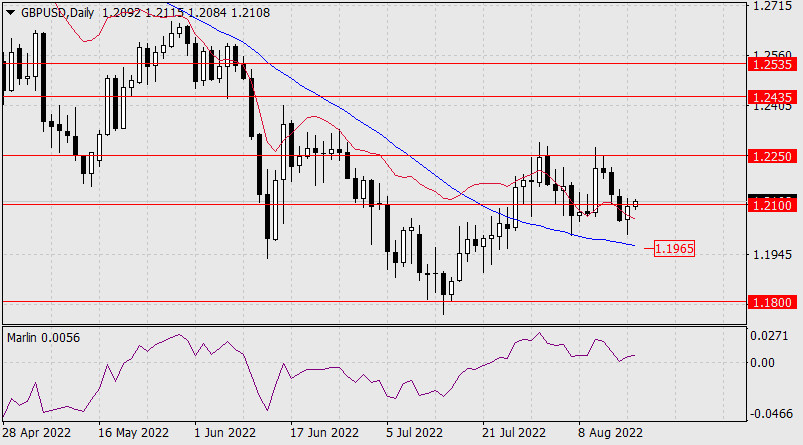
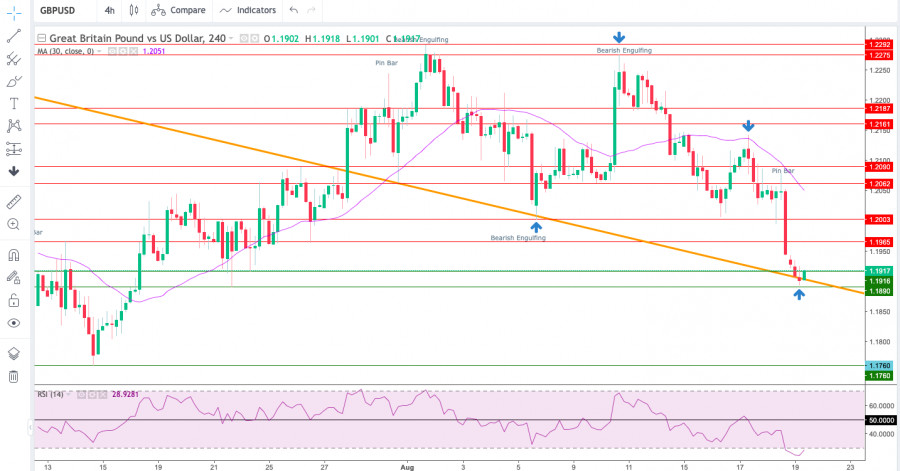
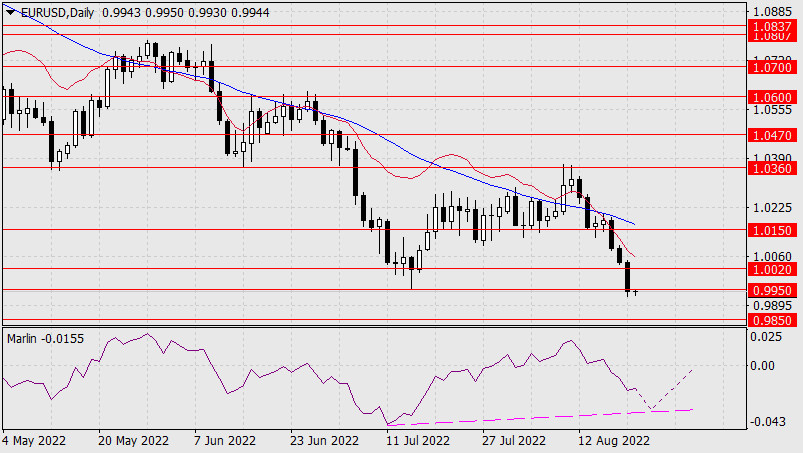
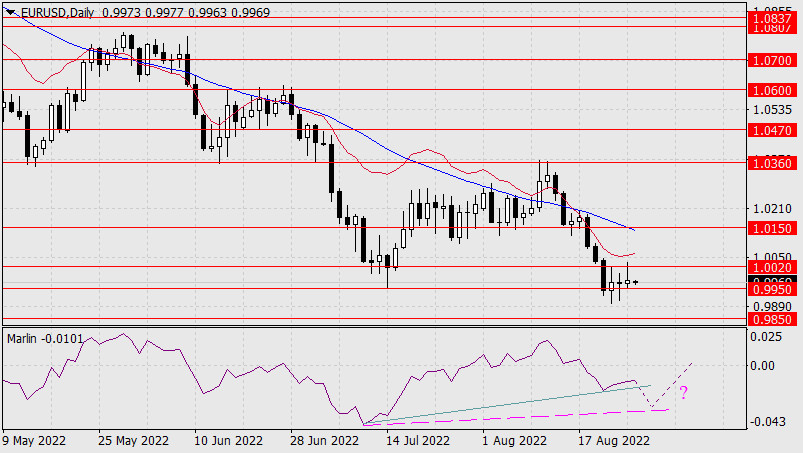
Yesterday, the British pound made the first attempt to break above the MACD indicator line on a daily scale. This morning, the pound is more confidently going above this resistance, approaching the target level of 1.2100. Surpassing the level opens the 1.2230 target. Consolidating above 1.2230 may extend the price growth to the level of 1.2435.

https://forex-images.ifxdb.com/userfiles/20220726/analytics62df589206150_source!.jpg

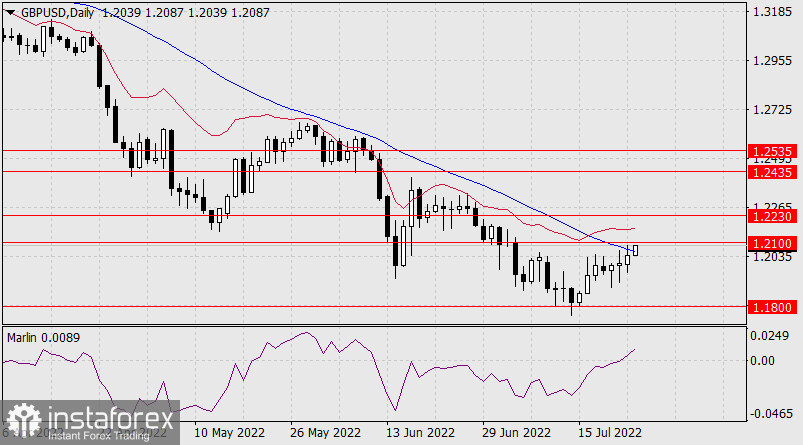
The Marlin Oscillator is actively growing in the positive area, instilling optimism in the bulls. Of course, it is possible that the price will not be able to overcome the strong level of 1.2100, and then Marlin's exit above the zero neutral line will become false, and the price will turn towards 1.1800.

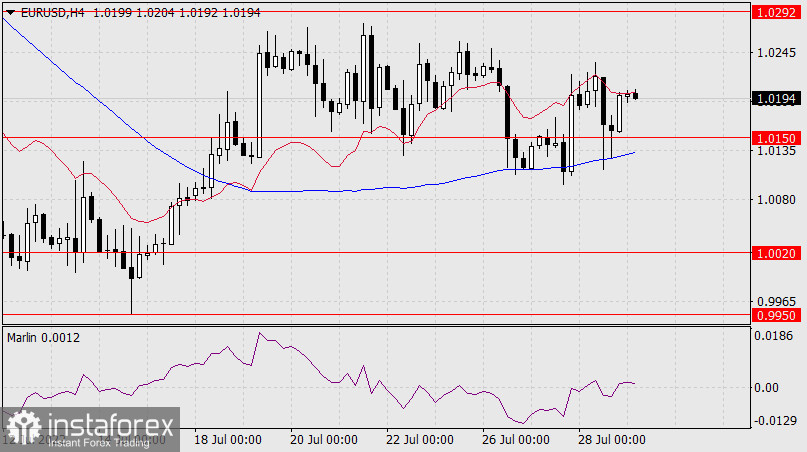
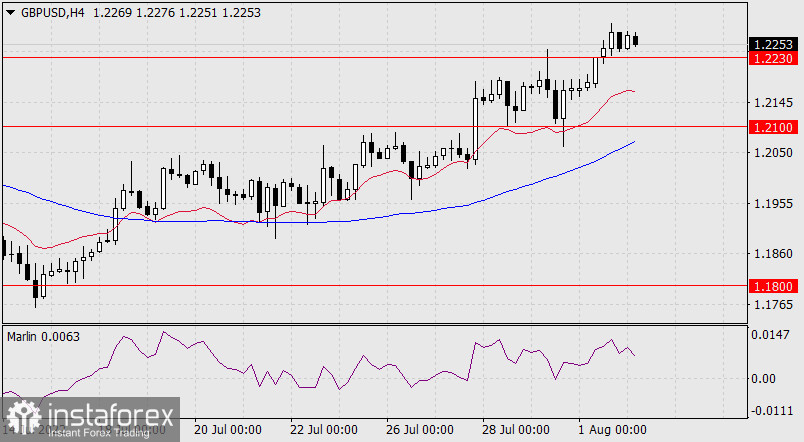
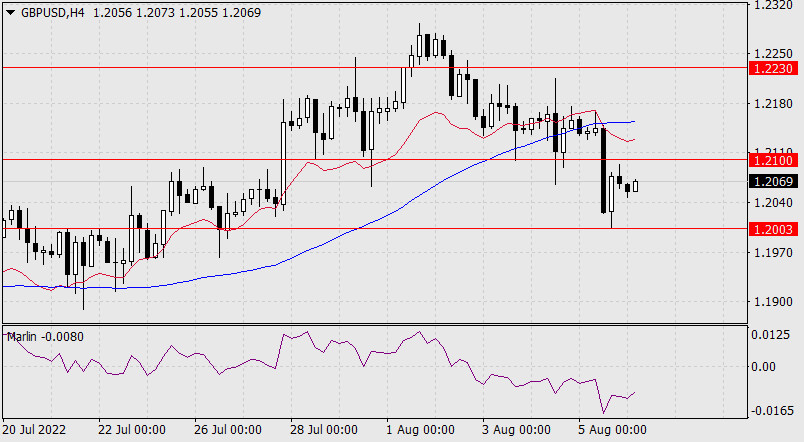
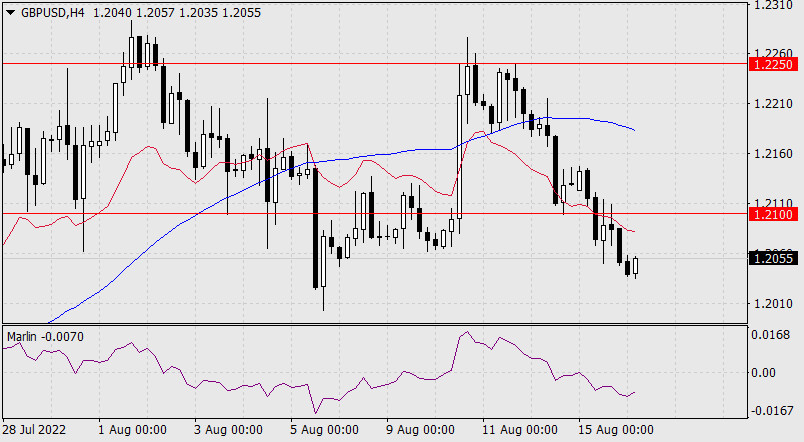
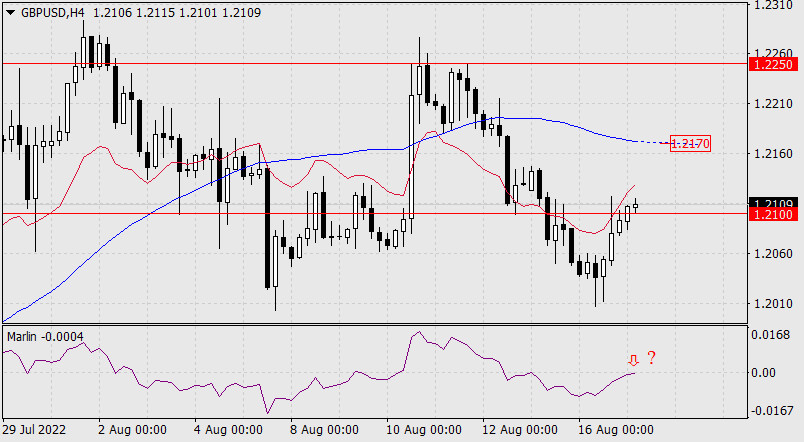
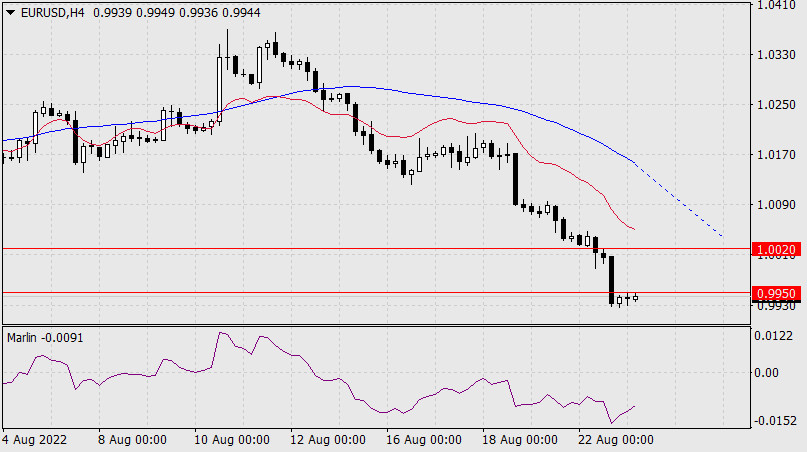
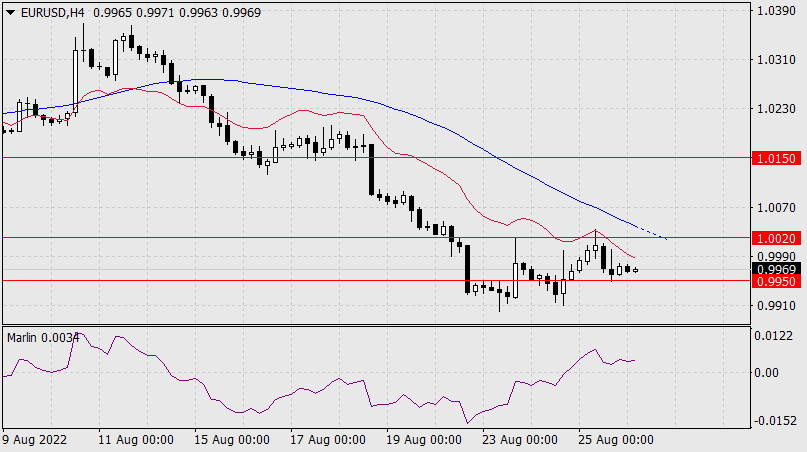
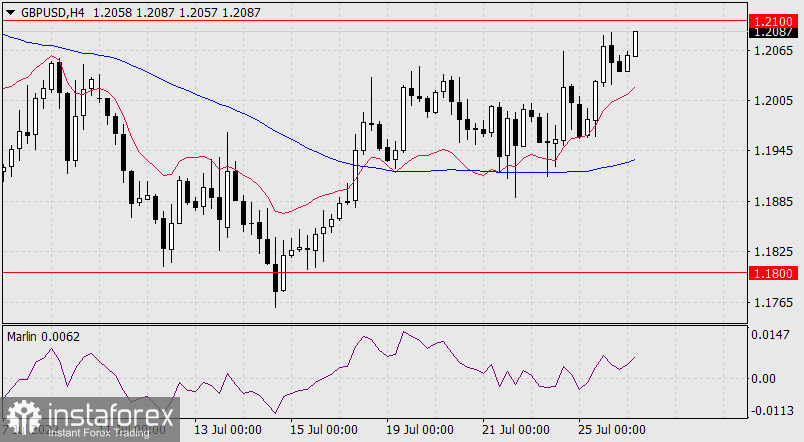
The price is completely in an upward position on the H4 chart, since its local growth occurs above both indicator lines and the Marlin Oscillator develops in the positive area. A signal for the development of growth will be the price consolidating above the level of 1.2100. The absence of a signal can turn the price in the opposite direction.

https://forex-images.ifxdb.com/userfiles/20220726/analytics62df589ed677b_source!.jpg

*The market analysis posted here is meant to increase your awareness, but not to give instructions to make a trade.

Analysis are provided by InstaForex.

Read More

Best regards, PR Manager / Learn more about InstaForex Company at http://instaforex.com

Re: InstaForex Analysis

Forex Analysis & Reviews: LTCUSD Potential For Bearish Continuation | 27th July 2022

https://forex-images.ifxdb.com/userfiles/20220727/analytics62e0c7e49676a_source!.jpg

On the H4, with price breaking the ascending channel and there is a descending line of RSI, we have a bearish bias that price might drop from our 1st resistance at 54.57, which is in line with 23.6% fibonacci retracement to the 1st support at 51.07, which is in line with pullback support. If the price breaks the 1st support, we could expect it to drop to the 2nd support at 47.21, which is in line with pullback support. Alternatively, price may head for 2nd resistance at 59.90, which is in line with the multiple swing highs.

Trading Recommendation
Entry: 54.57
Reason for Entry: 23.6% fibonacci retracement
Take Profit: 51.07
Reason for Take Profit:Pullback resistanceStop Loss: 59.90
Reason for Stop Loss:
Multiple swing highs
*The market analysis posted here is meant to increase your awareness, but not to give instructions to make a trade.

Analysis are provided by InstaForex.

Read More

Best regards, PR Manager / Learn more about InstaForex Company at http://instaforex.com

Re: InstaForex Analysis

Forex Analysis & Reviews: USDJPY Potential For Bearish Continuation | 28th July 2022

https://forex-images.ifxdb.com/userfiles/20220728/analytics62e21e5cdb4ce_source!.jpg

On the H4, with price broken out of the ascending trendline and moving below the ichimoku indicator, we have a bearish bias that price will drop to our 1st support at 134.531 where the swing low support, 61.8% fibonacci retracement, 78.6% fibonacci projection and 161.8% fibonacci extension are. Once there is downside confirmation of price breaking 1st support, we would expect bearish momentum to carry price to the 2nd support at 131.480 where the swing low support is. Alternatively, price could head for 1st resistance at 136.723 where the overlap resistance is.

Trading Recommendation
Entry: 134.531
Reason for Entry:
Swing low support, 61.8% fibonacci retracement, 78.6% fibonacci projection and 161.8% fibonacci extension
Take Profit: 131.480
Reason for Take Profit:Swing low support
Stop Loss: 136.723
Reason for Stop Loss:
Overlap resistance

*The market analysis posted here is meant to increase your awareness, but not to give instructions to make a trade.

Analysis are provided by InstaForex.

Read More

Best regards, PR Manager / Learn more about InstaForex Company at http://instaforex.com

Re: InstaForex Analysis

Forex Analysis & Reviews: Forecast for EUR/USD on July 29, 2022

Yesterday's attempt to break through the support of 1.0150 failed. After a decline of 83 points, the price was tossed and the day closed at the opening level. At this time, the signal line of the Marlin Oscillator reached the border with the growing trend territory and, according to the main scenario, it can now turn down from it, which will help the price overcome the support of 1.0150. This will be followed by a decline to the level of 1.0020.

https://forex-images.ifxdb.com/userfiles/20220729/analytics62e34a47b355e_source!.jpg

Another scenario allows the price to reach the resistance of the MACD line (1.0292) and only then turn down. An alternative scenario suggests an attack on the target level of 1.0360.

The bears' situation looks more alarming on the four-hour scale. The price bounced off the support of the MACD line for the third time and the Marlin Oscillator moved into the growing trend zone. The euro could weaken again if we receive disappointing data on the GDP of the eurozone, which will be released today. The quarterly forecast is 0.2%. The data should be weaker than predicted. Yesterday, the US GDP for the 2nd quarter showed a contraction of 0.9% against the forecast growth of 0.5%, so the data on the euro area may also be negative. If European data turns out to be stronger, EUR/USD will try to work out the upper targets.

https://forex-images.ifxdb.com/userfiles/20220729/analytics62e34a56b66aa_source!.jpg

Analysis are provided by InstaForex.

Read More

Best regards, PR Manager / Learn more about InstaForex Company at http://instaforex.com

Re: InstaForex Analysis

Forex Analysis & Reviews: Forecast for EUR/USD on August 1, 2022

By this morning, the euro's situation is such that over the past four days the price has not overcome the support level of 1.0150, the downward potential was lost, and now the price is growing towards the nearest target of 1.0285 supported by the Marlin Oscillator growing in the positive area on the daily scale chart.

https://forex-images.ifxdb.com/userfiles/20220801/analytics62e73b80ca53f_source!.jpg

Breaking the MACD line (1.0285) will open the target level of 1.0360 (the June 15 low). From this level, the probability of a price reversal down, into a medium-term decline, will increase by a lot.

On the H4 chart, it is noticeable that a four-fold upward price reversal occurred from the MACD indicator line. At the moment, the price is rising above the balance line, the Marlin Oscillator is growing in the upper half - in the territory of an upward trend.

The final estimates of the eurozone Manufacturing PMI for July will be published today, the forecast for it is unchanged at 49.6, as well as for the US ISM Manufacturing PMI, for which the forecast is already down: 52.0-52.3 against 53.0 a month earlier. We are waiting for the continuation of the euro's corrective growth.

https://forex-images.ifxdb.com/userfiles/20220801/analytics62e73b90dfce6_source!.jpg

Analysis are provided by InstaForex.

Read More

Best regards, PR Manager / Learn more about InstaForex Company at http://instaforex.com

Re: InstaForex Analysis

Forex Analysis & Reviews: Forecast for GBP/USD on August 2, 2022

On the second attempt, that is, yesterday, the pound went above the target level of 1.2230 and above the balance indicator line. It continues to rise this morning, there is a difficult path just ahead to the target of 1.2435, and this target level may not be reached, as there is a technically strong 1.2405 ahead of it - the high of June 16 and earlier historical extremes. The Marlin Oscillator is growing, the growth potential has not been exhausted.

https://forex-images.ifxdb.com/userfiles/20220802/analytics62e88de682dc7_source!.jpg

The price has consolidated above the target level of 1.2230 on the four-hour chart, but the Marlin Oscillator does not share the price's optimism, intending to return to the downward trend zone.

This is already a manifestation of signs of a technically difficult upward movement. If the price settles below 1.2230, Marlin will return to the negative area, this will be the first sign of the completion of the corrective growth.

https://forex-images.ifxdb.com/userfiles/20220802/analytics62e88df7426b0_source!.jpg

*The market analysis posted here is meant to increase your awareness, but not to give instructions to make a trade.

Analysis are provided by InstaForex.

Read More

Best regards, PR Manager / Learn more about InstaForex Company at http://instaforex.com

Re: InstaForex Analysis

Forex Analysis & Reviews: Trading Signal for USD/JPY for August 3 - 4, 2022: buy in case of rebound at 132.63 (5/8 Murray - 21 SMA)


https://forex-images.ifxdb.com/userfiles/20220803/analytics62e9f3e775ad9_source!.jpg

USD/JPY has risen more than 350 pips in the last 48 hours, recovering strongly from the lowest level in almost two months. The pair bottomed at 130.39 at around 4/8 Murray and is now trading with an upward bias above the 21 SMA and above 5/8 Murray.

Since July 14, the Japanese yen strengthened, having fallen almost 900 pips from the high of 139.39 to the low of 130.39. The Japanese yen is currently showing signs of being oversold and any pullback is likely to be seen as a buying opportunity. The psychological level of 130.00 has become major support for USD/JPY. It is likely that as long as it trades above this level, it could resume its bullish cycle and could reach 135.00 (200 EMA) and even reach the psychological level of 140.00.

Risk appetite added pressure to USD/JPY, setting the stage for the yen's recovery that took more than 2 weeks. The strong technical bounce from earlier this week could signal the end of the downtrend. However, July payroll data will be released on Friday and could change the short-term outlook for the Japanese yen.

A return above the 200 EMA located and 135.08 will mean a resumption of the uptrend and USD/JPY could reach 137.50 (8/8 Murray) again and even reach the 24-year high at 139.38. On the other hand, any technical bounce above the 21 SMA located at 132.63 will still be a clear signal to buy. The pair could continue its rise to 135.00 and 137.50.

On August 1, the eagle indicator reached the extremely oversold zone of around 5 points which was a clear signal to buy. After reaching a high of 133.89 in the Asian session, it is showing signs of a technical correction. Hence, we can expect the price to rebound off 132.63 to buy again.

Our trading plan for the next few hours is to wait for a technical bounce at around 132.63 and buy the pair with targets at 6/8 Murray around 134.65 and at the 200 EMA around 135.12. *The market analysis posted here is meant to increase your awareness, but not to give instructions to make a trade.

Analysis are provided by InstaForex.

Read More

Best regards, PR Manager / Learn more about InstaForex Company at http://instaforex.com

Re: InstaForex Analysis

Forex Analysis & Reviews: Forecast for EUR/USD on August 4, 2022)

The euro traded with a range of 45 points on Wednesday, closing the day at the opening level, above the support of 1.0150. The signal line of the Marlin Oscillator also failed to cross the zero line into the bears' territory. Thus, the price level of 1.0150 appears to be quite strong, the price may develop an acceleration when it is overcome. Downward targets: 1.0020, 0.9950.

https://forex-images.ifxdb.com/userfiles/20220804/analytics62eb3736da6f3_source!.jpg

The price settled under both indicator lines on the H4 chart. Yesterday the price went through the shadows of the support at 1.0150 and the resistance of the MACD line. Marlin has a downward direction, we are waiting for the price to settle under 1.0150 and its further fall. This plan will be disrupted after the price settles above the MACD line (1.0195). In this case, the growth will continue to the daily MACD line - 1.0255.

https://forex-images.ifxdb.com/userfiles/20220804/analytics62eb37416df4e_source!.jpg

Analysis are provided by InstaForex.

Read More

Best regards, PR Manager / Learn more about InstaForex Company at http://instaforex.com

Re: InstaForex Analysis

Forex Analysis & Reviews: Forecast for EUR/USD on August 5, 2022

After an unsuccessful attempt to overcome technical support at 1.0150 on Wednesday, and the price jumped 77 points on Thursday in order to turn around from the MACD line, having received an impulse push from resistance, to make a subsequent attempt to a solid level of 1.0150. The Marlin Oscillator also did not have enough strength to overcome the zero line on the first attempt, after which it slightly rose and is now turning to a new attack.

https://forex-images.ifxdb.com/userfiles/20220805/analytics62ec80b104f1e_source!.jpg

After the price settles below 1.0150, the movement will continue to the target level of 1.0020. An alternative scenario will open after the price settles above 1.0254, that is, above the daily MACD line. The nearest upside target will be the level of 1.0360 (15 June low), from which we still expect a reversal to the medium-term downside.

The price is formally in an upward position on the four-hour chart, as there is an increase above both indicator lines and Marlin in the upward trend territory, but based on the logic of the daily timeframe, we are waiting for the price to drop below the MACD line, below 1.0212, which will start the development of an attack on technical support for the daily timeframe. At the time of the price transition below 1.0212, the Marlin Oscillator will move into the downward trend zone. Consolidating above 1.0254 will prolong the euro's corrective growth

https://forex-images.ifxdb.com/userfiles/20220805/analytics62ec80a7dd98e_source!.jpg

*The market analysis posted here is meant to increase your awareness, but not to give instructions to make a trade.

Analysis are provided by InstaForex.

Read More

Best regards, PR Manager / Learn more about InstaForex Company at http://instaforex.com

Re: InstaForex Analysis

Forex Analysis & Reviews: Forecast for GBP/USD on August 8, 2022

The pound was falling by 151 points on Friday, having touched the support of the MACD trend line (1.2003) with the lower shadow of the daily candle. The price's departure under the trend indicator line will mean a resumption of a decline in the medium term. The first target on this path is the level of 1.1800.

https://forex-images.ifxdb.com/userfiles/20220808/analytics62f0788a4425b.jpg

The Marlin Oscillator remains in positive territory for now. Apparently, this circumstance did not allow the price to overcome the support on Friday. Now there is such a situation that the price overcoming the MACD line (1.2003) and the transition of the oscillator to a negative position can coincide in time. Such synchronicity can give a strong momentum to the price in moving down. If the price goes back above 1.2100, then the decline will be delayed for a day or two. Overcoming 1.2230 will open the 1.2435 target.

https://forex-images.ifxdb.com/userfiles/20220808/analytics62f0787b9fad8.jpg

The price has consolidated under the balance and MACD indicator lines on the four-hour chart, the Marlin Oscillator is developing in negative territory. We are waiting for the price to move down according to the predominant downward scenario.

*The market analysis posted here is meant to increase your awareness, but not to give instructions to make a trade.

Analysis are provided by InstaForex.

Read More

Best regards, PR Manager / Learn more about InstaForex Company at http://instaforex.com

Re: InstaForex Analysis

Forex Analysis & Reviews: Forecast for USD/JPY on August 9, 2022

The USD/JPY pair formed a candle with a small body (-6 points) and sweeping shadows on Monday, which creates a sign of a reversal of the growing trend, that is, a sign of the end of the corrective growth from August 2. The reversal will be confirmed by the price dropping below the nearest support of the embedded price channel line at 134.22. The target will open on the underlying embedded line at 132.13.

https://forex-images.ifxdb.com/userfiles/20220809/analytics62f1c617a4bc3.jpg

The Marlin Oscillator is turning down, being in the downward trend zone. An alternative scenario assumes the price's succeeding growth with the 136.00 target. But a sign of such an alternative will be when the price overcomes yesterday's high at 135.57, which is close enough to the target itself, so in the current situation, the best strategy will be to wait for a sell signal, whether it will happen today or in a few days.

The price is approaching the support at 134.22 supported by the rapidly declining Marlin Oscillator on the 4-hour chart. The advance of the oscillator in the current situation means that it tends to move into the negative area before the price approaches the MACD line, since the price will already need technical assistance to overcome this support by that time. Ultimately, we are waiting for the price at the nearest target level of 132.13.

https://forex-images.ifxdb.com/userfiles/20220809/analytics62f1c5ef8dbb9.jpg

*The market analysis posted here is meant to increase your awareness, but not to give instructions to make a trade.

Analysis are provided by InstaForex.

Read More

Best regards, PR Manager / Learn more about InstaForex Company at http://instaforex.com

Re: InstaForex Analysis

Forex Analysis & Reviews: USDCAD Potential for Bullish Rise | 10th August 2022

https://forex-images.ifxdb.com/userfiles/20220810/analytics62f33217c3e35.jpg

On the H4, with the price going above ichimoku cloud, and DIF is breaking the signal line in MACD, we have a bullish bias that the price may rise from our 1st resistance at 1.29011, which is in line with previous swing high to our 2nd resistance at 1.29831, which is in line with the 78.6% fibonacci projection and 50% fibonacci retracement. Alternatively, the price may drop to the 1st support at 1.28483, which is in line with 61.8% fibonacci retracement and pullback support.

Trading Recommendation
Entry:1.29011
Reason for Entry:Swing high
Take Profit: 1.29831
Reason for Take Profit: 78.6% fibonacci projection and 50% fibonacci retracement
Stop Loss: 1.28483
Reason for Stop Loss:
61.8% fibonacci retracement and pullback support

*The market analysis posted here is meant to increase your awareness, but not to give instructions to make a trade.

Analysis are provided by InstaForex.

Read More

Best regards, PR Manager / Learn more about InstaForex Company at http://instaforex.com

Re: InstaForex Analysis

Forex Analysis & Reviews: USDCHF Potential for Bearish Drop | 11st August 2022

https://forex-images.ifxdb.com/userfiles/20220811/analytics62f48bb858711.jpg

On the H4, with prices moving below the ichimoku cloud and the MACD indicators are below zero, we have a bearish bias that the price may drop from the 1st support at 0.94002, where the swing low support is to the 2nd support at 0.93272, which is in line with 78.6% fibonacci projection. Alternatively, since the price is rising currently and from H1, the DIF is crossing over the signal line, the price may rise to the 1st resistance at 0.95233, where the swing low support and 50% fibonacci retracement are.

Trading Recommendation Entry:0.94002
Reason for Entry: Swing low support
Take Profit: 0.93272
Reason for Take Profit: 78.6% fibonacci projection
Stop Loss: 0.95233
Reason for Stop Loss:
Swing low support and 50% fibonacci retracement

*The market analysis posted here is meant to increase your awareness, but not to give instructions to make a trade.

Analysis are provided by InstaForex.

Read More

Best regards, PR Manager / Learn more about InstaForex Company at http://instaforex.com

Re: InstaForex Analysis

Forex Analysis & Reviews: Forecast for EUR/USD on August 12, 2022

Yesterday, the euro once again tried to attack the resistance level of 1.0360 (June 15 low), the attempt was unsuccessful, the pullback intensified. The Marlin Oscillator is already turning down in the positive area, and the price needs to overcome the support of the MACD indicator line (1.0222) and then the euro will begin to fall in the medium term. The first target is 1.0150.

https://forex-images.ifxdb.com/userfiles/20220812/analytics62f5bcc167006.jpg

Federal Reserve FOMC members Neil Kashkari and Mary Daly (until recently a dove) announced the US central bank's firm intention to raise rates by 0.75% in September. The yield on 5-year US government bonds rose from 2.92% to 2.99%, breaking Monday's high.

The Marlin Oscillator is leading the price down on the four-hour chart. The price itself tends to overcome the support of the MACD line (1.0276), which coincides with yesterday's low. It is very possible that the price will move below 1.0276 and the Marlin Oscillator into negative territory at the same time. In this case, the euro will receive a strong downward momentum with further downward development.

https://forex-images.ifxdb.com/userfiles/20220812/analytics62f5bce74d9af.jpg

Analysis are provided by InstaForex.

Read More

Best regards, PR Manager / Learn more about InstaForex Company at http://instaforex.com

Re: InstaForex Analysis

Forex Analysis & Reviews: Trading Signal for GOLD (XAU/USD) on August 15 - 16, 2022: sell if breaks 1,785 (21 SMA - uptrend)

https://forex-images.ifxdb.com/userfiles/20220815/analytics62f9cbb03acab.jpg

Early in the European session, gold (XAU/USD) was trading above the 21 SMA located at 1,793 and above the 200 EMA located at 1,763. We can see that gold is trading within an uptrend channel formed on July 26.

Last week, XAU/USD consolidated in the range of 1,781-1,807. On the other hand, lower US inflation data pushed US bond yields lower. Despite this gold failed to break the resistance zone of 1,812. (6/8 Murray).

If XAU/USD breaks above 6/8 Murray at 1,812, traders could expect gold to hit the resistance zone at 1,843 (7/8). Otherwise, if the price of gold continues below the psychological level of $1,800, the price may move to the 200 EMA at 1,773 and even fall to 4/8 Murray and 1,750.

Recent comments from several Fed officials indicate that the US central bank will continue to tighten its monetary policy. An interest rate hike of 50 basis points is expected in September. This data could limit the rise of gold and could exert downward pressure on the price to push towards support levels of 1,718.

Since the August 1, gold has been giving a negative divergence signal. If XAU/USD fails to break the strong resistance of 6/8 Murray located at 1812, a correction towards 4/8 Murray at 1,750 is likley to occur.

Our trading plan for the next few hours is to buy if there is a technical bounce around the uptrend channel or above the 21 SMA located at 1,793, targeting 1,800 and 1,812.

Conversely, a sharp break below the trend channel formed on the 4-hour chart and a close below 1,785 could be a clear signal to sell with targets at 1,773 and 1,750.

*The market analysis posted here is meant to increase your awareness, but not to give instructions to make a trade.

Analysis are provided by InstaForex.

Read More

Best regards, PR Manager / Learn more about InstaForex Company at http://instaforex.com

Re: InstaForex Analysis

Forex Analysis & Reviews: Forecast for GBP/USD on August 16, 2022

As a result of Monday, the British pound fell by 79 points, passing under the indicator balance line, which empirically shifts the players' interest mainly in short positions.

https://forex-images.ifxdb.com/userfiles/20220816/analytics62fb00a9ee703.jpg

The price is systematically approaching the nearest support at 1.1970 - the MACD line of the daily scale. The Marlin Oscillator has crossed the border with the territory of the downward trend, the downward movement continues. The second target is the level of 1.1800.

https://forex-images.ifxdb.com/userfiles/20220816/analytics62fb00b70e493.jpg

The price settled below the balance indicator line on the four-hour chart, Marlin is falling in negative territory. We are waiting for a further slow decline in the pound.

*The market analysis posted here is meant to increase your awareness, but not to give instructions to make a trade.

Analysis are provided by InstaForex.

Read More

Best regards, PR Manager / Learn more about InstaForex Company at http://instaforex.com

Re: InstaForex Analysis

Forex Analysis & Reviews: Forecast for GBP/USD on August 17, 2022

The pound slowed down corrective growth at the target level of 1.2100. If the price does not settle above it, then we are waiting for a reversal with the development of support for the MACD line of the daily scale in the area of 1.1965. Further, the 1.1800 target may open.

https://forex-images.ifxdb.com/userfiles/20220817/analytics62fc57524ce76.jpg

A large layer of inflation indicators for July will be released in the UK today. The core CPI is expected to rise from 5.8% y/y to 5.9% y/y, while the overall CPI could rise from 9.4% y/y to 9.8% y/y. Only a slight weakening is expected in producer prices - their selling prices may show an increase of 16.2% y/y against 16.5% y/y a month earlier. Thus, the option with the pound's growth is possible, we will consider its details on the four-hour chart.

Growth is limited by the MACD indicator line on the H4 chart, approximately at the level of 1.2170. At the current moment, the signal line of the Marlin Oscillator is turning down from the border with the territory of the growing trend. Therefore, consolidating under 1.2100 will resume the price decline in its main direction. First target at 1.1965.

https://forex-images.ifxdb.com/userfiles/20220817/analytics62fc576171afd.jpg

Analysis are provided by InstaForex.

Read More

Best regards, PR Manager / Learn more about InstaForex Company at http://instaforex.com

Re: InstaForex Analysis

Forex Analysis & Reviews: Forecast for EUR/USD on August 18, 2022

The euro rose by 11 points yesterday, the upper shadow of the daily candle did not reach the MACD line by 3 points (up to 1.0206), today this line slightly dropped to the price of 1.0202.

https://forex-images.ifxdb.com/userfiles/20220818/analytics62fda89e9849e.jpg

The price may work out the line, it may exit slightly above it with the upper shadow, it may go down immediately, but in general, we are waiting for the price to go under 1.0150 and further move towards the target level of 1.0020.

The signal line of the Marlin Oscillator also did not reach the zero line on the four-hour chart, so there is a possibility that the pattern of the synchronous reversal of the price and the oscillator from their resistances will end. In general, the corrective growth of the last 9-11 candles can be considered complete.

https://forex-images.ifxdb.com/userfiles/20220818/analytics62fda88a557b4.jpg

Analysis are provided by InstaForex.

Read More

Best regards, PR Manager / Learn more about InstaForex Company at http://instaforex.com

Re: InstaForex Analysis

Forex Analysis & Reviews: Technical Analysis of GBP/USD for August 19, 2022

Technical Market Outlook:
The GBP/USD pair has been seen testing the trend line support around the level of 1.1916. Any sustained violation of the level of 1.1916 will likely result in another down wave towards the level of 1.1890 and below. The momentum is weak and negative already at the H4 time frame chart, so the bearish dominance is obvious, however the market conditions on the H4 time frame chart are now extremely oversold. Please keep an eye on the trend line breakout/bounce (thick orange line on the chart) as the price action around the line will give us more clues regarding the down move strength. The larger time frame trend (daily and weekly) remains down until further notice.

https://forex-images.ifxdb.com/userfiles/20220819/analytics62ff2a01822dd.jpg

Weekly Pivot Points:
WR3 - 1.2206
WR2 - 1.2156
WR1 - 1.2141
Weekly Pivot - 1.2123
WS1 - 1.2099
WS2 - 1.2082
WS3 - 1.2040

Trading Outlook:
The Cable is way below 100 and 200 DMA , so the bearish domination is clear and there is no indication of down trend termination or reversal. The bulls are now trying to start the corrective cycle after a big Bullish Engulfing candlestick pattern was made on the weekly time frame chart, however there is no visible progress here yet. The next long term target for bears is seen at the level of 1.1410. Please remember: trend is your friend.

*The market analysis posted here is meant to increase your awareness, but not to give instructions to make a trade.

Analysis are provided by InstaForex.

Read More

Best regards, PR Manager / Learn more about InstaForex Company at http://instaforex.com

Re: InstaForex Analysis

Forex Analysis & Reviews: USDCAD Potential For Bullish Rise | 22nd August 2022

https://forex-images.ifxdb.com/userfiles/20220822/analytics6302f6e80315a.jpg

On the H4, with the price above the ichimoku cloud and moving within the ascending trendline, we have a bullish bias that the price may rise from the 1st resistance at 1.30067, which is the 78.6% fibonacci projection to the 2nd resistance at 1.30508, which is in line with the previous swing highs and 100% fibonacci projection. Alternatively, the price may drop to the 1st support at 1.29415, where the 23.6% fibonacci retracement is. If the price break this level, we can expect it to drop to 2nd support at 1.29014, where the 38.2% fibonacci retracement is.

Trading Recommendation
Entry: 1.30067 Reason for Entry: 78.6% fibonacci projection
Take Profit: 1.30508
Reason for Take Profit: 100% fibonacci projection and previous swing highs
Stop Loss: 1.29415
Reason for Stop Loss:
23.6% fibonacci retracement

*The market analysis posted here is meant to increase your awareness, but not to give instructions to make a trade.

Analysis are provided by InstaForex.

Read More

Best regards, PR Manager / Learn more about InstaForex Company at http://instaforex.com

Re: InstaForex Analysis

Forex Analysis & Reviews: Forecast for EUR/USD on August 23, 2022

The euro did not linger in consolidation at 1.0020 on Monday and, as it falls, reached the next bearish target level of 0.9950. Now the next target (0.9850) is open. The reason for this was serious fears (over the past month) regarding the global recession. The German stock index DAX fell by 2.32%, the US S&P 500 by -2.14%.

https://forex-images.ifxdb.com/userfiles/20220823/analytics63043c1d986ee.jpg

The price settled under the target level of 0.9950 on the four-hour chart. Apparently, the price will rest a bit under this level, consolidate, and then continue to decline.

https://forex-images.ifxdb.com/userfiles/20220823/analytics63043c2b7bee2.jpg

Business activity figures for the euro area for August will be published today - negative forecasts: Manufacturing PMI is expected to fall from 49.8 to 48.9, Services PMI may drop from 51.2 to 50.5.

*The market analysis posted here is meant to increase your awareness, but not to give instructions to make a trade.

Analysis are provided by InstaForex.

Read More

Best regards, PR Manager / Learn more about InstaForex Company at http://instaforex.com

Re: InstaForex Analysis

Forex Analysis & Reviews: USDCAD Potential For Bullish Rise | 24th August 2022

https://forex-images.ifxdb.com/userfiles/20220824/analytics6305a30dba497.jpg

On the H4, with the price above the ichimoku cloud and moving within the ascending trendline, we have a bullish bias that if the price break the 1st resistance at 1.29836, which is the current swing high and 38.2% fibonacci retracement, the price may rise to the 2nd resistance at 1.30632, which is in line with the swing high. Alternatively, the price may drop to the 1st support at 1.28899, where the 50% fibonacci retracement is. Take note the price of 1.29328 could be the intermediate support, if the price breaks this support, the ascending trendline will be broken.

Trading Recommendation
Entry: 1.29836
Reason for Entry: Current swing high and 38.2% fibonacci retracement,
Take Profit: 1.30632
Reason for Take Profit: Swing highStop Loss: 1.28899
Reason for Stop Loss:
50% fibonacci retracement

*The market analysis posted here is meant to increase your awareness, but not to give instructions to make a trade.

Analysis are provided by InstaForex.

Read More

Best regards, PR Manager / Learn more about InstaForex Company at http://instaforex.com

Re: InstaForex Analysis

Forex Analysis & Reviews: NZDUSD Potential for Bearish Drop | 25th August 2022

https://forex-images.ifxdb.com/userfiles/20220825/analytics6306f1ff7099c.jpg

On the H4, with price moving below the ichimoku indicator, we have a bearish bias that price will drop from 1st resistance at 0.62122 where the pullback overlap resistance is to the 1st support at 0.60612 where the swing low support and 161.8% fibonacci extension are. Alternatively, price could break 1st resistance and rise to 2nd resistance at 0.63160 where the overlap resistance, 50% fibonacci retracement and 61.8% fibonacci projection are.

Trading Recommendation
Entry: 0.62122
Reason for Entry:Pullback overlap resistance
Take Profit: 0.60612
Reason for Take Profit: Swing low support and 161.8% fibonacci extension
Stop Loss: 0.63160
Reason for Stop Loss:
Overlap resistance, 50% fibonacci retracement and 61.8% fibonacci projection

*The market analysis posted here is meant to increase your awareness, but not to give instructions to make a trade.

Analysis are provided by InstaForex.

Read More

Best regards, PR Manager / Learn more about InstaForex Company at http://instaforex.com

Re: InstaForex Analysis

Forex Analysis & Reviews: Forecast for EUR/USD on August 26, 2022

The euro practically stood still on Thursday, in anticipation of Federal Reserve Chairman Jerome Powell's speech at the banking conference in Jackson Hole today. However, the upper shadow of the daily candle tested the resistance level of 1.0020.

https://forex-images.ifxdb.com/userfiles/20220826/analytics6308331593fbe.jpg

Now the price is approaching the support at 0.9950, after which the path to 0.9850 will open. In the process of a decline, the signal line of the Marlin Oscillator will go under the turquoise line of weak convergence, which will eliminate it and take on the formation of a less steep, but more solid convergence, from the pink dashed line.

On a four-hour scale, yesterday's top was marked on the balance indicator line. The price is in a strong downward position, but the Marlin Oscillator, which is still in the positive area, should confirm its intention for further decline. With the price consolidating below 0.9950, Marlin may find itself in the territory of negative values

https://forex-images.ifxdb.com/userfiles/20220826/analytics63083323839c3.jpg

*The market analysis posted here is meant to increase your awareness, but not to give instructions to make a trade.

Analysis are provided by InstaForex.

Read More

Best regards, PR Manager / Learn more about InstaForex Company at http://instaforex.com

Re: InstaForex Analysis

Forex Analysis & Reviews: Forecast for GBP/USD on August 29, 2022

Last Friday, the pound once again bounced as part of the upward correction from August 23, marking in the area where the balance and MACD indicator lines coincide on the daily scale chart and fell, closing the day with a loss of 94 points.

https://forex-images.ifxdb.com/userfiles/20220829/analytics630c2ce398f3c.jpg

At the moment the price is testing the target level of 1.1650. Having overcome it, a close target at 1.1650 opens. Behind it is the 1.1525 target. The Marlin oscillator still has enough room ahead for an easy move before it enters the oversold zone.

The price settled below the indicator lines on the H4 chart, the Marlin Oscillator is falling in negative territory. The trend is downward. *The market analysis posted here is meant to increase your awareness, but not to give instructions to make a trade.

Analysis are provided by InstaForex.

Read More

Best regards, PR Manager / Learn more about InstaForex Company at http://instaforex.com

Posts: 1,126 to 1,150 of 1,547

Pages Previous 1 44 45 46 47 48 62 Next

You must login or register to post a reply

Forex Software → Market Analysis → InstaForex Analysis

Similar topics in this forum