forex software

Create and Test Forex Strategies

forex software

Skip to forum content

Forex Software

Create and Test Forex Strategies

You are not logged in. Please login or register.


(Page 45 of 62)

Forex Software → Market Analysis → InstaForex Analysis

Pages Previous 1 43 44 45 46 47 62 Next

You must login or register to post a reply

RSS topic feed

Posts: 1,101 to 1,125 of 1,547

Re: InstaForex Analysis

Forex Analysis & Reviews: Technical Analysis of EUR/USD for June 20, 2022

Technical Market Outlook:
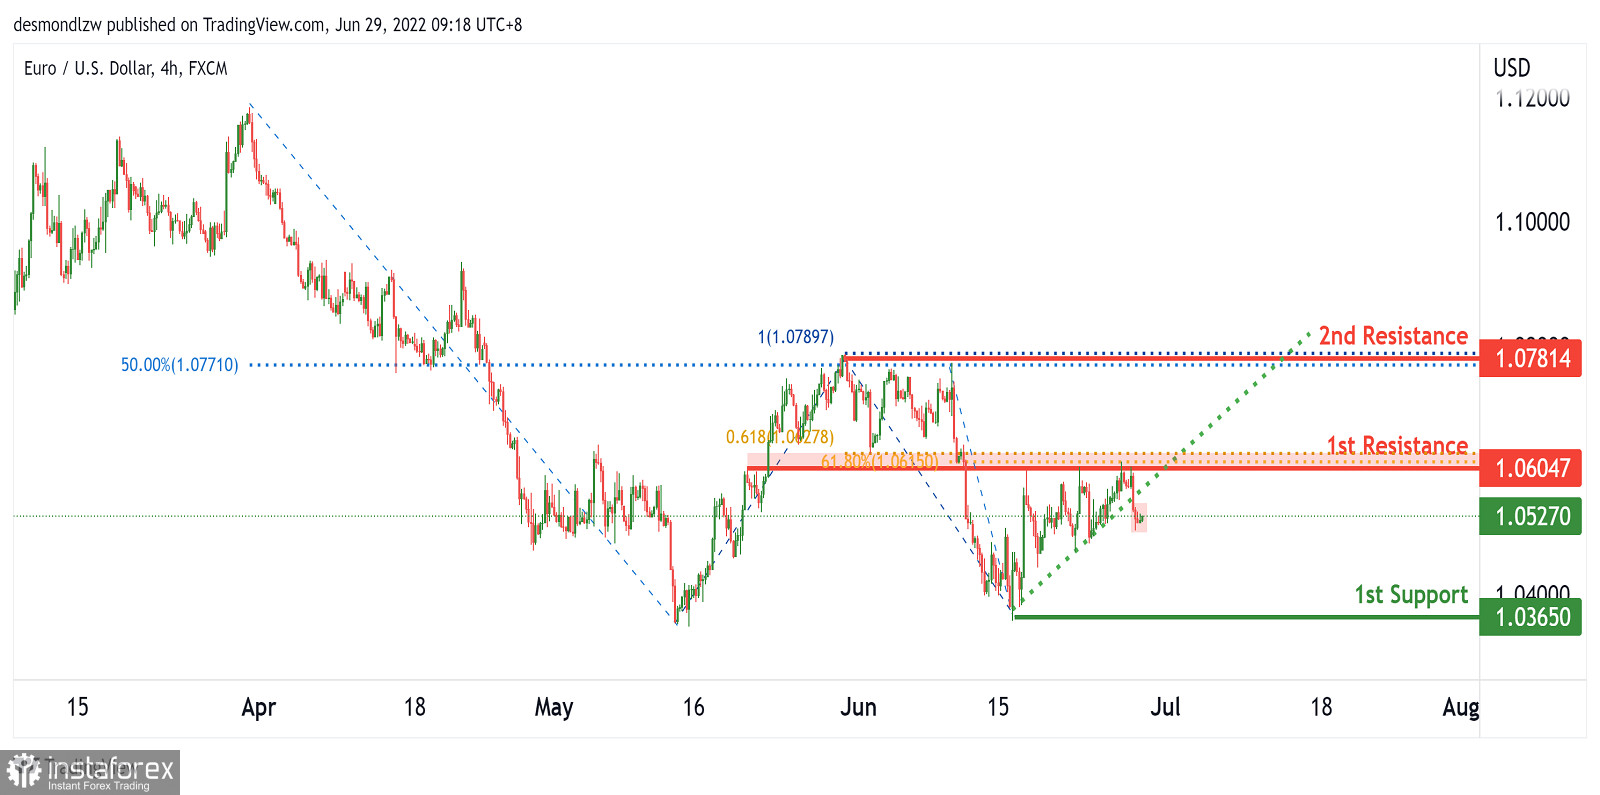
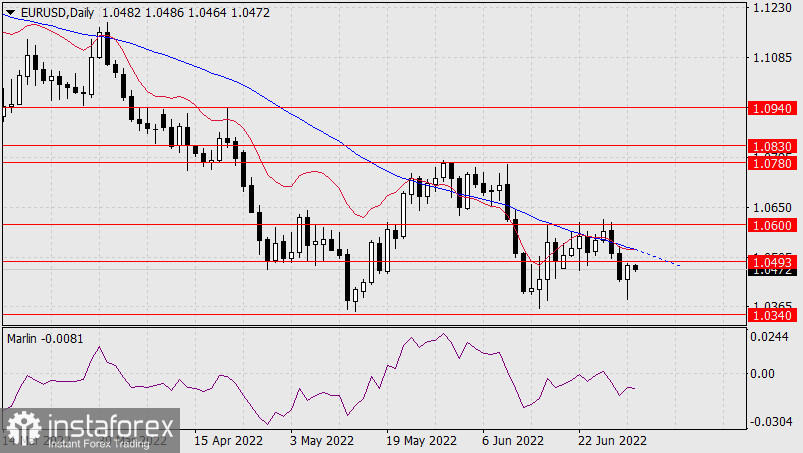
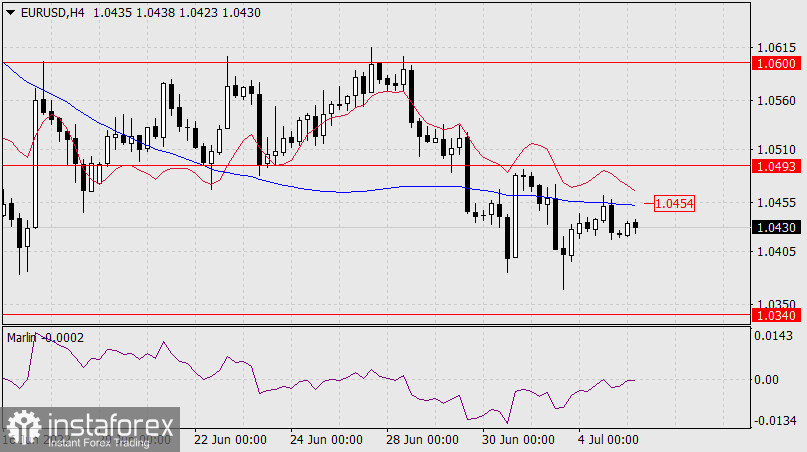
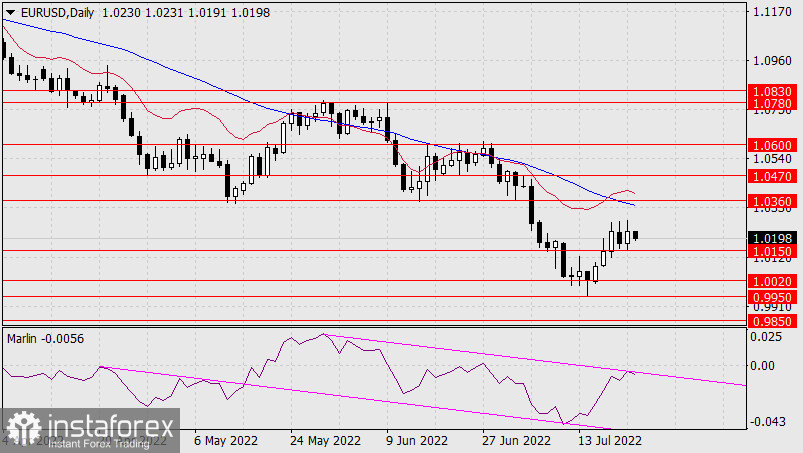
The EUR/USD pair had almost retraced 61% of the last wave down and made a Pin Bar candlestick at the level of 1.0661, 14 pips away from the Fibonacci retracement level. Since then, the bulls keep trying to continue the bounce, keep making the local pull-backs, but the level of 1.0615 is still unreachable for them. The nearest technical support is seen at 1.0469 - 1.0448, so as long as the market trades above this zone, the outlook remains bullish. Please notice, that despite the recent efforts, the bulls are still trading inside the bearish zone and they need to break above the level of 1.0678 to enter the bullish zone.

https://forex-images.ifxdb.com/userfiles/20220620/analytics62b0192af2da3_source!.jpg

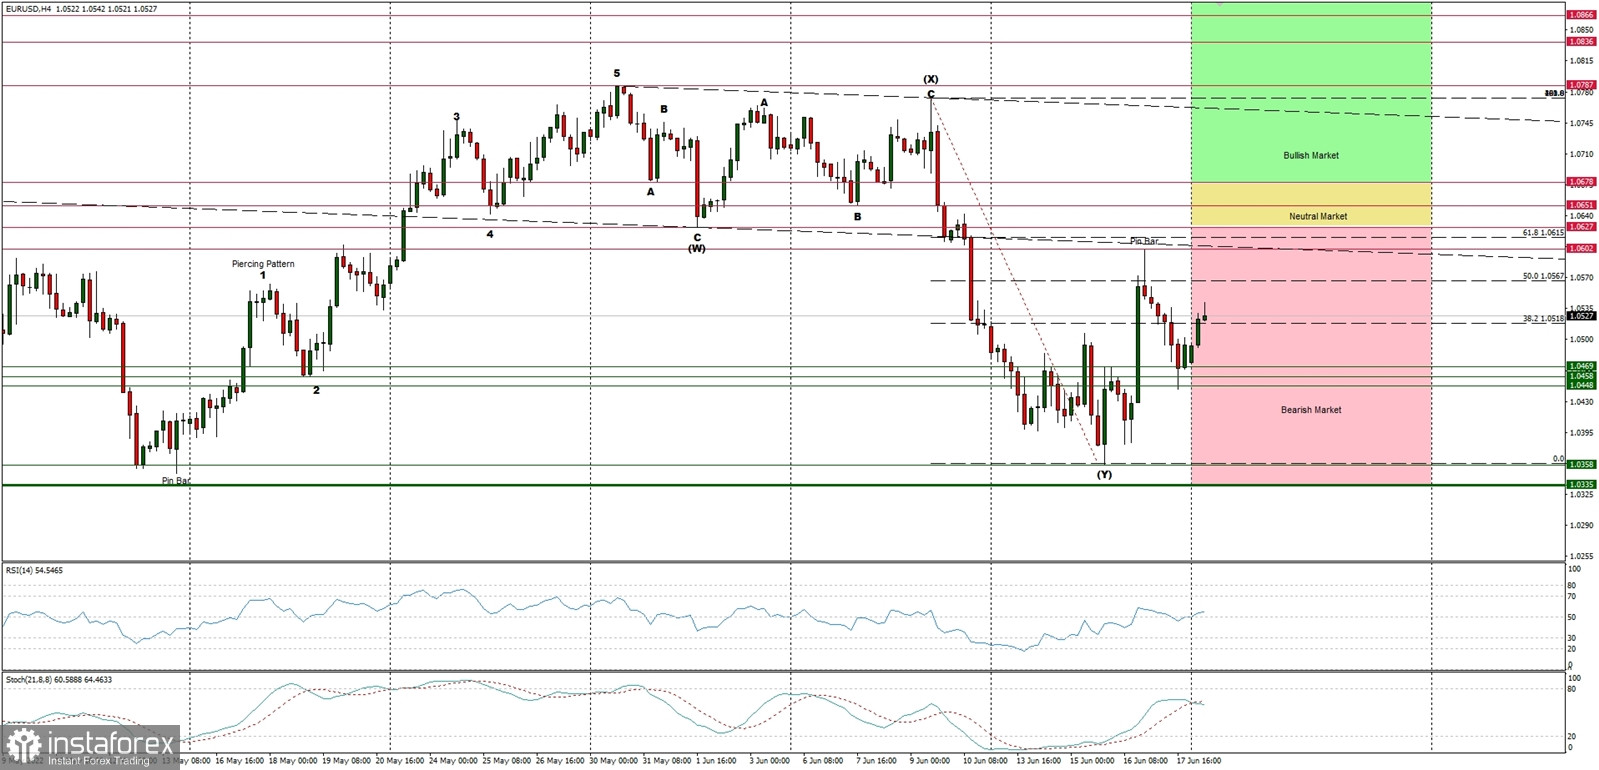
The up trend can be continued towards the next long-term target located at the level of 1.1186 only if the complex corrective structure will terminate soon (above 1.0335) and the market breaks above 1.0678 level. The bullish cycle scenario is confirmed by breakout above the level of 1.0726, otherwise the bears will push the price lower towards the next long-term target at the level of 1.0335 or below.

Analysis are provided byInstaForex.

Read More https://ifxpr.com/3QBGjgn

Best regards, PR Manager / Learn more about InstaForex Company at http://instaforex.com

Re: InstaForex Analysis

Forex Analysis & Reviews: ETHUSD, Potential For Bearish drop | 21st June 2022

https://forex-images.ifxdb.com/userfiles/20220621/analytics62b1555201fd2_source!.jpg

Description On the H4, with price moving below our ichimoku cloud, we have a bearish bias that price will drop to our 1st support at 702 in line with the 78.6% Fibonacci projection level from our 1st resistance at 1282 in line with the horizontal pullback resistance is. Alternatively, price may not break structure and head for our 2nd resistance at 1739 where the pullback resistance and 23.6% Fibonacci retracement.

Trading Recommendation
Entry: 1282 Reason for Entry: Horizontal pullback resistance
Take Profit: 702Reason for Take Profit:78.6% Fibonacci projection
Stop Loss: 1739 Reason for Stop Loss:Horizontal pullback resistance and 23.6% Fibonacci retracement

Analysis are provided byInstaForex.

Read More https://ifxpr.com/3zRXEfl

Best regards, PR Manager / Learn more about InstaForex Company at http://instaforex.com

Re: InstaForex Analysis

Forex Analysis & Reviews: GBPUSD Potential For Bullish Continuation | 22nd June 2022

https://forex-images.ifxdb.com/userfiles/20220622/analytics62b285f6c641a_source!.jpg

Description: On the H4, with prices expected to bounce off the ichimoku support, we have a bullish bias that price will rise from our 1st support at 1.21846 where the horizontal overlap support,50% fibonacci retracement and 61.8% fibonacci projection to our 1st resistance at 1.24327 in line with the 61.8% fibonacci projection, 78.6% fibonacci retracement and pullback resistance. Alternatively, price may break 1st support structure and head for 2nd support at 1.19313 where the horizontal swing low support is.

Trading Recommendation
Entry: 1.21846Reason for Entry:horizontal overlap support,50% fibonacci retracement and 61.8% fibonacci projection
Take Profit: 1.24327Reason for Take Profit:61.8% fibonacci projection, 78.6% fibonacci retracement and pullback resistance
Stop Loss: 1.19313Reason for Stop Loss: horizontal swing low support

Analysis are provided byInstaForex.

Best regards, PR Manager / Learn more about InstaForex Company at http://instaforex.com

Re: InstaForex Analysis

Forex Analysis & Reviews: USDCHF, Potential For Bullish rise | 23rd June 2022

https://forex-images.ifxdb.com/userfiles/20220623/analytics62b3f5b60010d_source!.jpg

Description : On the H4, with the price expected to bounce off the RSI indicator, we have a bearish bias that price will rise from our 1st support at 0.95475 where the horizontal swing low support and 100% Fibonacci projection is to our 1st resistance at 0.97148 in line with the horizontal swing high resistance. Alternatively, price may break structure and head for 2nd support at 0.94114 where the 127.2% Fibonacci extension is.

Trading Recommendation
Entry: 0.95475 Reason for Entry: Horizontal swing low support and 100% Fibonacci projection
Take Profit: 0.97148Reason for Take Profit:Horizontal swing high resistance
Stop Loss: 0.94114Reason for Stop Loss:127.2% Fibonacci extension

Analysis are provided byInstaForex.

Read More https://ifxpr.com/3zRXEfl

Best regards, PR Manager / Learn more about InstaForex Company at http://instaforex.com

Re: InstaForex Analysis

Forex Analysis & Reviews: USDJPY Potential For Bullish Continuation | 24th June 2022

https://forex-images.ifxdb.com/userfiles/20220624/analytics62b53fdc0b60e_source!.jpg

Description:
On the H4, with price moving above the ichimoku indicator, we have a bullish bias that price will rise from our 1st support at 135.536 in line with the pullback support and 23.6% fibonacci retracement to our 1st resistance at 138.846 where the 161.8% fibonacci extension and 78.6% fibonacci projection are . Alternatively, price may break 1st support structure and head for 2nd support at 131.607 in line with the swing low support,78.6% fibonacci projection and 50% fibonacci retracement.

Trading Recommendation
Entry: 135.536
Reason for Entry:horizontal pullback support and 23.6% fibonacci retracement
Take Profit: 138.846
Reason for Take Profit:161.8% fibonacci extension and 78.6% fibonacci projection
Stop Loss: 131.607
Reason for Stop Loss: horizontal swing low support,78.6% fibonacci projection and 50% fibonacci retracement

Analysis are provided byInstaForex.

Best regards, PR Manager / Learn more about InstaForex Company at http://instaforex.com

Re: InstaForex Analysis

Forex Analysis & Reviews: USDCAD, Potential For Bullish Bounce | 27th June 2022

https://forex-images.ifxdb.com/userfiles/20220627/analytics62b959c57396c_source!.jpg

On the H4, with price expected to bounce off the stochastics indicator, we have a bullish bias that price will rise from our 1st support at 1.28647 where the horizontal swing low support and 38.2% Fibonacci retracement is to our 1st resistance at 1.30128 in line with the horizontal swing high resistance. Alternatively, price may break structure and head for 2nd support where the horizontal pullback support and 61.8% Fibonacci retracement.

Trading Recommendation
Entry: 1.28647 Reason for Entry: Horizontal swing low support and 38.2% Fibonacci retracement
Take Profit: 1.30128
Reason for Take Profit: Horizontal swing high resistanceStop Loss: 1.27189 Reason for Stop Loss:
Horizontal pullback support and 61.8% Fibonacci retracement

Analysis are provided byInstaForex.

Best regards, PR Manager / Learn more about InstaForex Company at http://instaforex.com

Re: InstaForex Analysis

Forex Analysis & Reviews: Elliott wave analysis of Gold for June 28, 2022

https://forex-images.ifxdb.com/userfiles/20220628/analytics62ba895685ec7_source!.jpg

Gold has been consolidating since it peaked at 2,075 in August 2020. With higher lows, it's likely that an ascending triangle is developing. If this is the case, we should see a rally towards the resistance line near 2,075 before a final corrective decline to 1,890 before the real take-off towards 2,400 and 2,700.

That said, it's important to remember, that fifth waves within the commodity complex often become runaway rallies. If this is the case here too, then 2,700 may be just a minor bump on the way higher to 3,340.

In the short term, a break above minor resistance at 1,857 will call for a rally towards 2,075 in wave D.

Analysis are provided byInstaForex.

Read More https://ifxpr.com/3zRXEfl

Best regards, PR Manager / Learn more about InstaForex Company at http://instaforex.com

Re: InstaForex Analysis

Forex Analysis & Reviews: EURUSD Potential For Bearish Continuation | 29th June 2022

https://forex-images.ifxdb.com/userfiles/20220629/analytics62bbd4d335391_source!.jpg

On H4, with price recently breaking the ascending trendline, we have a bearish bias that price will continue to drop from the 1st resistance at 1.06047 at the pullback resistance in line with the 61.8% fibonacci projection and 61.8% fibonacci retracement to the 1st support at 1.03541 in line with the multiple horizontal swing lows. Alternatively, price may reverse off the 1st resistance and rise to the 2nd resistance at 1.07814 at the horizontal swing high in line with the 50% fibonacci retracement and 100% Fibonacci projection.

Trading Recommendation
Entry: 1.06047
Reason for Entry:
Pullback resistance in line with the 61.8% fibonacci projection and 61.8% fibonacci retracementTake Profit: 1.03541
Reason for Take Profit:Multiple horizontal swing lowsStop Loss: 1.07814 Reason for Stop Loss:
Horizontal swing high in line with the 50% fibonacci retracement and 100% Fibonacci projection.

Analysis are provided byInstaForex.

Best regards, PR Manager / Learn more about InstaForex Company at http://instaforex.com

Re: InstaForex Analysis

Forex Analysis & Reviews: Technical Analysis of GBP/USD for June 30, 2022

Technical Market Outlook:
The GBP/USD pair has been rejected from the main channel lower line as the bulls failed to rally back inside the main channel. The price went lower to break below the key short-term technical support seen at the level of 1.2165 - 1.2155 and now this level is being tested from below. If the bearish pressure intensify and the level of 1.2165 holds, the next target for bears is seen at the level of 1.2072 or below. The supply zone located between the levels of 1.2618 - 1.2697 is still the main obstacle for bulls that needs to be broken if the rally is expected to be continued, but for now bulls can not even get back to the main channel.

https://forex-images.ifxdb.com/userfiles/20220630/analytics62bd3b3474e30_source!.jpg

Weekly Pivot Points:
WR3 - 1.2507
WR2 - 1.2415
WR1 - 1.2351
Weekly Pivot - 1.2242
WS1 - 1.2181
WS2 - 1.2088
WS3 - 1.2017

Trading Outlook:
The price broke below the level of 1.3000 quite long time ago, so the bears enforced and confirmed their control over the market in the long term. The Cable is way below 100 and 200 WMA , so the bearish domination is clear and there is no indication of trend termination or reversal. The bulls are now trying to start the corrective cycle after a big Pin Bar candlestick pattern was made last week. The next long term target for bears is seen at the level of 1.1989. Please remember: trend is your friend.

Analysis are provided byInstaForex.

Best regards, PR Manager / Learn more about InstaForex Company at http://instaforex.com

Re: InstaForex Analysis

Forex Analysis & Reviews: Forecast for EUR/USD on July 1, 2022

Mixed data on Europe and the US came out on Thursday, which led to a breakthrough of counter-dollar currencies into correction, the dollar index lost 0.39% on the day. If you look closely at adjacent markets, and there the yield on 5-year US government bonds decreased from 3.13% to 3.04% and the S&P 500 fell by 0.88% while gold fell by 0.55%, then the idea arises that the growth of the euro and other currencies occurred primarily due to the short-term weakness of the dollar itself. This weakness may extend the corrective growth of the euro to the MACD line on the daily chart (1.0515), but then we are waiting for a new round of weakening of the single currency.

https://forex-images.ifxdb.com/userfiles/20220701/analytics62be5a60efd98_source!.jpg

The eurozone CPI for June will be released today, the forecast for it is 8.4% Y/Y against 8.1% Y/Y in May. The US ISM index of business activity in the manufacturing sector for June will also be published, the forecast for which is 54.9 against 56.1 earlier. The discrepancy in the data may help the euro to technically finalize the correction.

On the EUR/USD daily chart, the price is near the target level of 1.0493, which was not worked out yesterday, this is a technical factor of the price's desire to go above this resistance to the MACD line (1.0515). The price could also fall from current levels if the dollar's weakness was due to speculative reasons, then large players will open long positions on the dollar due to the positions of euro optimists. Ultimately, we are still waiting for the euro at the target level of 1.0340 - at the low of January 2017.

The price has settled above the MACD indicator line on the four-hour chart, but the Marlin Oscillator is still in the negative zone. As in the daily chart, the current situation is not defined. Consolidating below the MACD line will increase the chances of moving downward, settling above the level of 1.0493 will slightly delay the euro with a reversal into a new wave of weakening.

https://forex-images.ifxdb.com/userfiles/20220701/analytics62be5a7319cea_source!.jpg

Analysis are provided byInstaForex.

Read More

Best regards, PR Manager / Learn more about InstaForex Company at http://instaforex.com

Re: InstaForex Analysis

Forex Analysis & Reviews: Elliott wave analysis of NZD/USD for July 4, 2022

https://forex-images.ifxdb.com/userfiles/20220704/analytics62c273aa1bde8_source!.jpg

NZD/USD is still correcting the long-term decline from the 1.4900 high in 1973 to 0.3900 in 2000 and we are looking for a continuation higher to the 50% corrective target at 0.9450 before the correction is complete.

In the short term, we expect support near 0.6050 to be able to protect the downside for the next impulsive rally towards our long-term target near 0.9450 to complete the correction and come under new downside pressure.

*The market analysis posted here is meant to increase your awareness, but not to give instructions to make a trade.

Analysis are provided byInstaForex.

Read More https://ifxpr.com/3ybs4Xu

Best regards, PR Manager / Learn more about InstaForex Company at http://instaforex.com

Re: InstaForex Analysis

Forex Analysis & Reviews: Forecast for EUR/USD on July 5, 2022

In the absence of American players on the market yesterday, the euro did not fall, and growth is planned this morning. The correction will probably continue to the target level of 1.0493 with a slight overlap, until the MACD indicator line of the daily scale (1.0515) is worked out.

https://forex-images.ifxdb.com/userfiles/20220705/analytics62c3a4d218f0d_source!.jpg

The daily Marlin Oscillator is turning up, helping the correction. From the indicated resistances, a price reversal to the target level of 1.0340 is likely. If the price settles above 1.0493 (this is an alternative), the price will continue to rise to the target level of 1.0600. Yesterday's small attempt to increase the price was stopped by the MACD indicator line of the four-hour scale. The Marlin Oscillator is currently crossing the border with the territory of the growing trend, which helps the price to re-attack the MACD line (1.0454). Breaking this line will open the 1.0493 target.

https://forex-images.ifxdb.com/userfiles/20220705/analytics62c3a4dc3114e_source!.jpg

*The market analysis posted here is meant to increase your awareness, but not to give instructions to make a trade.

Analysis are provided byInstaForex.

Read More

Best regards, PR Manager / Learn more about InstaForex Company at http://instaforex.com

Re: InstaForex Analysis

Forex Analysis & Reviews: Forecast for EUR/USD on July 6, 2022

The euro fell 158 points yesterday, leaving the nearest support at 1.0340 far behind. The decline in the euro was qualitative - the fall occurred in all major stock exchange values: Dow Jones -0.42%, EuroStoxx50 -2.68%, oil -8.34% (WTI), the yield on 5-year US government bonds decreased from 2.91 % to 2.82%.

https://forex-images.ifxdb.com/userfiles/20220706/analytics62c4ffed07a5a_source!.jpg

The fall in the Eurozone Composite PMI for June from 54.8 to 52.0 added to this. Obviously, the price is now facing the 1.0170 target. We are waiting for a correction from this level, and then again a decline to a new bearish target of 1.0020. The price fell with a reversal from the MACD indicator line on a four-hour scale. The price settled under the level of 1.0340. The Marlin Oscillator is rising slightly correctively, after which it will be ready to continue the decline along with the price.

https://forex-images.ifxdb.com/userfiles/20220706/analytics62c4fffd81a95_source!.jpg

*The market analysis posted here is meant to increase your awareness, but not to give instructions to make a trade.

Analysis are provided byInstaForex.

Read More

Best regards, PR Manager / Learn more about InstaForex Company at http://instaforex.com

Re: InstaForex Analysis

GBPUSD Potential For Bearish Continuation | 7th July 2022

On the H4, with prices moving below the ichimoku indicator and within the descending channel, we have a bearish bias that price will drop from our 1st resistance at 1.19313 where the horizontal pullback resistance and 61.8% fibonacci projection are to our 1st support at 1.18235 where the 161.8% fibonacci extension, -61.8% fibonacci expansion and 61.8% fibonacci projection are. Alternatively, price could rise to 2nd resistance at 1.19762 in line with the pullback resistance, 100% fibonacci projection and 38.2% fibonacci retracement.

Trading Recommendation

Entry: 1.19313

Reason for Entry:

Horizontal pullback resistance

Take Profit: 1.18235

Reason for Take Profit:161.8% fibonacci extension, -61.8% fibonacci expansion and 61.8% fibonacci projection

Stop Loss: 1.19762

Reason for Stop Loss:

Pullback resistance, 100% fibonacci projection and 38.2% fibonacci retracement

Best Regards,PR Manager
InstaForex Companies Group

Re: InstaForex Analysis

Forex Analysis & Reviews: Elliott wave analysis of GBP/JPY for July 8, 2022

https://forex-images.ifxdb.com/userfiles/20220708/analytics62c7b059d3c31_source!.jpg

We are looking for a break below support at 159.98 to confirm that the X-wave has peaked at 168.98 and wave Y now is in motion towards the 150.09 target and possibly even lower to the 61.8% corrective target near 145.72.

We expect minor resistance at 164.62 will be able to cap the upside for a break below support at 159.98 confirming the next part of the decline towards 150.09. *The market analysis posted here is meant to increase your awareness, but not to give instructions to make a trade.


Analysis are provided byInstaForex.

Read More

Best regards, PR Manager / Learn more about InstaForex Company at http://instaforex.com

Re: InstaForex Analysis

Forex Analysis & Reviews: Technical Analysis of GBP/USD for July 11, 2022

Technical Market Outlook: The GBP/USD pair has retraced 61% of the last wave down and hit the level of 1.2054, however after the pull-back the bulls are still trying to resume the bounce. Despite this bounce, the weak and negative momentum on the H4 time frame chart supports the bearish outlook. The supply zone located between the levels of 1.2160 - 1.2187 is still the main short-term obstacle for bulls that needs to be broken if the rally is expected to be continued.

https://forex-images.ifxdb.com/userfiles/20220711/analytics62cbad5139118_source!.jpg

Weekly Pivot Points:
WR3 - 1.2601
WR2 - 1.2311
WR1 - 1.2169
Weekly Pivot - 1.2022
WS1 - 1.1879
WS2 - 1.1732
WS3 - 1.14433

Trading Outlook: The price broke below the level of 1.3000 quite long time ago, so the bears enforced and confirmed their control over the market in the long term. The Cable is way below 100 and 200 WMA , so the bearish domination is clear and there is no indication of trend termination or reversal. The bulls are now trying to start the corrective cycle after a big Pin Bar candlestick pattern was made on the weekly time frame chart. The next long term target for bears is seen at the level of 1.1989. Please remember: trend is your friend.

*The market analysis posted here is meant to increase your awareness, but not to give instructions to make a trade.

Analysis are provided byInstaForex.

Read More

Best regards, PR Manager / Learn more about InstaForex Company at http://instaforex.com

Re: InstaForex Analysis

Forex Analysis & Reviews: Forecast for EUR/USD on July 12, 2022

The euro fell by 146 points on Monday and almost reached the target level of 1.0020. The Marlin Oscillator has shown a small reversal from the oversold zone and the price is close to correction, but if the target level of 1.0020 is overcome, then the bears' last effort may reach the target of 0.9950. Further, a correction to the area of 1.0100/70 is likely.

https://forex-images.ifxdb.com/userfiles/20220712/analytics62cce2dba8f2f_source!.jpg

A more aggressive price decline is possible, in this case, the price could reach the 0.9850 target, and then we are waiting for a correction to 1.0020. The main scenario is marked with dotted lines on the four-hour chart. According to this plan, the price will reach the nearest target level of 0.9950, the Marlin Oscillator will form a convergence with the price, and the correction will focus on the MACD indicator line (1.0170 or slightly lower).

https://forex-images.ifxdb.com/userfiles/20220712/analytics62cce2e7ad0d2_source!.jpg

Analysis are provided by InstaForex.

Read More

Best regards, PR Manager / Learn more about InstaForex Company at http://instaforex.com

Re: InstaForex Analysis

Forex Analysis & Reviews: USDCHF, Potential For Bullish Bounce | 13th July 2022

https://forex-images.ifxdb.com/userfiles/20220713/analytics62ce3e886c874_source!.jpg

On the H4, with price moving above the ichimoku cloud, we have a bullish bias that price will rise from our 1st support at 0.97233 where the horizontal pullback support is to our 1st resistance at 1.00485 in line with the 100% Fibonacci projection is. Alternatively, price may not break 1st support and head for 2nd support at 0.95268 where the horizontal pullback support.

Trading Recommendation
Entry: 0.97233 Reason for Entry: Horizontal pullback support Take Profit: 1.00485
Reason for Take Profit: 100% Fibonacci projection
Stop Loss: 0.95268
Reason for Stop Loss:Horizontal pullback support

*The market analysis posted here is meant to increase your awareness, but not to give instructions to make a trade.

Analysis are provided by InstaForex.

Read More

Best regards, PR Manager / Learn more about InstaForex Company at http://instaforex.com

Re: InstaForex Analysis

Forex Analysis & Reviews: Forecast for EUR/USD on July 14, 2022

Yesterday, the euro traded in a wide range at the support of 1.0020. As a result, the day ended with a white candle of 20 points. This morning the white candle is already covered by the black one, the price is trying to consolidate under the target level of 1.0020. Consolidating below the level opens new bearish targets: 0.9950 and 0.9850.

https://forex-images.ifxdb.com/userfiles/20220714/analytics62cf8467977da_source!.jpg

The signal line of the Marlin Oscillator is developing in its own descending channel on a daily scale. Now there is a slight rebound of the signal line from the lower border of the channel and the prospect of further decline is not great. With the price reaching 0.9850, a deep correction is likely, about three figures. Yesterday's range did not come out of the downward trend on the four-hour chart - the upper shadow was limited by the balance indicator line. The Marlin Oscillator briefly went into the positive area, now it is falling again in the negative area. There is room to move down.

https://forex-images.ifxdb.com/userfiles/20220714/analytics62cf84713bf77_source!.jpg

*The market analysis posted here is meant to increase your awareness, but not to give instructions to make a trade.

Analysis are provided by InstaForex.

Read More

Best regards, PR Manager / Learn more about InstaForex Company at http://instaforex.com

Re: InstaForex Analysis

Forex Analysis & Reviews: Forecast for EUR/USD on July 15, 2022

Yesterday, the euro fulfilled its task - it reached the target support of 0.9950. But the price did not settle under 1.0020 on a daily scale. The signal line of the Marlin Oscillator, having turned up from the lower border of its own descending channel, continues to grow.

https://forex-images.ifxdb.com/userfiles/20220715/analytics62d0d5d4274c0_source!.jpg

Tension is being created on the market, which may turn into a corrective growth up to 1.0170. Visually, at this moment, the oscillator line will touch the upper border of the channel. If the movement of the price and the oscillator are synchronized by that moment, we expect a reversal into a new downward wave from 1.0170. If the price can overcome the support at 0.9950 immediately, then the next target will be the level of 0.9850.

https://forex-images.ifxdb.com/userfiles/20220715/analytics62d0d5bc24feb_source!.jpg

The H4 chart also shows the tension and ambiguity of the situation. The Marlin Oscillator took a neutral state near the zero line, the price returned to the consolidation range on the 12th-14th. It is possible that a full-fledged correction will not take place, the growth can be stopped by the MACD indicator line (1.0105), then the price stop at 1.0020 will continue in the form of a normal consolidation. In this situation, it is advisable to wait a bit, perhaps wait out the correction in order to resume short positions with less risk.

*The market analysis posted here is meant to increase your awareness, but not to give instructions to make a trade.

Analysis are provided by InstaForex.

Read More

Best regards, PR Manager / Learn more about InstaForex Company at http://instaforex.com

Re: InstaForex Analysis

Forex Analysis & Reviews: Forecast for GBP/USD on July 18, 2022

The British pound's growth from last Friday amounted to 42 points. This morning, the pound added another 32 points, coming close to the upper border of the descending wedge on the daily scale chart. Consolidating above it will open the way to the 1.2073 target level. The Marlin Oscillator is set strongly up. Its signal line has already gone above the sloping resistance line.

https://forex-images.ifxdb.com/userfiles/20220718/analytics62d4c7d56834d_source!.jpg

The price's exit from the wedge can transform it into a normal descending channel, the upper hypothetical border of which is indicated on the chart in light green. It will be a complex and ambiguous growth. The Marlin Oscillator is growing in the positive area on the four-hour chart, there is not much left to the MACD line (1.1925). The exit above the line will give the corrective growth an additional charge of optimism. The target will be resistance at 1.2073.

https://forex-images.ifxdb.com/userfiles/20220718/analytics62d4c7e25b455_source!.jpg

Analysis are provided byInstaForex.

Read More

Best regards, PR Manager / Learn more about InstaForex Company at http://instaforex.com

Re: InstaForex Analysis

Forex Analysis & Reviews: Forecast for EUR/USD on July 20, 2022

Yesterday's rumor in the media about the likely increase in the European Central Bank rate on Thursday by 0.50% against the expected 0.25% strengthened the corrective growth of the euro, and with growth in other markets. This news was superimposed and another - the central bank of Switzerland may raise the rate by 0.50-0.75% in September. The US stock index S&P 500 jumped 2.76%.

https://forex-images.ifxdb.com/userfiles/20220720/analytics62d77090c40e1_source!.jpg

Since we consider the euro's growth to be corrective, and the correction from the movement from May 30-31, the target levels are the following: 1.0360 - a low of June 15, 1.0470 - a low of April 28 (or June 22), 1.0600 - resistance June 16-28.

The Marlin Oscillator has left its downward channel to the upside, its potential for further growth does not look very large, since the growth is steep and it will quickly reach the overbought zone.

https://forex-images.ifxdb.com/userfiles/20220720/analytics62d770ba7f985_source!.jpg

The price is growing above the balance and MACD indicator lines on the four-hour chart, the MACD line itself (blue) is turning into growth. The Marlin Oscillator fell a bit on the approach to the overbought zone and is ready to continue moving up. We are waiting for the development of growth to the first target at 1.0360. The daily scale MACD line approaches it. It is possible that all this investor optimism will end even at 1.0360.

*The market analysis posted here is meant to increase your awareness, but not to give instructions to make a trade.

Analysis are provided by InstaForex.

Read More

Best regards, PR Manager / Learn more about InstaForex Company at http://instaforex.com

Re: InstaForex Analysis

Forex Analysis & Reviews: Forecast for GBP/USD on July 21, 2022

The British pound has already tuned in to a breakthrough to the upside, it is only waiting for a signal from external markets. But in order to justify the optimism, the price needs to settle above the MACD line and the target level of 1.2100. Then the first growth target will be the level of 1.2250. But, despite the strong desire of the Marlin Oscillator to get ahead of the price movement, it still remains in the downward trend zone.

https://forex-images.ifxdb.com/userfiles/20220721/analytics62d8beefb935b_source!.jpg

In order to support the price, the Marlin of the daily scale should move into the positive area. A reversal into a new wave of decline may follow from the level of 1.2100. The British currency is completely in an upward position on the H4 chart: the price is turning above the balance and MACD lines, the Marlin Oscillator is also turning up without leaving the rising trend zone. The departure of the price under the MACD line (1.1920) will be the beginning of the downward movement in the medium-term.

https://forex-images.ifxdb.com/userfiles/20220721/analytics62d8befc9919e_source!.jpg

*The market analysis posted here is meant to increase your awareness, but not to give instructions to make a trade.

Analysis are provided by InstaForex.

Read More

Best regards, PR Manager / Learn more about InstaForex Company at http://instaforex.com

Re: InstaForex Analysis

Forex Analysis & Reviews: Forecast for EUR/USD on July 22, 2022

Yesterday, the European Central Bank raised the main rate from 0.00% to 0.50%. Preliminary preparation of the market through the media was successful - by now the euro is at the level of the ECB release - market participants were not inspired by this decision. As a result, we observe the traditional market rule - if the asset does not grow, then it will fall.

https://forex-images.ifxdb.com/userfiles/20220722/analytics62da14860aa0f_source!.jpg

For a medium-term fall of the euro, you need to go under the support level of 1.0150. Targets will open: 1.0020, 0.9950, 0.9850. The Marlin Oscillator is turning down on its approach to the neutral zero level. The signal line of the oscillator fits into the framework of the descending channel.

The price is still above the balance and MACD indicator lines on the H4 chart. The MACD line already cancels the intention to turn up, now it is moving horizontally. The Marlin Oscillator, after sharp fluctuations above the zero line, breaks it down. We are waiting for further development of the euro's downward movement. Supports: 1.0150, 1.0092, 1.0020, 0.9950

https://forex-images.ifxdb.com/userfiles/20220722/analytics62da148fef8ba_source!.jpg

*The market analysis posted here is meant to increase your awareness, but not to give instructions to make a trade.

Analysis are provided by InstaForex.

Read More

Best regards, PR Manager / Learn more about InstaForex Company at http://instaforex.com

Re: InstaForex Analysis

Forex Analysis & Reviews: Forecast for EUR/USD on July 25, 2022

On the daily scale chart, on Friday, it is noticeable how the price touched the support at 1.0150 with its lower shadow and slightly jumped. This morning the price makes another attempt to overcome this level.

https://forex-images.ifxdb.com/userfiles/20220725/analytics62de01633e6d1_source!.jpg

Overcoming 1.0150 will make it possible to develop an attack to the target level of 1.0020. Further, the 0.9950 target will open.

The signal line of the Marlin Oscillator is turning down from the upper border of its own descending channel.

Marlin is developing a bearish attack on the four-hour chart. The support of the MACD line at 1.0100 under the nearest target level of 1.0150. It plays the role of an intermediate resistance on the price path to 1.0020.

https://forex-images.ifxdb.com/userfiles/20220725/analytics62de0172bc88f_source!.jpg

*The market analysis posted here is meant to increase your awareness, but not to give instructions to make a trade.

Analysis are provided by InstaForex.

Read More

Best regards, PR Manager / Learn more about InstaForex Company at http://instaforex.com

Posts: 1,101 to 1,125 of 1,547

Pages Previous 1 43 44 45 46 47 62 Next

You must login or register to post a reply

Forex Software → Market Analysis → InstaForex Analysis

Similar topics in this forum