forex software

Create and Test Forex Strategies

forex software

Skip to forum content

Forex Software

Create and Test Forex Strategies

You are not logged in. Please login or register.


(Page 43 of 62)

Forex Software → Market Analysis → InstaForex Analysis

Pages Previous 1 41 42 43 44 45 62 Next

You must login or register to post a reply

RSS topic feed

Posts: 1,051 to 1,075 of 1,547

Re: InstaForex Analysis

Forex Analysis & Reviews: Forecast for EUR/USD on April 8, 2022

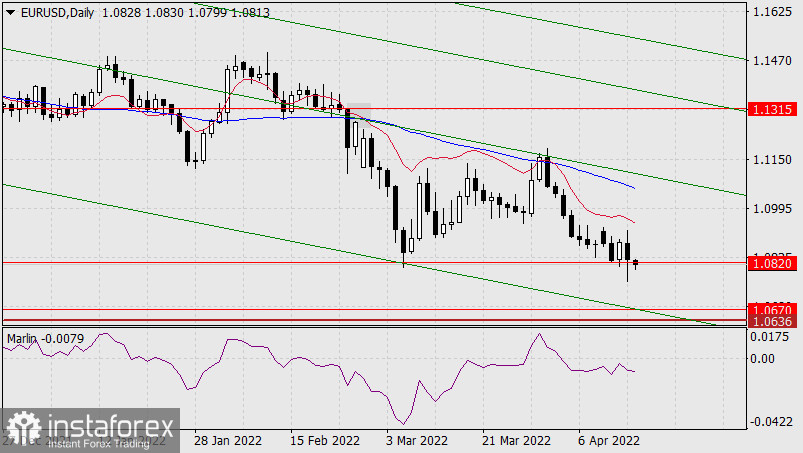
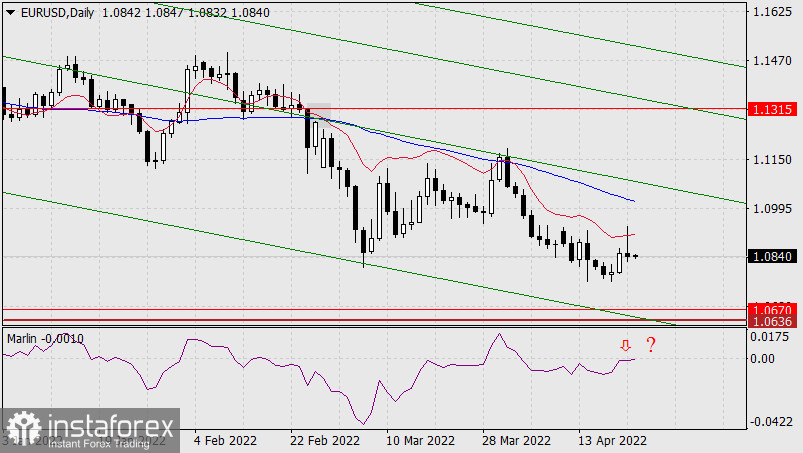
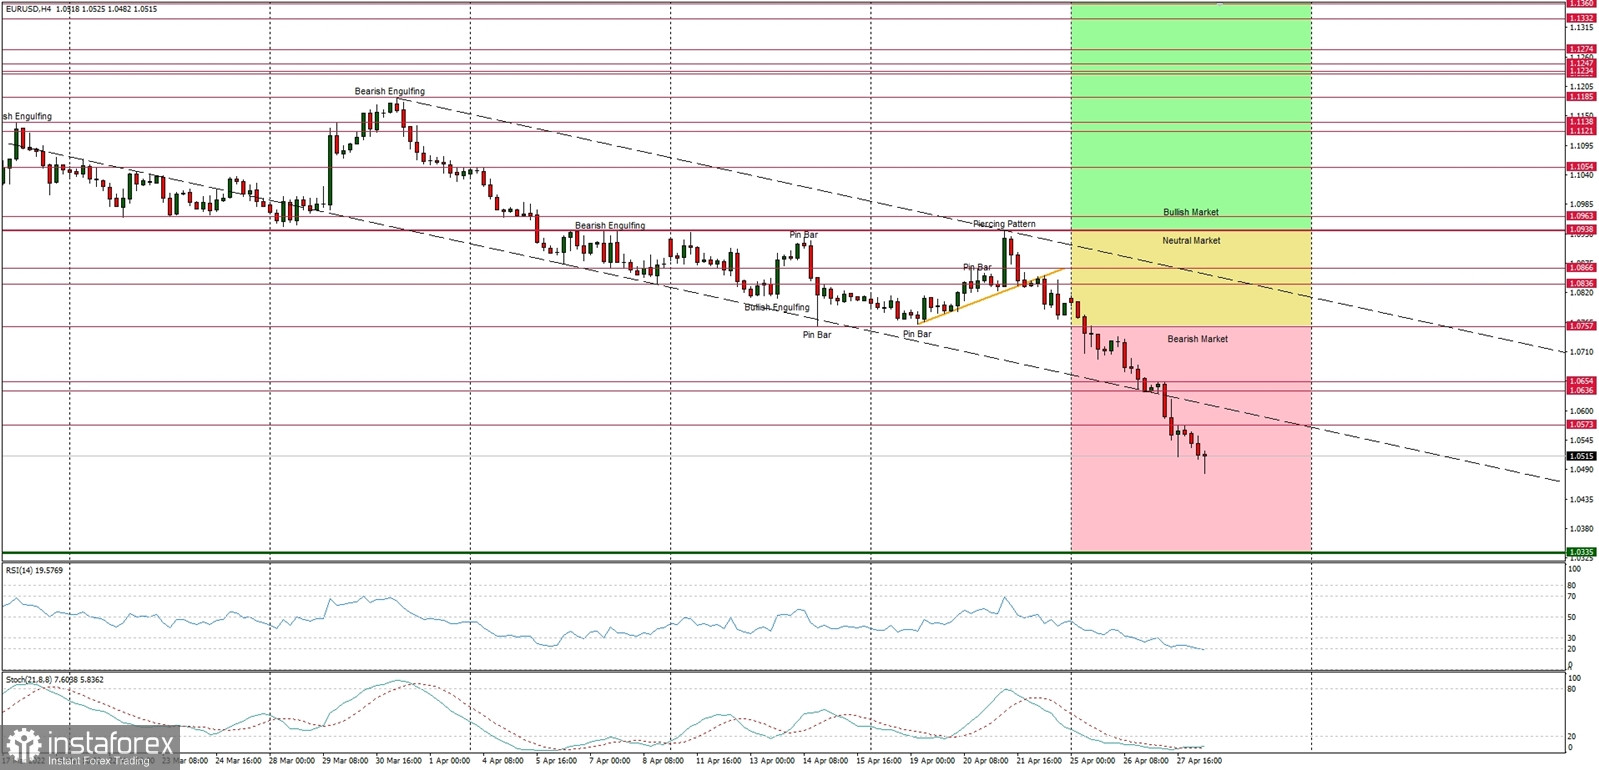
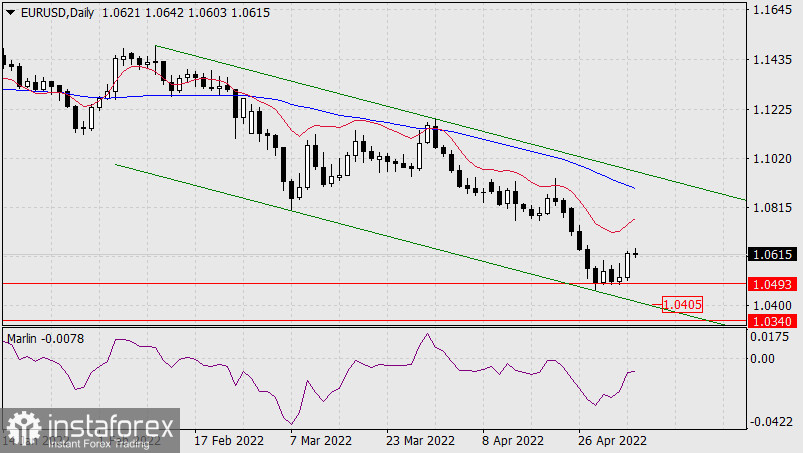
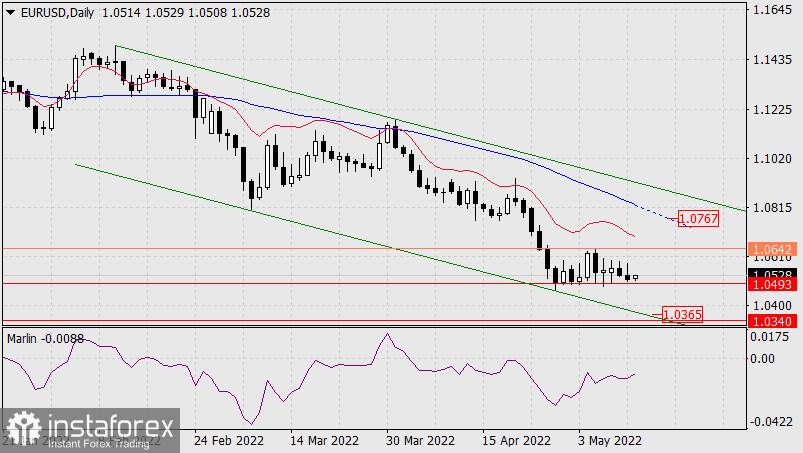
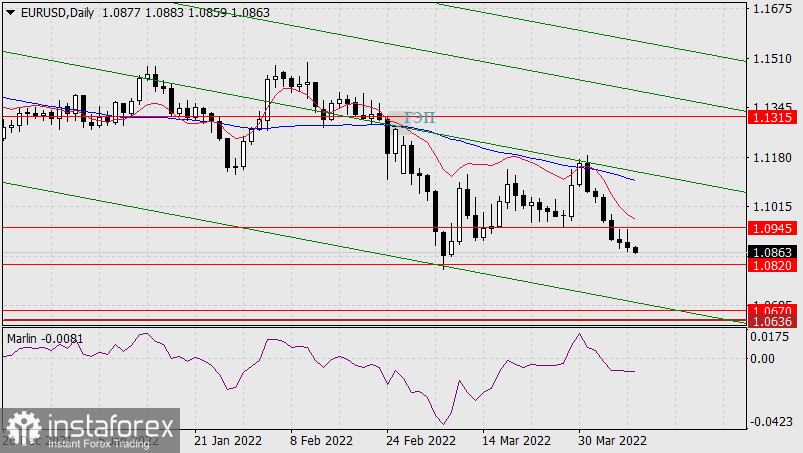
The euro continues to decline, although it has slowed down. It has a technically and ideologically important support at 1.0820 ahead of it, overcoming which opens the target of 1.0636 – the low of March 2020, therefore, in order to overcome such an important support, you need to gather your strength. Today is Friday, no important news is planned, and investors, if they have planned a breakthrough, will organize it not today. The Marlin Oscillator of a daily scale is moving exactly horizontally, which hints at the preliminary closing of short positions of players before an assault with fresh forces.

https://forex-images.ifxdb.com/userfiles/20220408/analytics624fa0da74f5b_source!.jpg

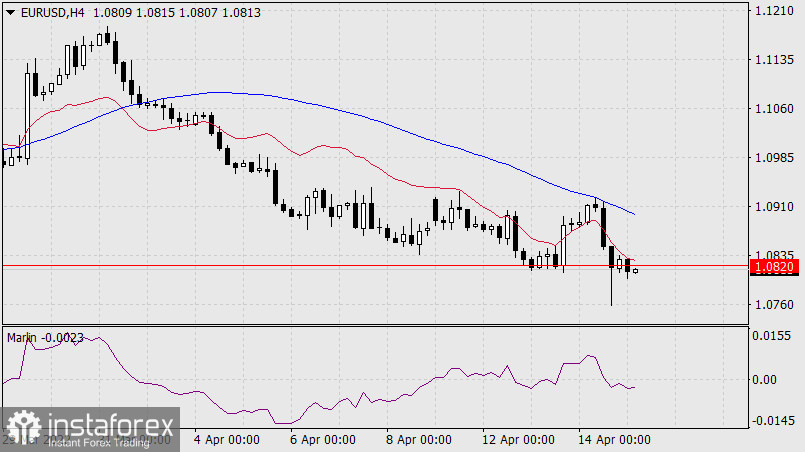
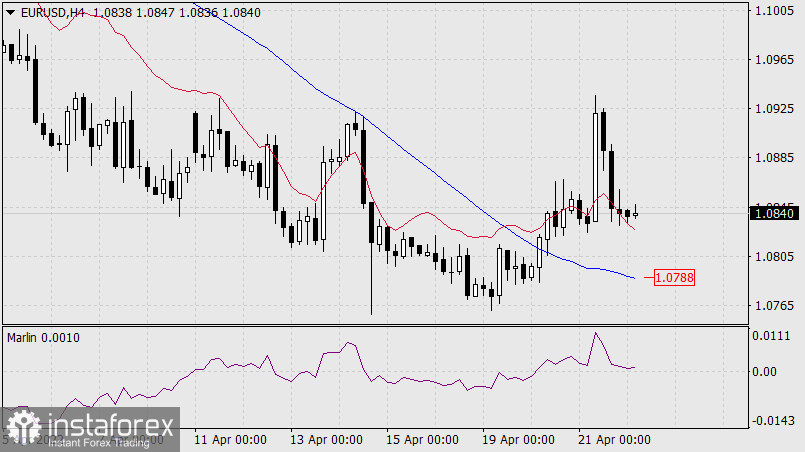
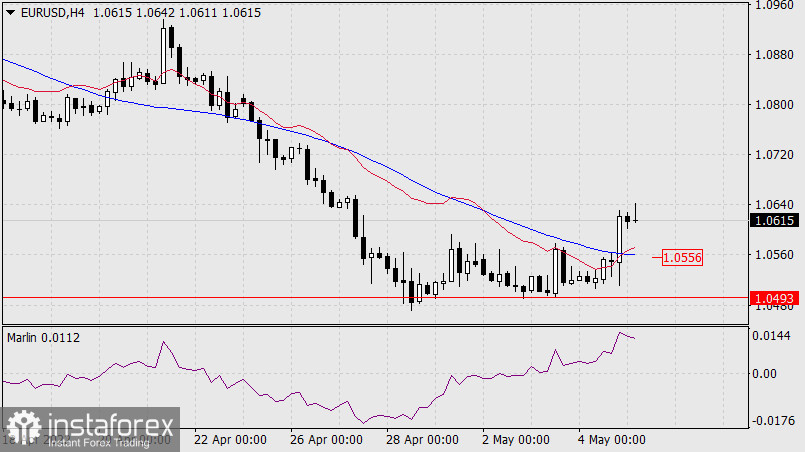
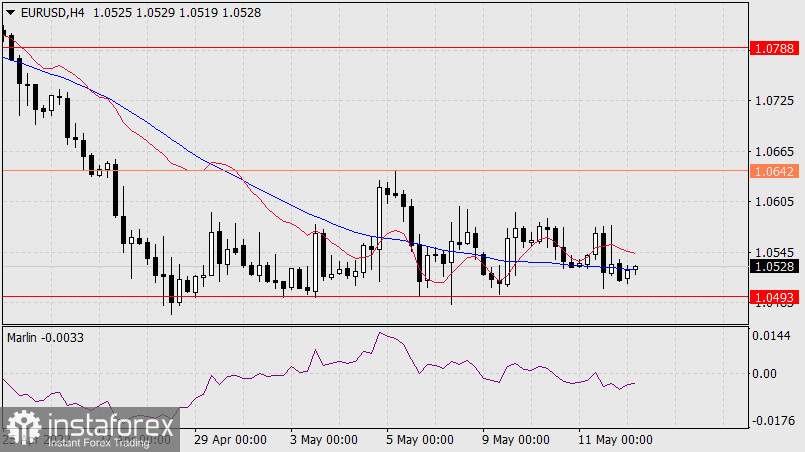
On the four-hour chart, the Marlin Oscillator is growing in the downtrend zone, this can be interpreted in two ways: the oscillator rarefaction before further decline into the oversold area and a slight convergence with the price, indicating the expected closing of positions.

https://forex-images.ifxdb.com/userfiles/20220408/analytics624fa0e5ba612_source!.jpg

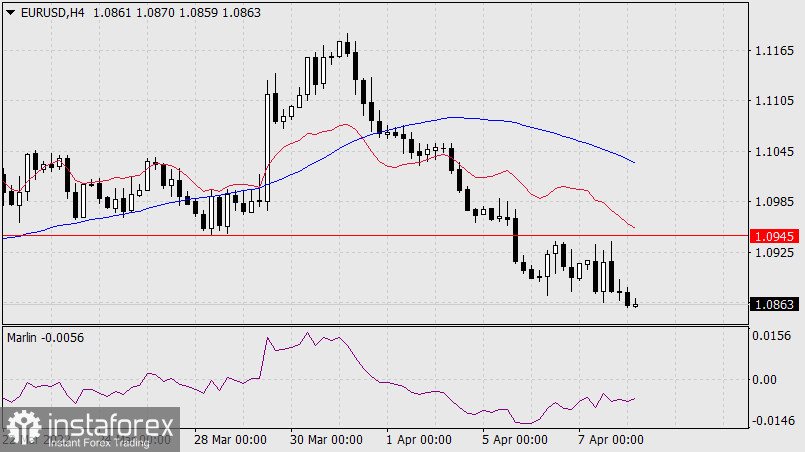
Thus, two scenarios of one action appear: price correction from current levels (correction limit at 1.0945) and a subsequent powerful attack on the target level of 1.0820, and support at 1.0820 working off with a subsequent bounce from the level and only then going under it with a further decline.

Analysis are provided byInstaForex.

Best regards, PR Manager / Learn more about InstaForex Company at http://instaforex.com

Re: InstaForex Analysis

Forex Analysis & Reviews: Forecast for AUD/USD on April 11, 2022

On Friday, the Australian dollar marked the lower shadow of the daily candle in the target range of 0.7415/30, then went back out of it. The signal line of the Marlin Oscillator has gone into the negative area, so we do not expect a strong correction from the range reached. Until the US dollar index strengthens again, the aussie is likely to move sideways. The price going under the lower border of the range opens a new target 0.7315 (high on January 13).

https://forex-images.ifxdb.com/userfiles/20220411/analytics625391fbe6cce_source!.jpg

On the four-hour chart, the price is in no hurry to go into a correction. The Marlin Oscillator is also in no hurry to move either down or turn up. This circumstance confirms the aussie's reluctance to develop corrective growth.

https://forex-images.ifxdb.com/userfiles/20220411/analytics62539206d9b5a_source!.jpg

Analysis are provided byInstaForex.

Best regards, PR Manager / Learn more about InstaForex Company at http://instaforex.com

Re: InstaForex Analysis

Forex Analysis & Reviews: Elliott wave analysis of Silver for April 12, 2022

https://forex-images.ifxdb.com/userfiles/20220412/analytics62551e1184357_source!.jpg

Silver turned higher as the cycle bottomed. We are looking for a break above minor resistance at 25.85 for a continuation higher towards 30.00 and ultimately a rally towards the all-time high at 50.00.

Support is now seen at 24.59 that ideally will be able to protect the downside for the expected break above minor resistance at 25.85. Only a break below support at 24.13 will shift the tide towards the downside and a decline towards 23.38, but the odds for this outcome are very low.

Analysis are provided byInstaForex.

Best regards, PR Manager / Learn more about InstaForex Company at http://instaforex.com

Re: InstaForex Analysis

Forex Analysis & Reviews: Trading plan for EURUSD for April 13, 2022

https://forex-images.ifxdb.com/userfiles/20220413/analytics62565586d56c8_source!.jpg

Technical outlook:
EURUSD prints yet another higher low around 1.0811 mark during the early Asian session on Wednesday. The single currency pair remained shy by just five pips from testing the previous swing low at 1.0806. It is seen to be trading around 1.0833 level at this point in writing and a push through 1.0910 could confirm a bottom in place.

EURUSD has shown quite resilience as bulls defended 1.0806 swing low. If a potential bottom is in place at 1.0811, price would continue higher and break above 1.0910-20 initial resistance. On the flip side, it 1.0806 breaks down, bears might print a shallow low before bulls are back in control. Both scenarios present a bullish picture over medium term.

EURUSD is already producing a bullish divergence on the daily RSI as prices remained just five pips away from printing fresh lows below 1.0806 mark. The divergence is not shown here but it is a potential trend reversal indicator going forward. It would be interesting to see a break above 1.0910-20 mark as the day progresses.

Trading plan:
Potential rally towards 1.1500 against 1.0700
Good luck!

Analysis are provided byInstaForex.

Best regards, PR Manager / Learn more about InstaForex Company at http://instaforex.com

Re: InstaForex Analysis

Forex Analysis & Reviews: Forecast for EUR/USD on April 14, 2022

Yesterday we overestimated the possibilities of the dollar, the breakdown of support at 1.0820 did not happen. It may seem that investors took no action ahead of today's European Central Bank meeting and decided to keep the euro in the range of 1.0820-1.0945, but in fact there was a reaction to the general weakening of the dollar, which received a boost from sharply falling US government bond yields on Tuesday and Wednesday. Yields on 2-year securities have been declining since Monday, during this time it fell from 2.54% to 2.27%, and yesterday the dollar slightly correlated. By this action, the market makes it clear that the euro exchange rate in the current situation is more dependent on the policy of the Federal Reserve than on the policy of the ECB. And if the market's expectations regarding the June ECB rate hike justifies, the euro definitely has no reason to rise. In the best case, the price will linger a little more in the range of 1.0820-1.0945. This is our main scenario.

https://forex-images.ifxdb.com/userfiles/20220414/analytics62578c88c3ec6_source!.jpg

If there are problems with the main scenario, the price settles above 1.0945, then the euro is likely to rise to 1.1085 - to the Fibonacci channel line (daily), in the area of the MACD indicator line (blue). At the same time, price convergence with the Marlin Oscillator will finally form. We see no reason for such activity of speculators 2.5 weeks before the Fed rate hike by 0.50 points.

https://forex-images.ifxdb.com/userfiles/20220414/analytics62578c92488f0_source!.jpg

Convergence is also forming on the four-hour chart; it can be taken as already formed, since the signal line of the Marlin Oscillator is in the positive area. The convergence potential is enough to bring the price to the resistance area of the price level 1.0945 and the MACD line.

Analysis are provided byInstaForex.

Best regards, PR Manager / Learn more about InstaForex Company at http://instaforex.com

Re: InstaForex Analysis

Forex Analysis & Reviews: Forecast for EUR/USD on April 15, 2022

Yesterday's European Central Bank meeting turned out to be softer than expected. Despite rising inflation, the central bank gave a hint of a rate hike only in the fourth quarter, as the overall economic situation in Europe is not in the best way. Likewise, the anti-COVID agenda remains alarming. The euro closed the day down 54 points. This morning the price is trying again to go under the support level of 1.0820, obviously consolidating below it. The Marlin Oscillator slightly turned down. If the price settles below 1.0820, we are waiting for the price in the target range of 1.0636/70.

https://forex-images.ifxdb.com/userfiles/20220415/analytics6258d8ea7b6fd_source!.jpg

On the four-hour chart, the price reversed down exactly from the resistance of the MACD indicator line. This suggests that the short-term exit of the price above the red balance line was false, one might say, erroneous for a group of bullish players, since the price was developing all the time in a medium-term downward trend - below the MACD line. At the moment, the price has already settled below the balance line and may soon settle below the level of 1.0820. The Marlin Oscillator returned to the territory of the downward trend.

https://forex-images.ifxdb.com/userfiles/20220415/analytics6258d90360ce1_source!.jpg

Today the markets of Europe and the US are closed for the Catholic Easter, on Monday Europe continues to rest, while the US has already gone back to work. We are waiting for the main events on Monday-Tuesday.

Analysis are provided byInstaForex.

Best regards, PR Manager / Learn more about InstaForex Company at http://instaforex.com

Re: InstaForex Analysis

Forex Analysis & Reviews: ETHUSD, Bullish Bounce | 18th April 2022

https://forex-images.ifxdb.com/userfiles/20220418/analytics625cf39b546e0_source!.jpg

On the H4, we see the price is near pivot level. Price can potentially bounce from 1st support level of 2955.24 in line with the 61.8% Fibonacci projection and 61.8% Fibonacci retracement towards the 1st resistance level of 3083.99 in line with 78.6% Fibonacci projection. Alternatively, price may break through key support structure and head for our 2nd support level of 2835.69 in line with 78.6% Fibonacci projection.

Trading Recommendation
Entry: 2955.24
Reason for Entry:
61.8% Fibonacci projection and 61.8% Fibonacci retracement.
Take Profit: 3083.99
Reason for Take Profit:78.6% Fibonacci projection.
Stop Loss: 2835.69
Reason for Stop Loss:
78.6% Fibonacci projection.

Analysis are provided byInstaForex.

Best regards, PR Manager / Learn more about InstaForex Company at http://instaforex.com

Re: InstaForex Analysis

Forex Analysis & Reviews: Elliott wave analysis of GBP/JPY for April 19, 2022

https://forex-images.ifxdb.com/userfiles/20220419/analytics625e4bb668b5d_source!.jpg

As GBP/JPY has continue to make new highs for the rally since the 123.99 low we have reviewed our count. It's clearly possible to count a complete five wave rally from 123.99 to the present high at 166.60. What It also clear is that wave 4 is a triangle, which is normally a warning that the next impulsive rally will be the last of the total five wave sequence since the 123.99 low. That of course also means that the very best of the impulsive rally now is behind us and it's just a matter of time before GBP/JPY peaks and a larger corrective decline to 156.90 is seen.

We expect GBP/JPY to see its final peak at 168.26 where wave 5 will be 61.8% the length of wave 1 through wave 3.

Analysis are provided byInstaForex.

Best regards, PR Manager / Learn more about InstaForex Company at http://instaforex.com

Re: InstaForex Analysis

Forex Analysis & Reviews: Trading plan for Ethereum for April 20, 2022

https://forex-images.ifxdb.com/userfiles/20220420/analytics625f95931a0e4_source!.jpg

Technical outlook:
Ethereum managed to rally through $3,130 highs on Wednesday before finding resistance. The crypto has plled back since then and is seen to be trading close to $3,095 levels at this point in writing. Intraday corrective drop remains possible through $2,980 mark, before the rally resumes higher toward $3,800-4,000 zone.

Ethereum has been in a counter trend rally since $2,140 lows,and is looking to progress toward $3,800 at least before turning lower again. Also note that $3,800 is close to fibonacci 0.618 retracement of earlier drop between $4,850 and $2,140 levels respectively. Further, the channel resistance is also passing through $3,800-4,000 zone.

High probability remains for a turn lower if prices manage to reach the above projection, as resistance would be strong. Bears will remain poised to be back in control from $3,800-4,000 mark and drag prices lower below $2,140 levels. Watch out for short term intraday support coming through $2,980 mark today.

Trading plan:
Potential rally through $3,800-4,000 against $2,100.
Good luck!

Analysis are provided byInstaForex.

Best regards, PR Manager / Learn more about InstaForex Company at http://instaforex.com

Re: InstaForex Analysis

Forex Analysis & Reviews: Technical Analysis of EUR/USD for April 21, 2022

https://forex-images.ifxdb.com/userfiles/20220421/analytics6260fa685f4d2_source!.jpg

Technical Market Outlook:
The EUR/USD pair had extended the bounce from the last week low seen at 1.0757, but so far the bounce is still rather shallow as the bearish/neutral market border located at 1.0887 has not been tested yet (the local high was made at the level of 1.0874 so far)If the last week low is clearly violated, then the bears might push the price towards the technical support seen at 1.0654 (the key long term technical support for bulls) despite the extremely oversold market conditions. The down trend continues lower and there is no indication of down trend termination or reversal yet. The nearest technical resistance is located at 1.0887 and 1.0899 (bearish/neutral market border).

Weekly Pivot Points:
WR3 - 1.1073
WR2 - 1.1001
WR1 - 1.0893
Weekly Pivot - 1.823
WS1 - 1.0717
WS2 - 1.0648
WS3 - 1.0538

Trading Outlook:
The market is still in control by bears that pushed the price way below the level of 1.1185, so a breakout above this level is a must for bulls for a trend reversal. The next long-term technical support is located at 1.0639. The up trend can be continued towards the next long-term target located at the level of 1.1494 (high from 06.02.2022) only if bullish cycle scenario is confirmed by breakout above the level of 1.1186 and 1.1245, otherwise the bears will push the price lower towards the next long-term target at the level of 1.0639 or below.

Analysis are provided byInstaForex.

Best regards, PR Manager / Learn more about InstaForex Company at http://instaforex.com

1,061 (edited by ifx.gertrude 2022-04-22 06:26:09)

Re: InstaForex Analysis

Forex Analysis & Reviews: Forecast for EUR/USD on April 22, 2022

The euro's growth from yesterday was more than 80 points, but it could not do anything with the general strengthening of the dollar, with the expectation of an even greater discrepancy in the rates of the Federal Reserve and the European Central Bank, which eventually led the single currency to close the day with a black candle of 12 points. Today's report on the eurozone PMI indices for April are expected to weaken. The forecast for manufacturing PMI is 54.7 against 56.5 in March, expectations for non-manufacturing PMI are 55.0 against 55.6 a month earlier. We are waiting for a further decline to the target range of 1.0636/70. The Marlin Oscillator has not yet reversed from its zero line on the daily chart, which could slow down a potential price decline.

https://forex-images.ifxdb.com/userfiles/20220422/analytics6262183d6951c_source!.jpg

On the chart of the four-hour scale, the price and the readings of the indicators returned to the positions from yesterday morning. The only difference is that the MACD line slightly decreased, and now, for a reliable signal to decrease, the price should go under lower support, under the level of 1.0788. The bears' pressure on the price is not light.

https://forex-images.ifxdb.com/userfiles/20220422/analytics62621847c841b_source!.jpg

Analysis are provided byInstaForex.

Best regards, PR Manager / Learn more about InstaForex Company at http://instaforex.com

Re: InstaForex Analysis

Forex Analysis & Reviews: Elliott wave analysis of GBP/JPY for April 25, 2022

https://forex-images.ifxdb.com/userfiles/20220425/analytics62661fa136944_source!.jpg

GBP/JPY has see a nice drop from the 168.43 peak. We where looking for a peak at 168.26 so it was close to a bulls-eye regarding picking the top. We are now looking for a deeper and more prolonged corrective phase unfolding towards at least 158.25 and possibly closer to 150.10.

We have seen a nice five wave rally from 123.99 to 168.43 to complete the impulsive cycle and we are now looking for a corrective cycle for the coming month.

Analysis are provided byInstaForex.

Best regards, PR Manager / Learn more about InstaForex Company at http://instaforex.com

Re: InstaForex Analysis

Forex Analysis & Reviews: Forecast for EUR/USD on April 26, 2022

The euro fell by 78 points yesterday. The 1.0636 key level (March 2020 low) is about 100 pips away, and now the price is correcting slightly before further preparations to overcome it.

https://forex-images.ifxdb.com/userfiles/20220426/analytics62675bb8453c4_source!.jpg

The growing correction is expected to be small, the MACD indicator line on the four-hour chart (1.0755) serves as a reference point for its end. The price may slightly go above the indicator line. The Marlin Oscillator has turned up, it also tends to correct and discharge before further decline. Falling below yesterday's low at 1.0697 will start a new wave of decline for the euro.

https://forex-images.ifxdb.com/userfiles/20220426/analytics62675bc58570c_source!.jpg

Analysis are provided byInstaForex.

Best regards, PR Manager / Learn more about InstaForex Company at http://instaforex.com

Re: InstaForex Analysis

Forex Analysis & Reviews: Forecast for EUR/USD on April 27, 2022

The euro was ahead of our bold forecasts. We expected an attack on the target level of 1.0636 at the Federal Reserve meeting, but the price reached it last night, and at the point of intersection of the level with the lower border of the Fibonacci channel, marked in green on the daily chart. Consolidating below 1.0636 (March 2020 low) opens the way for the euro to parity. The first target is 1.0493 (February 2017 low).

https://forex-images.ifxdb.com/userfiles/20220427/analytics6268aac255466_source!.jpg

On the four-hour chart, the price lingers at the reached level with a slight upturn of the Marlin Oscillator. Here, however, there may still be at least a slight correction in depth, in the form of consolidation, to give the oscillator a little rise before further decline. But if it does not exist, then after settling under 1.0636, we are waiting for further movement to 1.0493.

https://forex-images.ifxdb.com/userfiles/20220427/analytics6268aacf1f359_source!.jpg

Analysis are provided byInstaForex.

Best regards, PR Manager / Learn more about InstaForex Company at http://instaforex.com

Re: InstaForex Analysis

Forex Analysis & Reviews: Technical Analysis of EUR/USD for April 28, 2022

https://forex-images.ifxdb.com/userfiles/20220428/analytics626a2dcb2c775_source!.jpg

Technical Market Outlook
The EUR/USD pair had broken below the last week low seen at the level of 1.0757 and made a new swing low at the level of of 1.0481, however, in a case of the down move continuation, the next target for bears is seen at the level of 1.0336. This level is the key long-term technical support from 2020, so please keep an eye on the market behaviour around this level. The nearest technical resistance is located at 1.0654. Despite the oversold market conditions on the H4 and Daily time frame charts, the down trend continues and there is no indication of trend termination or reversal just yet. Weak and negative momentum supports the short-term bearish outlook.

Weekly Pivot Points:
WR3 - 1.1064
WR2 - 1.0994
WR1 - 1.0884
Weekly Pivot - 1.0825
WS1 - 1.0717
WS2 - 1.0643
WS3 - 1.0535

Trading Outlook:
The market is still in control by bears that pushed the price way below the level of 1.1185, so a breakout above this level is a must for bulls for a trend reversal. The next long-term technical support is located at 1.0639. The up trend can be continued towards the next long-term target located at the level of 1.1494 (high from 06.02.2022) only if bullish cycle scenario is confirmed by breakout above the level of 1.1186 and 1.1245, otherwise the bears will push the price lower towards the next long-term target at the level of 1.0639 or below.

Analysis are provided byInstaForex.

Best regards, PR Manager / Learn more about InstaForex Company at http://instaforex.com

Re: InstaForex Analysis

Forex Analysis & Reviews: Elliott wave analysis of GBP/JPY for April 29, 2022

https://forex-images.ifxdb.com/userfiles/20220429/analytics626b779da470e_source!.jpg

GBP/JPY is correcting nicely from the 168.43 peak and we should see more downside force being added in the near-term towards our first downside target at 158.15, but this support will likely break after a short while for a continuation towards support at 154.41 and possibly closer to 150.04.

So continue to look for more downside pressure near term.

Analysis are provided byInstaForex.

Best regards, PR Manager / Learn more about InstaForex Company at http://instaforex.com

Re: InstaForex Analysis

Forex Analysis & Reviews: Technical Analysis of EUR/USD for May 2, 2022

https://forex-images.ifxdb.com/userfiles/20220502/analytics626f6ec6da18a_source!.jpg

Technical Market Outlook
The EUR/USD pair had made a new swing low at the level of 1.047 and in the meantime, the bulls are trying to bounce towards the lower channel line located around the level of 1.0573, which is the nearest technical resistance as well. So far they failed to move back into the descending channel, so in a case of the down move continuation, the next target for bears is seen at the level of 1.0336. This level is the key long-term technical support from 2020, so please keep an eye on the market behavior around this level. Despite the oversold market conditions on the H4 and Daily time frame charts, the down trend continues and there is no indication of trend termination or reversal just yet. Weak and negative momentum supports the short-term bearish outlook.

Weekly Pivot Points:
WR3 - 1.1064
WR2 - 1.0933
WR1 - 1.0710
Weekly Pivot - 1.0591
WS1 - 1.0363
WS2 - 1.0252
WS3 - 1.0032

Trading Outlook:
The market is still in control by bears that pushed the price way below the level of 1.1185, so a breakout above this level is a must for bulls for a long-term trend reversal. The up trend can be continued towards the next long-term target located at the level of 1.1494 (high from 06.02.2022) only if bullish cycle scenario is confirmed by breakout above the level of 1.1186 and 1.1245, otherwise the bears will push the price lower towards the next long-term target at the level of 1.0336 or below.

Analysis are provided byInstaForex.

Best regards, PR Manager / Learn more about InstaForex Company at http://instaforex.com

Re: InstaForex Analysis

Forex Analysis & Reviews: Elliott wave analysis of Silver for May 3, 2022

https://forex-images.ifxdb.com/userfiles/20220503/analytics6270b8422bb9d_source!.jpg

Silver is testing support at 22.16 and could be ready for the next impulsive rally towards resistance at 30.00 and a break above here will release the energy for a continuation higher to the all-time high at 50.00. That said, if minor resistance at 23.56 is able to cap the upside, then silver could move closer to strong support near 21.65 before being ready to rally in the next impulsive move higher.

So for now we need to stay flexible and observe the market behavior near 22.16 and more importantly near minor resistance at 23.56 as a break will indicate the correction is complete and the next rally towards 30.00 is in motion.

Analysis are provided byInstaForex.

Best regards, PR Manager / Learn more about InstaForex Company at http://instaforex.com

Re: InstaForex Analysis

Forex Analysis & Reviews: USDJPY, Potential for Bullish Continuation | 4th May 2022

https://forex-images.ifxdb.com/userfiles/20220504/analytics627208c3e4d73_source!.jpg

On the H4, with price moving above the Ichimoku cloud, we have a bullish bias that price will rise to our 1st resistance at 131.240 where the swing high resistance is from our 1st support at 129.374 in line with the horizontal pullback support and 50% and 78.6 Fibonacci retracement. Alternatively, price may break 1st support structure and head for 2nd support at 127.240 where the horizontal swing low support is.

Trading Recommendation
Entry: 129.374
Reason for Entry:
Horizontal pullback support and 50% and 78.6 Fibonacci retracement
Take Profit:131.240
Reason for Take Profit: Horizontal swing high resistance
Stop Loss: 127.240
Reason for Stop Loss:
Horizontal swing low support

Analysis are provided byInstaForex.

Best regards, PR Manager / Learn more about InstaForex Company at http://instaforex.com

Re: InstaForex Analysis

Forex Analysis & Reviews: Forecast for EUR/USD on May 5, 2022

As a result of yesterday's Federal Reserve meeting, investors decided to postpone a large-scale attack on counter-dollar assets. The reason for this decision was a slight slowdown by the Fed in the pace of balance sheet reduction: the markets expected that the central bank would immediately reduce the balance sheet at a rate of $95 billion per month, but it was decided to start with $47.5 billion per month, bringing the forecast rate to $95 billion. billion in three months. The rate, as expected, was increased by 0.50%. An increase of 0.50% was also announced for the next meeting in June.

The euro rose by 103 points, but we do not expect this momentum to develop. On Friday, the data on employment in the US is expected to reduce unemployment from 3.6% to 3.5%. As before, the euro has little cause for optimism, we just have to wait for the technical signs of a recovery in the strengthening of the dollar.

https://forex-images.ifxdb.com/userfiles/20220505/analytics627339a2b2925_source!.jpg

The price is in a downward trend on the daily chart – the Marlin Oscillator is in the negative area. If there are no new surprises, then Marlin will not enter the zone of positive values.

https://forex-images.ifxdb.com/userfiles/20220505/analytics627339ac25f3b_source!.jpg

The situation is growing on the four-hour scale. To change the trend, at least one condition must be fulfilled: the price should fall under the MACD line (1.0556), the transition of the Marlin Oscillator to the negative area. Apparently, this will happen tomorrow.

Analysis are provided byInstaForex.

Best regards, PR Manager / Learn more about InstaForex Company at http://instaforex.com

Re: InstaForex Analysis

Forex Analysis & Reviews: Technical Analysis of EUR/USD for May 6, 2022

https://forex-images.ifxdb.com/userfiles/20220506/analytics6274bc21c38cb_source!.jpg

Technical Market Outlook
The EUR/USD pair bounce had been capped at the level of 1.0636 after the Pin Bar candlestick pattern was made at the H4 time frame chart. The oversold market conditions on the Daily time frame chart, indicate the down trend continues and there is no indication of trend termination or reversal just yet. The nearest technical support is located at 1.0469. The bearish market border is located at 1.0755, so there is still a room for bears to try to resume the down trend.

Weekly Pivot Points:
WR3 - 1.1064
WR2 - 1.0933
WR1 - 1.0710
Weekly Pivot - 1.0591
WS1 - 1.0363
WS2 - 1.0252
WS3 - 1.0032

Trading Outlook:
The market is still in control by bears that pushed the price way below the level of 1.1185, so a breakout above this level is a must for bulls for a long-term trend reversal. The up trend can be continued towards the next long-term target located at the level of 1.1494 (high from 06.02.2022) only if bullish cycle scenario is confirmed by breakout above the level of 1.1186 and 1.1245, otherwise the bears will push the price lower towards the next long-term target at the level of 1.0336 or below.

Analysis are provided byInstaForex.

Best regards, PR Manager / Learn more about InstaForex Company at http://instaforex.com

Re: InstaForex Analysis

Forex Analysis & Reviews: Elliott wave analysis of GBP/JPY for May 9, 2022

https://forex-images.ifxdb.com/userfiles/20220509/analytics6278a6d114684_source!.jpg

We see a should/Head/Should top building and the neckline support currently sitting near 159.63 a clear break below the neckline support will call for a continuation lower towards support at 157.96 and 154.14 as the next downside targets.

The neckline support should not be to difficult to break confirming the top and the continuation of wave C lower towards support near 134.14 and possibly even lower towards the 50% target at 150.09.

Analysis are provided byInstaForex.

Best regards, PR Manager / Learn more about InstaForex Company at http://instaforex.com

Re: InstaForex Analysis

Forex Analysis & Reviews: GBPUSD Potential for Bearish Continuation | 10th May 2022

https://forex-images.ifxdb.com/userfiles/20220510/analytics6279ef93f021c_source!.jpg

On the H4, with price moving below the Ichimoku cloud, we have a bearish bias that price will drop from our 1st resistance at 1.24080 where the 38.2% Fibonacci retracement and pullback resistance is to our 1st support at 1.22677 in line with the 161.8% Fibonacci extension and horizontal swing low support is. Alternatively, price may break 1st resistance structure and head for 2nd resistance at 1.24802 in line with the 61.8% Fibonacci retracement.

Trading Recommendation
Entry: 1.24080
Reason for Entry:
38.2% Fibonacci retracement and pullback resistance
Take Profit:1.22677
Reason for Take Profit:161.8% Fibonacci extension and horizontal swing low support
Stop Loss: 1.24802
Reason for Stop Loss:
61.8% Fibonacci retracement and horizontal pullback support

Analysis are provided byInstaForex.

Best regards, PR Manager / Learn more about InstaForex Company at http://instaforex.com

Re: InstaForex Analysis

Forex Analysis & Reviews: GBPUSD Potential for Bearish Continuation | 11th May 2022

https://forex-images.ifxdb.com/userfiles/20220511/analytics627b41abce244_source!.jpg

On the H4, with price moving below the Ichimoku cloud, we have a bearish bias that price will drop from our 1st resistance at 1.24080 where the 38.2% Fibonacci retracement and pullback resistance is to our 1st support at 1.22677 in line with the 161.8% Fibonacci extension and horizontal swing low support is. Alternatively, price may break 1st resistance structure and head for 2nd resistance at 1.24802 in line with the 61.8% Fibonacci retracement.

Trading Recommendation
Entry: 1.24080
Reason for Entry:
38.2% Fibonacci retracement and pullback resistance
Take Profit:1.22677
Reason for Take Profit:161.8% Fibonacci extension and horizontal swing low support
Stop Loss: 1.24802
Reason for Stop Loss:
61.8% Fibonacci retracement and horizontal pullback support

Analysis are provided byInstaForex.

Best regards, PR Manager / Learn more about InstaForex Company at http://instaforex.com

Re: InstaForex Analysis

Forex Analysis & Reviews: Forecast for EUR/USD on May 12, 2022

Yesterday, the euro decided neither to actively rise nor to decline. The price continues to consolidate above the support level of 1.0493. The price drop below this level opens the target range of 1.0340/65. The reference point for its lower boundary is the January 2017 low. Yesterday's fall in stock markets (S&P 500 -1.65%), caused by persistently high inflation (monthly CPI growth for April is shown at 0.3%, and the decrease in annual pressure from 8.5% to 8.3%) completely deprives investors of interest to risk. As a result, the probability of the euro falling to the lower border of the price channel with an attempt to overcome it increases.

https://forex-images.ifxdb.com/userfiles/20220512/analytics627c73299587b_source!.jpg

The price is on the MACD line on the four-hour chart, which so far shows its neutral state, but at the same time, it is below the balance line and the Marlin Oscillator is in the negative area.

https://forex-images.ifxdb.com/userfiles/20220512/analytics627c7335bc284_source!.jpg

Analysis are provided byInstaForex.

Best regards, PR Manager / Learn more about InstaForex Company at http://instaforex.com

Posts: 1,051 to 1,075 of 1,547

Pages Previous 1 41 42 43 44 45 62 Next

You must login or register to post a reply

Forex Software → Market Analysis → InstaForex Analysis

Similar topics in this forum