forex software

Create and Test Forex Strategies

forex software

Skip to forum content

Forex Software

Create and Test Forex Strategies

You are not logged in. Please login or register.


(Page 39 of 62)

Forex Software → Market Analysis → InstaForex Analysis

Pages Previous 1 37 38 39 40 41 62 Next

You must login or register to post a reply

RSS topic feed

Posts: 951 to 975 of 1,547

Re: InstaForex Analysis

Forex Analysis & Reviews: GBPJPY potential for bounce! | 18th Nov 2021

https://forex-images.ifxdb.com/userfiles/20211118/analytics6195bf6e8757f_source!.jpg

Price is in a cup pattern and has recently broken out of our ascending trendline. We see potential for a bounce from our 1st support at 153.625 in line with 50% Fibonacci retracement, 23.6% Fibonacci retracement and graphical overlap towards our 1st resistance at 154.356 in line with 50% Fibonacci retracement and graphical overlap. Alternatively, our stop loss will be placed at 2nd support at 153.332 in line with 61.8% Fibonacci retracement and graphical overlap. Technical indicators are showing bullish momentum.

Trading Recommendation
Entry: 153.625
Reason for Entry:
50% Fibonacci retracement, 23.6% Fibonacci retracement and graphical overlap
Take Profit: 154.356
Reason for Take Profit:
50% Fibonacci retracement and graphical overlap
Stop Loss: 153.332
Reason for Stop Loss:
61.8% Fibonacci retracement and graphical overlap

Analysis are provided byInstaForex.

Best regards, PR Manager / Learn more about InstaForex Company at http://instaforex.com

Re: InstaForex Analysis

Forex Analysis & Reviews: AUDUSD potential short term bullish bounce | 19th Nov 2021

https://forex-images.ifxdb.com/userfiles/20211119/analytics61971e8403d37_source!.jpg

On the H4, we can see that price abiding to the ascending channel on the daily and descending trendline on the H4. We can expect price to make a bounce from 1st Support in line with 78.6% Fibonacci projection, 78.6% Fibonacci retracement and ascending channel support towards the 1st Resistance in line with 61.8% Fibonacci projection and 50% Fibonacci retracement. Our bullish bias is further supported by stochastic indicator where the %K line is at the support level awaiting for a bounce.

Trading Recommendation
Entry: 0.72530
Reason for Entry: 78.6% Fibonacci projection, 78.6% Fibonacci retracement and ascending channel support
Take Profit: 0.73316
Reason for Take Profit: 78.6% Fibonacci projection and 23.6% Fibonacci retracement
Stop Loss: 0.72256
Reason for Stop Loss:
100% Fibonacci projection

Analysis are provided byInstaForex.

Best regards, PR Manager / Learn more about InstaForex Company at http://instaforex.com

Re: InstaForex Analysis

Forex Analysis & Reviews: USDCAD Bearish Reversal | 22nd Nov 2021

https://forex-images.ifxdb.com/userfiles/20211122/analytics619b17830ee56_source!.jpg

On the H4, with price reversing off the resistance on the RSI indicator and the a graphical level, we have a bearish bias that price will dip to 1st support at 1.25853 in line with the graphical overlap support and possibly to 2nd support at 1.27074 in line with the graphical overlap support from 1st resistance at 1.26472 in line with the horizontal overlap resistance and 23.6% Fibonacci retracement level. Alternatively, we may see price break 1st resistance structure and head for 2nd resistance at 1.25466 in line with the 50% Fibonacci projection retracement level and horizontal swing high resistance.

Trading Recommendation
Entry: 1.26472
Reason for Entry:
Horizontal overlap resistance and 23.6% Fibonacci retracement level
Take Profit: 1.25853
Reason for Take Profit:
Graphical overlap support
Stop Loss: 1.25466
Reason for Stop Loss:
50% Fibonacci projection retracement level and horizontal swing high resistance

Analysis are provided byInstaForex.

Best regards, PR Manager / Learn more about InstaForex Company at http://instaforex.com

Re: InstaForex Analysis

Forex Analysis & Reviews: Gold reaches 2nd target after bearish signal.

Gold price has reached the $1,800 area which was our second target after our bearish signal last Friday. As expected by our analysis, Gold started the week under pressure because of the bearish signal we got last Friday.

https://forex-images.ifxdb.com/userfiles/20211123/analytics619c918de02ee_source!.jpg

Red rectangle- resistance
Blue rectangle - support

Gold price is now trading at the 61.8% Fibonacci retracement of the entire rise from $1,758. Our first target was the 38% retracement around $1,830 and our next target was the 61.8% level. Short-term trend remains bearish after the bearish signal on Friday. At 61.8% retracement level we usually see trend reversals. That is why the decline has stopped around this Fibonacci level. Bears need to be cautious as we could see a higher low being formed and price to reverse to the upside. For now no such signal has been given. Price could during the day make a new lower low so bulls need to be very patient and cautious. Next support is at the 78.6% retracement level. Breaking below that level will increase dramatically the chances of falling below $1,758 over the coming days. For now this is not the most probable scenario.

Analysis are provided byInstaForex.

Best regards, PR Manager / Learn more about InstaForex Company at http://instaforex.com

Re: InstaForex Analysis

Forex Analysis & Reviews: Trading plan for GBP/USD on November 24, 2021

The GBP/USD pair has been forming a flat range for the last ten days. Yesterday's update of the monthly low led again to the emergence of demand.

If today's closing of the day turns out to be higher than yesterday's opening of the day, then the "absorption" pattern on the daily chart will form. This will open the way to buy the instrument. The upward target will be the Weekly Control Zone 1/2 1.3531-1.3514, which coincides with a significant weekly extreme.

At the moment, the priority is still to trade within the framework of the flat. It should be noted that finding the price at the lower end of the range indicates the opportunity to buy profitably when the corresponding pattern appears.

https://forex-images.ifxdb.com/userfiles/20211124/analytics619de0c65d152_source!.jpg

Today's daily candle should be similar to the candle of November 12. If this happens, then purchases will come to the fore tomorrow. To continue the pair's decline, it will be necessary to close today below yesterday's low. This will indicate the appearance of new orders to buy the pound at more favorable prices.

Analysis are provided byInstaForex.

Best regards, PR Manager / Learn more about InstaForex Company at http://instaforex.com

Re: InstaForex Analysis

Forex Analysis & Reviews: AUDUSD bearish continuation | 25th Nov 2021

https://forex-images.ifxdb.com/userfiles/20211125/analytics619f29d9f3966_source!.jpg

Today's daily candle should be similar to the candle of November 12. If this happens, then purchases will come to the fore tomorrow. To continue the pair's decline, it will be necessary to close today below yesterday's low. This will indicate the appearance of new orders to buy the pound at more favorable prices.

On the H4, we can see that price broke out of the ascending channel on the daily and abiding to the descending trendline on the H4. We can expect the price to drop from 1st Resistance in line with 23.6% Fibonacci retracement towards the 1st Support in line with 127.2% Fibonacci projection. Our bearish bias is further supported by the Ichimoku cloud indicator where price is holding below it and it is forming a strong resistance level.

Trading Recommendation
Entry: 0.72317
Reason for Entry:
23.6% Fibonacci retracement
Take Profit: 0.71716
Reason for Take Profit:
127.2% Fibonacci Projection
Stop Loss: 0.72524
Reason for Stop Loss:
61.8% Fibonacci projection and 38.2% Fibonacci retracement

Analysis are provided byInstaForex.

Best regards, PR Manager / Learn more about InstaForex Company at http://instaforex.com

Re: InstaForex Analysis

Forex Analysis & Reviews: Forecast for USD/JPY on November 26, 2021

Yesterday, the dollar against the yen could not withstand the pressure from technical factors and this morning fell to the signal level of 114.71 (October 20 high). After the price drops below this level, the USD/JPY pair may continue to move to the magnetic point at 113.20 - to the point of intersection of the price channel line with the MACD line. The price can overcome the target, since below it is the second target level of 112.74, which is desirable for the bulls to work out if they intend to advance further - to create a false downward movement.

https://forex-images.ifxdb.com/userfiles/20211126/analytics61a044cfd72be_source!.jpg

To complete the bearish picture, the signal line of the Marlin oscillator does not reach the negative area. Perhaps this will happen when the price goes below the signal level.

https://forex-images.ifxdb.com/userfiles/20211126/analytics61a044dd03957_source!.jpg

The price almost touched the MACD line on the four-hour chart. Settling below it, as well as below the level of 114.71, will become a condition for further price movement to the downside. The Marlin Oscillator is already in the negative zone.

Analysis are provided byInstaForex.

Best regards, PR Manager / Learn more about InstaForex Company at http://instaforex.com

Re: InstaForex Analysis

Forex Analysis & Reviews: Elliott wave analysis of EUR/JPY for November 29, 2021

https://forex-images.ifxdb.com/userfiles/20211129/analytics61a46f046a291_source!.jpg

EUR/JPY broke below support at 128.44 which told us that every thing we have seen since the June high at 134.12 is part of a major flat correction. This correction should find its low in the 124.25 - 124.50 area for the final impulsive rally towards at least 135.04 and ideally closer to resistance at 139.70.

Short-term a break above minor resistance at 129.60 will indicate that the wave 4/ correction has completed and wave 5/ higher towards at least 135.04 is in motion

Analysis are provided byInstaForex.

Best regards, PR Manager / Learn more about InstaForex Company at http://instaforex.com

Re: InstaForex Analysis

Forex Analysis & Reviews: USD/CAD Ignores DXY

USD/CAD edged higher after ending its minor retreat. You already know from my previous analysis that the currency pair could still grow as the bias remains bullish. Now, it challenges the 1.2799 static resistance, the former high. A valid breakout could activate the upside continuation.

Later, the fundamentals may drive the pair, so you should be careful. The Canadian GDP is expected to register a 0.0% rise versus 0.4% in the previous reporting period. On the other hand, the US CB Consumer Confidence could drop from 113.8 to 110.8 points, while the Chicago PMI is expected at 67.1 points below 68.4 in the previous reporting period.

USD/CAD STRONGLY BULLISH!

https://forex-images.ifxdb.com/userfiles/20211130/analytics61a5c6f67ba3c_source!.jpg

As you can see on the h4 chart, USD/CAD found strong support on the weekly pivot point (1.2737) and now is trading back above the ascending pitchfork's median line (ML). It pressures the 1.2799 level. If the price closes and stabilizes above it could signal potential further growth. Still, in the short term, we cannot exclude a temporary drop. It could come back to test and retest the median line (ML) before resuming its growth.

OUTLOOK FOR USD/CAD!

Jumping, closing, and stabilizing above 1.2799 could activate the upside continuation and could bring fresh long opportunities.

Analysis are provided byInstaForex.

Best regards, PR Manager / Learn more about InstaForex Company at http://instaforex.com

Re: InstaForex Analysis

Forex Analysis & Reviews: Forecast for EUR/USD on December 1, 2021

Yesterday, the euro traded in a range of 150 points and, despite the growth at the end of the day, the single currency entered into an ambiguous position. On the one hand, the price is preparing to overcome the signal-target level of 1.1375, but even if this happens, a stronger resistance at 1.1448 will open, which is approached by the MACD line.

USD/CAD STRONGLY BULLISH!

https://forex-images.ifxdb.com/userfiles/20211201/analytics61a6e0e664da6_source!.jpg

On the other hand, the wide-range itself is a reversal pattern, the Marlin Oscillator does not leave the negative zone, and the euro is declining this morning. The development of the downward movement may lead the price to reach the target level of 1.1170, breaking it will open the second bearish target at 1.1050.

https://forex-images.ifxdb.com/userfiles/20211201/analytics61a6e0f1d6d23_source!.jpg

On the four-hour scale, it is noticeable that the MACD indicator line acted as support for yesterday's range. This is a sign of further price growth. The Marlin Oscillator is declining, but in a growing trend zone. The likelihood of the euro going up and down is almost the same. Settling above 1.1448 will become a condition for the mid-term growth of the euro.

Analysis are provided byInstaForex.

Best regards, PR Manager / Learn more about InstaForex Company at http://instaforex.com

Re: InstaForex Analysis

Forex Analysis & Reviews: Forecast for AUD/USD on December 2, 2021

On Wednesday, the Australian dollar, like on Tuesday, worked out a range of target levels, only a smaller range: 0.7107/71. This morning, the price shows an intention to rise again, and the Marlin Oscillator, which is unfolding from the oversold zone, helps it. If on Friday, when the US employment data will be released, the price overcomes the 0.7171 level that is not yet amenable to it, then the target level 0.7227 will soon be taken, and then there may be a bullish mood at 0.7316, that is, to the daily MACD line scale. This level also coincides with the high of September 2018.

https://forex-images.ifxdb.com/userfiles/20211202/analytics61a835f03c99d_source!.jpg

On the 4-hour chart, the rising price sentiment is being held by the Marlin Oscillator. Until its signal line goes under the line forming the convergence, one can hope for growth to 0.7171 and even for consolidation above the level. But if the price overcomes yesterday's low (0.7096), which will mean a fall in the oscillator, then the speculators' target will be the level of 0.7065 that was previously reached. Finally, if US employment data turns out to be good, the price may continue to decline to 0.7007 (September 2020 low).

https://forex-images.ifxdb.com/userfiles/20211202/analytics61a836036d06e_source!.jpg

Analysis are provided byInstaForex.

Best regards, PR Manager / Learn more about InstaForex Company at http://instaforex.com

Re: InstaForex Analysis

Forex Analysis & Reviews: Forecast for EUR/USD on December 3, 2021

The euro did not repeat its attempt to overcome the signal level of 1.1375, and by this morning it has been slowly declining for the third day. On a daily scale, the Marlin Oscillator is retreating from the local high. Obviously, investors are waiting for today's data on employment in the US, which can (like inflation) further strengthen the dollar. The forecast of labor data is as follows: November unemployment may decrease from 4.6% to 4.5%, 550,000 new jobs can be created in the non-agricultural sector (against 531K in October), an increase in the average hourly wage per month is 0.4% (5.0% y/y). The forecast for the growth of industrial orders for October is 0.5%, and in Canada, the decline in unemployment is expected to be 6.6% from 6.7% earlier. The general stream of positive statistical forecasts suggests that the data on labor in the US will come out good. As a consequence, the euro is likely to fall to the target level of 1.1170. Overcoming the first target opens the second - 1.1050.

https://forex-images.ifxdb.com/userfiles/20211203/analytics61a982e80a898_source!.jpg

On the H4 chart, the Marlin Oscillator has moved into the negative zone. The final confirmation of the downward direction is when the price overcomes the support of the MACD line at 1.1244.

https://forex-images.ifxdb.com/userfiles/20211203/analytics61a982f1a3b42_source!.jpg

Analysis are provided byInstaForex.

Best regards, PR Manager / Learn more about InstaForex Company at http://instaforex.com

Re: InstaForex Analysis

Forex Analysis & Reviews: Elliott wave analysis of GBP/JPY for December 6, 2021

https://forex-images.ifxdb.com/userfiles/20211206/analytics61ada39599a64_source!.jpg

GBP/JPY would ideally move a bit lower to test the ideal corrective target at 148.83 to complete wave iv/ and set the stage for a new impulsive rally towards at least 160.40 and ideally closer to 163.39 to complete wave v/ and iii.

That said, we can see that GBP/JPY is testing a support-line which could prevent GBP/JPY from the final dip to test the ideal corrective target at 148.83. If this is the case, then a break above minor resistance at 152.59 will be seen soon.

Analysis are provided byInstaForex.

Best regards, PR Manager / Learn more about InstaForex Company at http://instaforex.com

Re: InstaForex Analysis

Forex Analysis & Reviews: AUDUSD bearish continuation | 7th Dec 2021

https://forex-images.ifxdb.com/userfiles/20211207/analytics61aef222abf4e_source!.jpg

On the H4, price is abiding to the descending trendline resistance, signifying bearish momentum. Price dropped below the daily overlap support, we can expect price to drop from 1st Resistance in line with 38.2% FIbonacci retracement and 61.8% Fibonacci projection towards 1st Support in line with 161.8% Fibonacci extension. Our bearish bias is further supported by the Ichimoku cloud indicator acting as a resistance.

Trading Recommendation
Entry:0.70615
Reason for Entry:
38.2% FIbonacci retracement and 61.8% Fibonacci projection
Take Profit: 0.69940
Reason for Take Profit:
161.8% Fibonacci extension
Stop Loss: 0.71033
Reason for Stop Loss:
61.8% Fibonacci retracement and 100% Fibonacci projection

Analysis are provided byInstaForex.

Best regards, PR Manager / Learn more about InstaForex Company at http://instaforex.com

Re: InstaForex Analysis

Forex Analysis & Reviews: Elliott wave analysis of GBP/JPY for December 8, 2021

https://forex-images.ifxdb.com/userfiles/20211208/analytics61b0436a1741f_source!.jpg

GBP/JPY should be close to a completion of the correction in wave iv/. Ideally we will see a final spike down to test support at 148.83. However, GBP/JPY is testing a minor support-line which could prove to be strong enough to protect further downside progress and push GBP/JPY higher through minor resistance at 152.42 as confirmation that wave 5/ of iii is unfolding towards at least 160.54 and ideally closer to the 163.39 target.

Analysis are provided byInstaForex.

Best regards, PR Manager / Learn more about InstaForex Company at http://instaforex.com

Re: InstaForex Analysis

Forex Analysis & Reviews: Forecast for USD/JPY on December 9, 2021

Yesterday the Japanese yen traded in a range of 65 points, but the day was closed with a white candle and settling above the daily MACD line (blue sliding line) was confirmed.

https://forex-images.ifxdb.com/userfiles/20211209/analytics61b1708256a0e_source!.jpg

The Marlin Oscillator is approaching the border with the growth territory. This is a sign that the signal level of 113.96 (yesterday's high) is technically increasing its value - crossing and settling on it can be synchronized in time with the oscillator's transition to the positive area, which will strengthen the upward potential. The target for growth is the 115.80-116.15 range. Returning under the price channel line (113.21) will provoke an attack on the bearish signal level of 112.54, the crossing of which, in turn, will direct the price to the lower line of the price channel of 110.77.

https://forex-images.ifxdb.com/userfiles/20211209/analytics61b170915fdb5_source!.jpg

On the four-hour scale chart, the price settled above the MACD indicator line, the Marlin Oscillator is in a sideways local trend, but in the zone of positive values. The probability of further growth is 70%.

Analysis are provided byInstaForex.

Best regards, PR Manager / Learn more about InstaForex Company at http://instaforex.com

Re: InstaForex Analysis

Forex Analysis & Reviews: AUDUSD bullish breakout | 10th Dec 2021

The wandering nature of the euro, which we talked about in yesterday's review, is gaining confirmation this morning. The daily scale Marlin Oscillator begins chaotic movements along the zero line, approximately as it was in the third decade of October (gray rectangle). Therefore, we can take the price movement to 1.1415 and to 1.1170 equally probable. Taking into account the current downward trend, which has been going on since May, the probability of a downward trend is 55%. Of course, surpassing the target level of 1.1415 and the MACD line will direct the euro into medium-term growth.

https://forex-images.ifxdb.com/userfiles/20211210/analytics61b2bff173d4b_source!.jpg

On the four-hour chart, the price is being held by the MACD indicator line, the Marlin Oscillator has penetrated the bears' territory. If the price moves below yesterday's low (1.1278), it will also correspond to its decline below the MACD line, which will increase the probability of price movement to the lower target of 1.1170 to 75%.

https://forex-images.ifxdb.com/userfiles/20211210/analytics61b2bffd287f1_source!.jpg

Analysis are provided byInstaForex.

Best regards, PR Manager / Learn more about InstaForex Company at http://instaforex.com

Re: InstaForex Analysis

Forex Analysis & Reviews: EUR/USD Indicator Analysis; Daily review for December 13, 2021

Trend analysis (Fig. 1).
The market may move down on Monday from the level of 1.1314 (closing of Friday's daily candle) with the target at 1.1246, the support line (blue bold line). When testing this line, the price may continue to move upward with the target at 1.1306, the 23.6% retracement level (blue dashed line).

https://forex-images.ifxdb.com/userfiles/20211213/analytics61b6f38355455_source!.jpg

Fig. 1 (daily chart)
Comprehensive analysis:
- Indicator analysis - down;
- Fibonacci levels - down;
- Volumes - down;
- Candlestick analysis - down;
- Trend analysis - up;
- Bollinger lines - down;
- Weekly chart - down.

General conclusion:
The price may move down from the level of 1.1314 (closing of Friday's daily candle) with the target at 1.1246, the support line (blue bold line). When testing this line, the price may continue to move upward with the target at 1.1306, the 23.6% retracement level (blue dashed line).

Unlikely scenario: the price may start moving up from the level of 1.1314 (closing of Friday's daily candle) with the target at 1.1354, the upper fractal (red dotted line). When testing this level, the price may continue to move upward with the target at 1.1378, the 38.2% retracement level (blue dashed line).

Analysis are provided byInstaForex.

Best regards, PR Manager / Learn more about InstaForex Company at http://instaforex.com

Re: InstaForex Analysis

Forex Analysis & Reviews: Technical analysis for EUR/USD on December 14, 2021

Trend analysis (pic. 1).
Today, the pair has dropped from the level of 1.1283 (the closing of yesterday's daily candlestick). It may reach the support level of 1.1249 (the blue bold line). When testing this level, it is likely to rebound to the retracement level of 23.6% - 1.1305 (blue dotted line). After that, the pair may climb higher.

https://forex-images.ifxdb.com/userfiles/20211214/analytics61b833e3c8826_source!.jpg

Pic. 1 (daily chart).
Complex technical analysis:
- technical indicator analysis - down;
- Fibonacci retracement levels - down;
- trading volumes - down;
- candlestick analysis - up;
- trend analysis - up;
- Bollinger bands - down;
- weekly chart-up.

Conclusion:
Today, the price from the level of 1.1283 (closing of yesterday's daily candle), moving down, will try to reach the support line - 1.1249 (blue bold line). When testing this line, it is possible to move up in order to reach the pullback level of 23.6% - 1.1305 (blue dotted line), most likely, after that the price will go further up.

Alternatively, the pair may try to resume the downward movement from the 1.1283 level (closing of yesterday's daily candlestick) with the target level of 1.1249. It also acts as a support (blue bold line). Having tested this level, the pair is likely to decline to the target level of 1.1227, the bottom line (red dotted line).

Analysis are provided byInstaForex.

Best regards, PR Manager / Learn more about InstaForex Company at http://instaforex.com

Re: InstaForex Analysis

Forex Analysis & Reviews: Technical Analysis of ETH/USD for December 15, 2021

Crypto Industry News:
German savings banks plan to allow clients to invest in leading digital currencies such as Bitcoin and Ethereum directly from their accounts.

Savings banks in German-speaking countries, also known as Sparkassen, are working on a pilot of the launch of an internal cryptocurrency wallet and exchange next year, a local business magazine reported.

The pilot project is subject to approval by the Sparkasse committees in early next year, while the banking association intends to develop related services in early 2022.

A spokesman for the German Savings Association confirmed the news.

"More and more consumers are interested in cryptocurrencies. One in ten customers of German savings banks claim to own or have owned cryptocurrencies. Given their expectations, the Financial Group of Savings Banks must also look at cryptocurrencies," he said.

The representative added that a group of experts from the German IT service provider S-Payment "is currently exploring ways to provide options to securely store cryptocurrencies in a wallet for selected customers."

Technical Market Outlook

The ETH/USD pair has made another lower low at the level of $3,666 as the bears approach the key short-term technical support. The bulls had manage to bounce back up locally towards the technical resistance located at $4,913 so far. In a case of a further move down, the next target is seen at the swing low at the level of $3,438. Moreover, in order to extend the bounce, bulls need to test and break through the short-term trend line resistance located at the level of $4,300 and head towards the level of $4,435. Despite the extremely oversold market conditions at the H4 time frame, the bears are still on control of the market.

Weekly Pivot Points:
WR3 - $4,978
WR2 - $4,721
WR1 - $4,397
Weekly Pivot - $4,163
WS1 - $3,831
WS2 - $3,582
WS3 - $3,258

Trading Outlook:

The ABCxABC complex corrective cycle might be terminated, so the next long-term target for ETH is seen at the level of $5,000. Nevertheless, in order to continue the long-term up trend, the price can not close below the technical support at the level of $2,906. The level of $1,728 (61% Fibonacci retracement of the last big impulsive wave up) is still the key long-term technical support for bulls. The level of $3,677 is the key mid-term technical support for bulls.

https://forex-images.ifxdb.com/userfiles/20211215/analytics61b9846a35de2_source!.jpg

*The market analysis posted here is meant to increase your awareness, but not to give instructions to make a trade.

Analysis are provided byInstaForex.

Best regards, PR Manager / Learn more about InstaForex Company at http://instaforex.com

Re: InstaForex Analysis

Forex Analysis & Reviews: Forecast for USD/JPY on December 16, 2021

The dollar strengthened against the yen by 0.32% (35 points) on Wednesday following the US Federal Reserve meeting. The price broke the signal level of 113.96, crossed the indicator line of the daily scale balance, displacing the market interest in buying, and now its target is 115.80-116.15. The Marlin Oscillator supports this price plan by moving into an upward trend area.

https://forex-images.ifxdb.com/userfiles/20211216/analytics61baad99dd807_source!.jpg

On the chart of a four-hour scale, the price is in an upward trend by all indications: its development goes above the indicator lines, Marlin is in the positive area.

https://forex-images.ifxdb.com/userfiles/20211216/analytics61baada6bb4e2_source!.jpg

*The market analysis posted here is meant to increase your awareness, but not to give instructions to make a trade.

Analysis are provided byInstaForex.

Best regards, PR Manager / Learn more about InstaForex Company at http://instaforex.com

Re: InstaForex Analysis

Forex Analysis & Reviews: Forecast and trading signals for GBP/USD for December 17. Detailed analysis of the movement of the pair and trade deals. The pound has fully worked out the Bank of England's decision to raise the rate

Forex Analysis & Reviews: Forecast and trading signals for GBP/USD for December 17. Detailed analysis of the movement of the pair and trade deals. The pound has fully worked out the Bank of England's decision to raise the rate

https://forex-images.ifxdb.com/userfiles/20211217/analytics61bbf61547470_source!.jpg

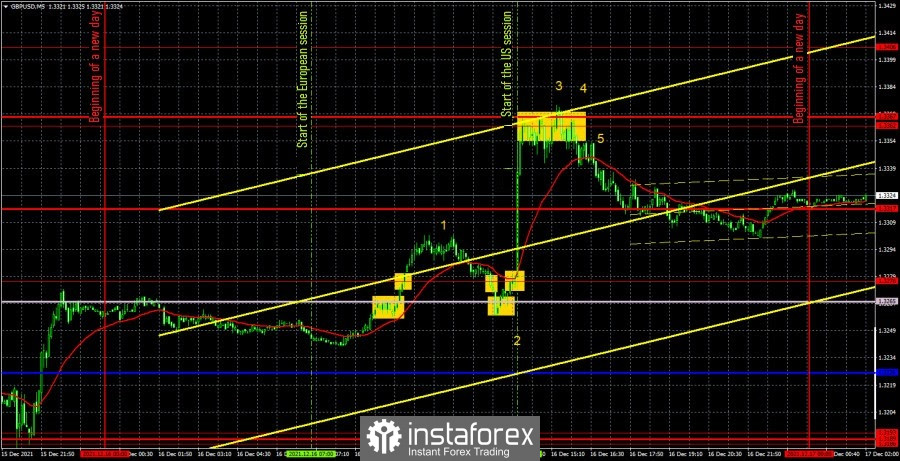
The GBP/USD pair showed volatility equal to 135 points on Thursday. The growth of the British currency's quotes began at the European trading session. Thus, British traders worked out the results of the Federal Reserve meeting. The British currency rose a bit more, but then rolled back down, as the index of business activity in the UK services sector turned out to be weak (figure "1" in the chart). However, the downward movement did not last long, so the Bank of England decided to raise the key rate to 0.25%, which provoked a strong growth of the British currency to the resistance level of 1.3367. But with the release of American statistics, it could give the impression that it was she who provoked the growth of the dollar. But we believe that this is not the case, since the US data is hardly strong. As a result, the pair "flew" perfectly from side to side yesterday, and we just have to deal with the trading signals and understand how to work out all these movements. The first buy signal was formed when the pair overcame the Senkou Span B line and the extreme level of 1.3276. After that, a little more than 20 points were passed up, which allowed traders to set the Stop Loss to breakeven. According to this order, the purchase transaction was closed. Then the pair returned to the area of 1.3265 - 1.3276 and not very confidently, but bounced off it, forming another buy signal. However, it was formed exactly at the time when the Bank of England announced the results of its meeting, so traders could hardly have time to open a deal and set a Stop Loss on it in order to take a risk. Thus, it simply did not work out to work out this signal. But the pound still allowed traders to earn. The pair very quickly reached the extreme level of 1.3362, from which it bounced and formed a sell signal, after which an equally strong downward movement began and in the late afternoon the quotes dropped by about 45 points from the point of forming a sell signal. Thus, near the level of 1.3317, short positions could be closed manually. Although a little, but it turned out that one could earn yesterday.
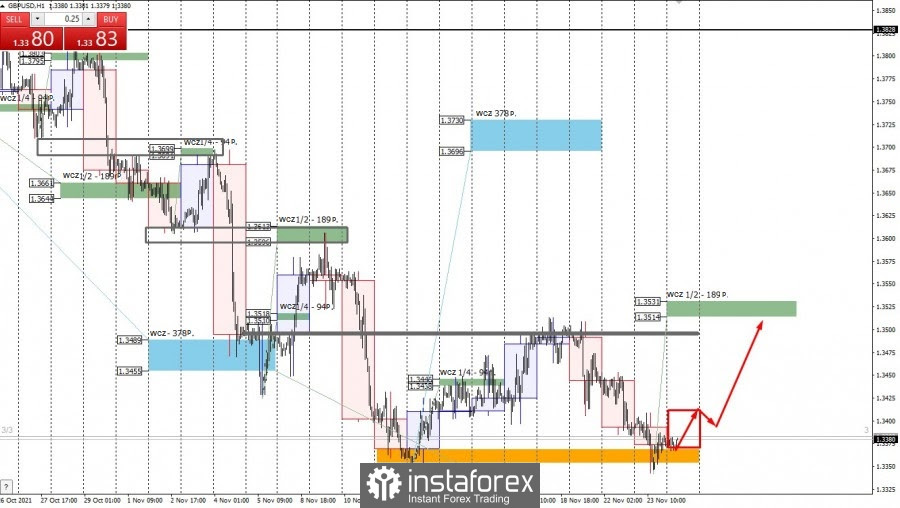
GBP/USD 1H

https://forex-images.ifxdb.com/userfiles/20211217/analytics61bbf618871b2_source!.jpg

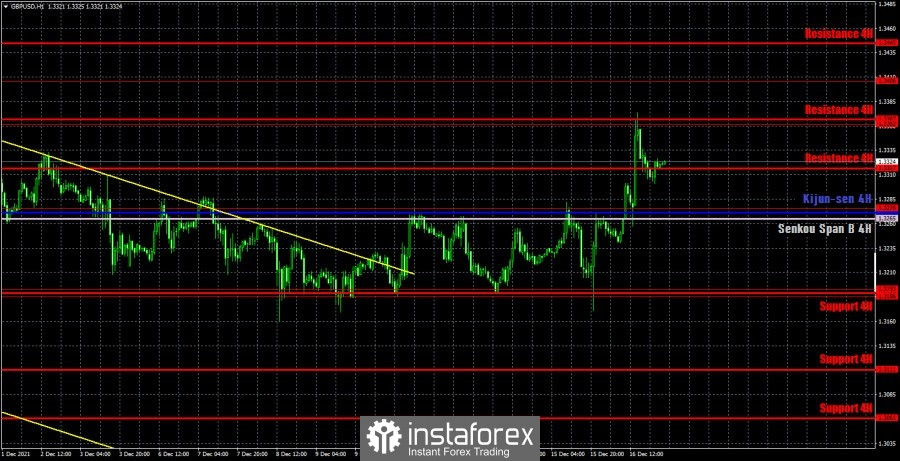
On the hourly timeframe, the pound/dollar pair has been in the stage of strong growth for a whole day, but at this time it has started a new round of downward movement and may well return to its original positions, as well as the euro currency. Formally, there is an upward trend now, since the price settled above the descending channel earlier, but after two important meetings of the central banks, we need to let the market calm down a little and see where the pair will be at the end of this week. On December 17, we highlight the following important levels: 1,3186 - 1,3193, 1,3276, 1,3362, 1,3406. There are no levels below, as the price has not been so low for more than a year. The Senkou Span B(1.3265) and Kijun-sen(1.3272) lines can also be signal sources. Signals can be "rebounds" and "breakthroughs" of these levels and lines. It is recommended to set the Stop Loss level to breakeven when the price passes in the right direction by 20 points. The lines of the Ichimoku indicator can move during the day, which should be taken into account when searching for trading signals. On Friday, a report on retail sales for November will be published in the UK, but this report is likely to be overshadowed by two meetings that took place earlier this week. Thus, we are not waiting for the reaction of traders to this report. Nothing interesting is planned in the United States today.

We recommend you to familiarize yourself:
Overview of the EUR/USD pair. December 17. Predictable Fed and passive ECB.
Overview of the GBP/USD pair. December 17. An unexpected expected surprise from the Bank of England.
Forecast and trading signals for EUR/USD for December 17. Detailed analysis of the movement of the pair and trade deals.
COT report

*The market analysis posted here is meant to increase your awareness, but not to give instructions to make a trade.

https://forex-images.ifxdb.com/userfiles/20211217/analytics61bbf61bc5d0f_source!.jpg

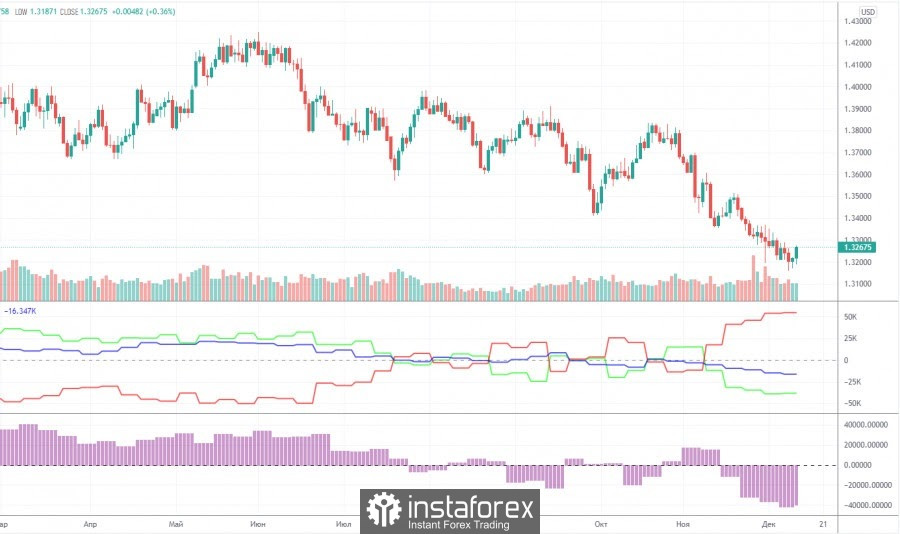
The mood of professional traders became a little less bearish during the last reporting week (November 30 – December 6). Professional traders closed 3,600 sell contracts (shorts) and 2,100 buy contracts (longs) during the week. Thus, the net position for the "non-commercial" group of traders increased by 1,500 contracts. This is a very small change even for the British pound. In general, the mood of non-commercial traders continues to be bearish, and quite strong. We draw your attention to how low the green line of the first indicator is located in the chart above, which reflects the net position of the non-commercial group. Thus, unlike the euro, the pound's decline in recent weeks looks just logical: major players sell off the currency, and it falls. A further decline in the British currency is also now quite likely, but at the same time we draw your attention to the fact that the green and red lines of the first indicator have moved quite far from each other. This may indicate that the downward trend is drying up. Thus, we get a situation in which the euro currency is not moving down quite logically, and the pound may complete its movement in the near future. Thus, for both major pairs, we recommend waiting for the downward trend to end, but do not start buying until specific buy signals are formed.

Explanations for the chart:
Support and Resistance Levels are the levels that serve as targets when buying or selling the pair. You can place Take Profit near these levels.
Kijun-sen and Senkou Span B lines are lines of the Ichimoku indicator transferred to the hourly timeframe from the 4-hour one.
Support and resistance areas are areas from which the price has repeatedly rebounded off.
Yellow lines are trend lines, trend channels and any other technical patterns.
Indicator 1 on the COT charts is the size of the net position of each category of traders.
Indicator 2 on the COT charts is the size of the net position for the non-commercial group.

*The market analysis posted here is meant to increase your awareness, but not to give instructions to make a trade.

Analysis are provided byInstaForex.

Best regards, PR Manager / Learn more about InstaForex Company at http://instaforex.com

973 (edited by ifx.gertrude 2021-12-20 08:31:54)

Re: InstaForex Analysis

Forex Analysis & Reviews: Trading signals for CRUDE OIL on December 20 - 21, 2021: buy above 68,75 (2/8)

https://forex-images.ifxdb.com/userfiles/20211220/analytics61bff42862a21_source!.jpg

The oil price (WTI- #CL) kicked off this week with a bearish gap and approached the low of 68,75. The 2/8 Murray zone is strong support for crude oil. It is expected for the next few days to bounce above this level with targets at the 21 SMA located at 70,77.

The International Energy Agency (IEA) downgraded the outlook for oil demand by around 100,000 barrels per day for both 2021 and 2022, citing the emergence of the Omicron variant weighing on global oil demand.

A surplus in oil inventories of 1.7 million barrels per day could materialize in the first quarter of 2022, an oil surplus of 2 million barrels per day could materialize in the second quarter of 2022.

According to the IEA report, global supply could skyrocket by 6.4 million barrels per day next year compared to an increase of 1.5 million barrels per day in 2021.

In the medium term, oil could be under downward pressure. If inventories continue to increase in the market, the oil price could decline more to the psychological level of 50,00.

On the chart, we can see that oil is trading below the 200 EMA located at 73,55 and below the 21 SMA at 70,77. This technical data provides the negative outlook for oil, which we could expect to fall in the next few days towards 65,62 and even more to the low of December 2 at 62,40.

Our trading plan is to buy as long as it remains above 2/8 Murray, with the target at SMA of 21 at 70,77. Friday's gap at the close of Friday will be covered. A consolidation above 70.77 could boost the recovery of oil to the level of 200 EMA at 73,55.

Conversely, a daily close below 68,40 could quickly accelerate the WTI decline. The objective will be to cover the gap that remains open at 65,62 if the downward pressure prevails up to 62,40. The eagle indicator continues to give the negative signal. It is likely that it could continue the fall in the coming days.

Support and Resistance Levels for December 20 - 21, 2021

Resistance (3) 70,76
Resistance (2) 70,19
Resistance (1) 69,32

----------------------------

Support (1) 68,72
Support (2) 67,97
Support (3) 67,01

***********************************************************

A trading tip for WTI on December 20 - 21, 2021

Buy above 68,75 (2/8) with take profit at 70,77 and 73,55 (200 EMA), stop loss below 68,30.

*The market analysis posted here is meant to increase your awareness, but not to give instructions to make a trade.

Analysis are provided byInstaForex.

Best regards, PR Manager / Learn more about InstaForex Company at http://instaforex.com

Re: InstaForex Analysis

Forex Analysis & Reviews: Forecast for EUR/USD on December 21, 2021

The euro rose by 37 points on Monday, extending the lateral movement in time from the 7th. The Marlin Oscillator continued to form the pattern of the third decade of October (gray area). Then, after the sideways trend of the oscillator, the price fell, a similar outcome is likely in the current situation.

https://forex-images.ifxdb.com/userfiles/20211221/analytics61c13e3aa0c3e_source!.jpg

The four-hour chart shows a correctional price rebound from the support area on December 7 and 16, which was expected yesterday. The balance indicator line stopped the price's growth, while the oscillator's growth was stopped by its own zero line - the border with the bulls' territory. Now we are waiting for a repeated attack on the support area on December 7 and 16 (1.1225/40), surpassing it and further decline to the first target level of 1.1170, then to 1.1050.

https://forex-images.ifxdb.com/userfiles/20211221/analytics61c13e4829cf1_source!.jpg

Analysis are provided byInstaForex.

Best regards, PR Manager / Learn more about InstaForex Company at http://instaforex.com

Re: InstaForex Analysis

Forex Analysis & Reviews: Elliott wave analysis of EUR/JPY for December 22, 2021

https://forex-images.ifxdb.com/userfiles/20211222/analytics61c2c42a0299e_source!.jpg

EUR/JPY is clearly in its final stages of the correction near wave 4/. All we need is a break above minor resistance at 129.64 to confirm that wave 4/ is completed and wave 5/ of 3 is in motion towards at least 135.04 and possibly even closer to the 139.70 target. This will complete wave 3 and set the stage for another wave 4 correction,. However, first we need to stay alert to signs that wave 4/ is completed and wave 5/ is in motion. The best thing that can happen is a break above minor resistance at 129.64 to confirm that wave 5/ is in motion.

*The market analysis posted here is meant to increase your awareness, but not to give instructions to make a trade.

Analysis are provided byInstaForex.

Best regards, PR Manager / Learn more about InstaForex Company at http://instaforex.com

Posts: 951 to 975 of 1,547

Pages Previous 1 37 38 39 40 41 62 Next

You must login or register to post a reply

Forex Software → Market Analysis → InstaForex Analysis

Similar topics in this forum