forex software

Create and Test Forex Strategies

forex software

Skip to forum content

Forex Software

Create and Test Forex Strategies

You are not logged in. Please login or register.


(Page 38 of 62)

Forex Software → Market Analysis → InstaForex Analysis

Pages Previous 1 36 37 38 39 40 62 Next

You must login or register to post a reply

RSS topic feed

Posts: 926 to 950 of 1,547

Re: InstaForex Analysis

Forex Analysis & Reviews: Elliott wave analysis of gold for October 14, 2021

https://forex-images.ifxdb.com/userfiles/20211014/analytics6167b6ad1fdb3_source!.jpg

Gold is ready to challenge minor resistance at 1,834 again. It is likely to break higher towards key resistance at 1,917. A break above here will finally confirm that the triangle consolidation we have witnessed in the last 13 months has been completed and the next impulsive rally towards 2,344 is in motion.

In the short term, we see support at 1,750 that ideally will be able to act as a floor for the rally to and above minor resistance at 1,834.

Analysis are provided byInstaForex.

Best regards, PR Manager / Learn more about InstaForex Company at http://instaforex.com

Re: InstaForex Analysis

Forex Analysis & Reviews: Forecast for EUR/USD on October 15, 2021

EUR/USD
Yesterday, the euro closed the day with a symbolic growth of 1 point, the peak growth was 30 points, so yesterday can be considered corrective. US retail sales data for September are due tonight, forecast at -0.3%. In the euro area, an increase in the trade balance for August is expected from 13.4 billion euros to 15.3 billion. The euro will likely rise. The growth target is the MACD line in the 1.1668 area.

https://forex-images.ifxdb.com/userfiles/20211015/analytics6168ecb972452_source!.jpg

On the four-hour scale, the Marlin Oscillator was discharged from the overbought zone yesterday, now it is ready to continue rising. The correction developed above the balance indicator line, which means that investors are still interested in buying.

https://forex-images.ifxdb.com/userfiles/20211015/analytics6168ecc59b53e_source!.jpg

Analysis are provided byInstaForex.

Best regards, PR Manager / Learn more about InstaForex Company at http://instaforex.com

Re: InstaForex Analysis

Forex Analysis & Reviews: Technical Analysis of EUR/USD for October

Technical Market Outlook:
The EUR/USD pair had been rejected from the technical resistance seen at level of 1.1613, which is very close to the upper channel line. The series of some Pin Bars around this level is indicating as possible down move continuation towards the level of 1.1562 (intraday technical support), 1.1539 (technical support) or 1.1514 (the key short-term technical support).

On the other hand, the level of 1.1497 remains the key long-term technical support for bulls and any violation of this level will be seen as very negative for bulls. Please notice the market keeps trading inside of the descending channel, so the bears are still in control of the market.

Weekly Pivot Points:
WR3 - 1.1742
WR2 - 1.1684
WR1 - 1.1640
Weekly Pivot - 1.1582
WS1 - 1.1545
WS2 - 1.1479
WS3 - 1.1445

Trading Outlook:
The market is in control by bears that pushed the prices towards the level of 1.1562, which is the lowest level since November 2020. The next target for bears is seen at the level of 1.1497. The up trend can be continued towards the next long-term target located at the level of 1.2350 (high from 06.01.2021) only if bullish cycle scenario is confirmed by breakout above the level of 1.1909 and 1.2000.

https://forex-images.ifxdb.com/userfiles/20211018/analytics616d1bd59c570_source!.jpg

Analysis are provided byInstaForex.

Best regards, PR Manager / Learn more about InstaForex Company at http://instaforex.com

Re: InstaForex Analysis

Forex Analysis & Reviews: Elliott wave analysis of Copper for October 19, 2021

https://forex-images.ifxdb.com/userfiles/20211019/analytics616e5a0a4b043_source!.jpg

After a temporary correction in wave 4/ copper is on its way towards a new all-time high and a move closer to the next target at 5.07 and 5.76. If Copper takes a moon-shot, we could see Copper aim for 6.88 where wave 5/ will be equal in length to the distance traveled from the start of wave 1/ through to the peak of wave 3/ added to the low of wave 4.

Support is now seen at 4.44 with key support seen at 4.01.


Analysis are provided byInstaForex.

Best regards, PR Manager / Learn more about InstaForex Company at http://instaforex.com

Re: InstaForex Analysis

Forex Analysis & Reviews: Elliott wave analysis of EUR/JPY for October 20, 2021

https://forex-images.ifxdb.com/userfiles/20211020/analytics616f9547c87b9_source!.jpg

EUR/JPY has extended its sub-wave iii/ closer to the wave iii peak at 134.12. However, a correction in sub-wave iv/ should be expected soon towards support near 132.12 before the final impulsive rally towards the long-term target for wave 5/ and 3.

As JPY-crosses often form triangle consolidation in their fourth waves, we will be looking for a triangle consolidation in sub-wave iv/ .

Analysis are provided byInstaForex.

Best regards, PR Manager / Learn more about InstaForex Company at http://instaforex.com

Re: InstaForex Analysis

Forex Analysis & Reviews: Elliott wave analysis of AUD/USD for October

https://forex-images.ifxdb.com/userfiles/20211021/analytics6170f5a047ab0_source!.jpg

AUD/USD has broken above resistance at 0.7478 indicating that wave A completed with the test of 0.7106 in late August and wave B is now in motion. B-waves are the most difficult waves to predict as all kinds of combinations may occur. Wave A was in three waves and that calls for only two possibilities for wave B. It can be a flat correction, which calls for a rally back to at least 0.7890 and possibly closer to the start of wave A at 0.8007. Wave B can be a triangle in which case we could see a rally to between 0.7614 to 0.7814 before topping and then move lower near 0.7765.

Only time will show how wave B develops. Once wave B is completed, C will be a five-wave decline to complete wave 2 and set the stage for a new impulsive rally in wave 3.

Analysis are provided byInstaForex.

Best regards, PR Manager / Learn more about InstaForex Company at http://instaforex.com

Re: InstaForex Analysis

Forex Analysis & Reviews: Gold respects cloud support.

Gold price continues to respect the cloud support in the 4 hour chart and once again bounces off the cloud. Gold price is at $1,788 having made a higher low at the cloud support at $1,777. Gold price faces a major resistance trend line now and breaking above it will be an important bullish sign.

https://forex-images.ifxdb.com/userfiles/20211022/analytics61725ab28c117_source!.jpg

Black line - major resistance trend line

Gold price is trading above the Kumo and above both the tenkan-sen (red line indicator) and the kijun-sen (yellow line indicator). Support is at $1,782, $1,778 and $1,772. Holding above the cloud is crucial for the short-term trend. Bulls need to show more signs of strength in order for more upside to be expected. So far short-term trend is in bull's control. Breaking above $1,790-$1,800 is important not only because of the major trend line, but because there we also find the upper cloud resistance in the Daily chart. A break out in a Daily time frame provides added support to the bullish scenario for a move towards $1,860 and higher.

Analysis are provided byInstaForex.

Best regards, PR Manager / Learn more about InstaForex Company at http://instaforex.com

Re: InstaForex Analysis

Forex Analysis & Reviews: USDCHF bullish momentum | 25nd Oct 2021

https://forex-images.ifxdb.com/userfiles/20211025/analytics6176595487240_source!.jpg

Price is seen to be reacting in a potential triangle. We can expect price to make a short-term bullish bounce from the 1st support in line with 61.8% Fibonacci retracement, towards the 1st Resistance in line with 127.2% Fibonacci projection and 38.2% Fibonacci retracement. Our short-term bullish bounce is further supported by the stochastic indicator where the %K line bounces off the support level.

Trading Recommendation
Entry: 0.91510
Reason for Entry:
61.8% Fibonacci retracement
Take Profit: 0.92278
Reason for Take Profit:
127.2% Fibonacci projection and 38.2% Fibonacci retracement
Stop Loss: 0.91336
Reason for Stop Loss:
127.2& Fibonacci projection

Analysis are provided byInstaForex.

Best regards, PR Manager / Learn more about InstaForex Company at http://instaforex.com

Re: InstaForex Analysis

Forex Analysis & Reviews: Technical Analysis of GBP/USD for October 26, 2021

https://forex-images.ifxdb.com/userfiles/20211026/analytics6177b2de86196_source!.jpg

Technical Market Outlook
The GBP/USD pair has failed to break through the technical resistance located at 1.3790. The momentum remains positive, but is not that strong yet as the market conditions are coming off the overbought levels and the bearish pressure intensify. The immediate technical support is seen at the level of 1.3726. The larger time frame trend remains up and the bulls have a chance to make a Bullish Engulfing candlestick pattern at the daily time frame chart.

Weekly Pivot Points:
WR3 - 1.3933
WR2 - 1.3884
WR1 - 1.3802
Weekly Pivot - 1.3757
WS1 - 1.3683
WS2 - 1.3629
WS3 - 1.3554

Trading Outlook:
The up trend on a larger time frame charts is being continued, but only a sustained breakout above the level of 1.4000 would improve the outlook to more bullish with a target at 1.4200. 100 DMA is located at the level of 1.3792 and 200 DMA is seen at 1.3846.

Analysis are provided byInstaForex.

Best regards, PR Manager / Learn more about InstaForex Company at http://instaforex.com

Re: InstaForex Analysis

Forex Analysis & Reviews: GBPJPY facing bullish pressure, potential for more upside!

https://forex-images.ifxdb.com/userfiles/20211027/analytics6178de0921d5f_source!.jpg

Price is consolidating within the ascending channel and reacting above the ascending channel support. Price could potentially bullish from 1st support at 156.719 in line with 23.6% Fibonacci retracement and 61.8% Fibonacci extension to 1st resistance at 158.888 in line with 127.2% Fibonacci retracement and 78.6% Fibonacci extension. Our bullish bias is further supported by how price is trending above the Ichimoku cloud and also by how RSI is abiding to the ascending trendline support. Otherwise price may bearish towards 2nd support at 155.357 in line with 38.2% Fibonacci retracement and 100% Fibonacci extension.

Trading Recommendation
Entry: 156.719
Reason for Entry:
23.6% Fibonacci retracement and 61.8% Fibonacci extension
Take Profit: 158.888
Reason for Take Profit:
127.2% Fibonacci retracement and 78.6% Fibonacci extension
Stop Loss: 155.357
Reason for Stop Loss:
38.2% Fibonacci retracement and 100% Fibonacci extension.

Analysis are provided byInstaForex.

Best regards, PR Manager / Learn more about InstaForex Company at http://instaforex.com

Re: InstaForex Analysis

Forecast for AUD/USD on October 28, 2021

The Australian dollar is forming a sideways short-term trend.

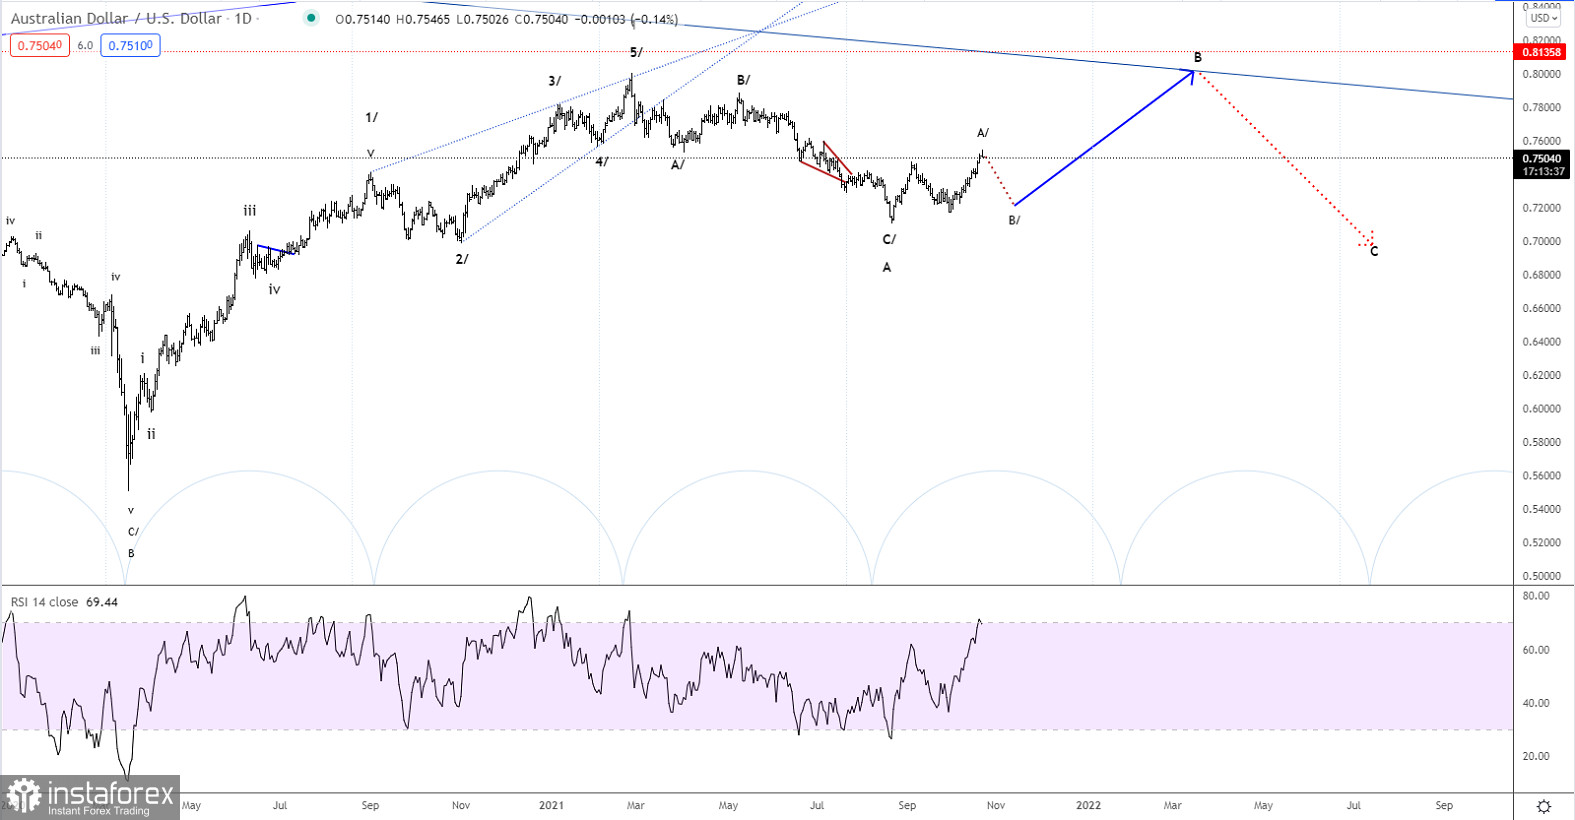
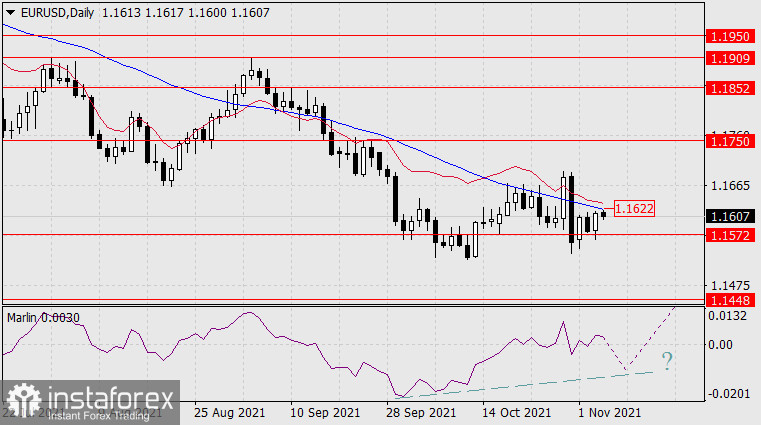
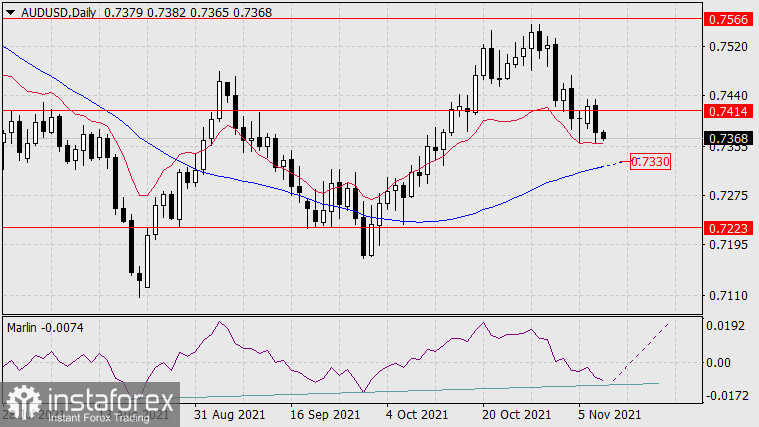
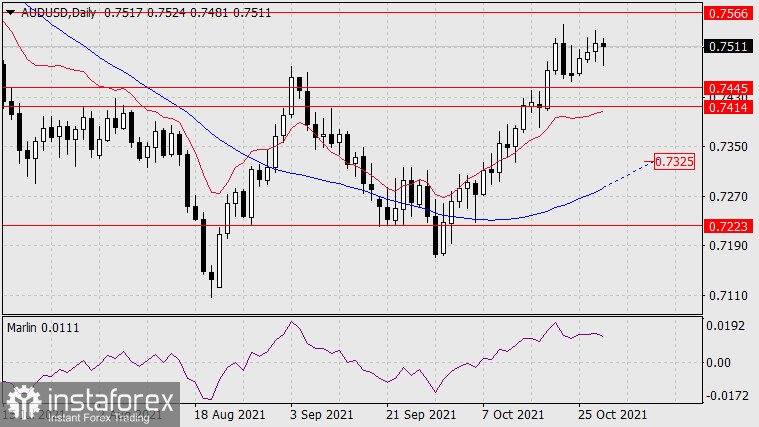
On Wednesday, as in the previous two days, the Australian dollar continued to rise to the target level of 0.7566, set by the lows of March 25 and February 2 this year. Overcoming this level will open the next target of 0.7646 - the low on June 3. But in today's Asian session, the fall has blocked yesterday's growth, the Marlin Oscillator has outlined a downward reversal. This is probably a lateral movement before further growth. Unless, of course, the level of 0.7414 is overcome, which may lead to a decline to the MACD line on the daily in the area of 0.7325.

https://forex-images.ifxdb.com/userfiles/20211028/analytics617a132969056_source!.jpg

At 2.00 am ET Thursday, Destatis is scheduled to issue Germany's factory orders for December. Orders are forecast to climb 0.6 percent on month, reversing a 1.3 percent drop in November.

Ahead of the data, the euro traded mixed against its major rivals. While the euro rose against the franc, it held steady against the rest of major rivals. The euro was worth 1.1000 against the greenback, 120.90 against the yen, 1.0713 against the franc and 0.8471 against the pound as of 1:55 am ET.

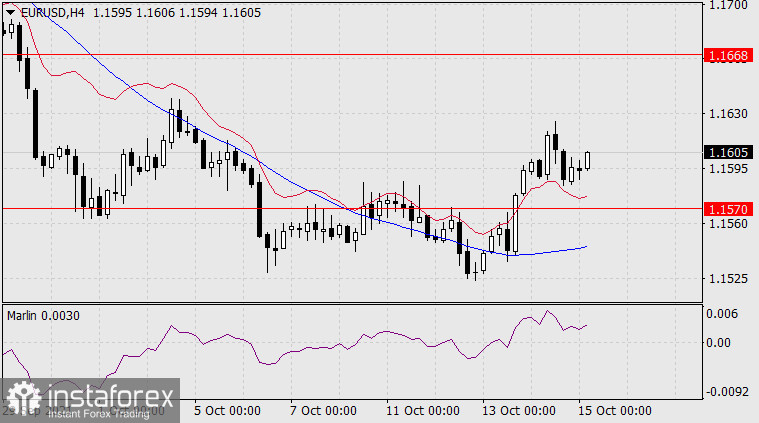
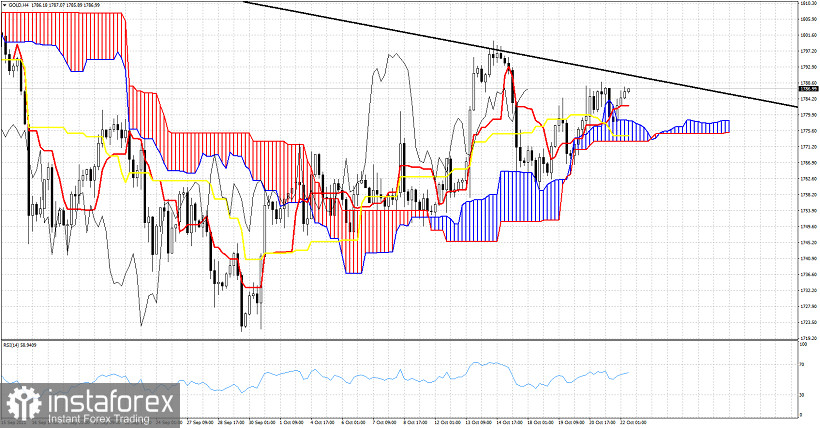
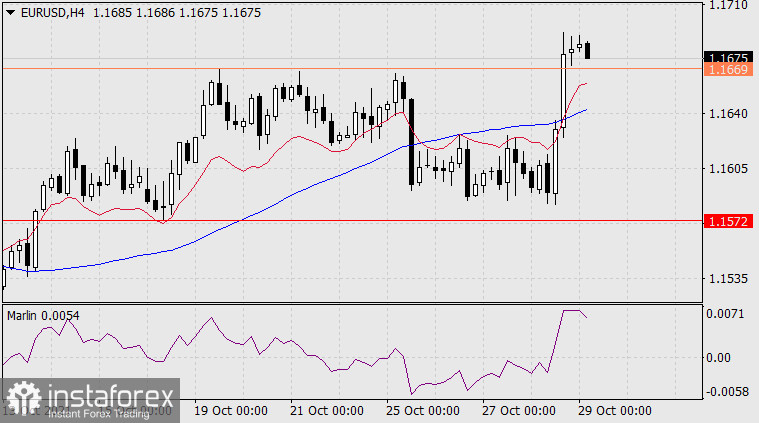
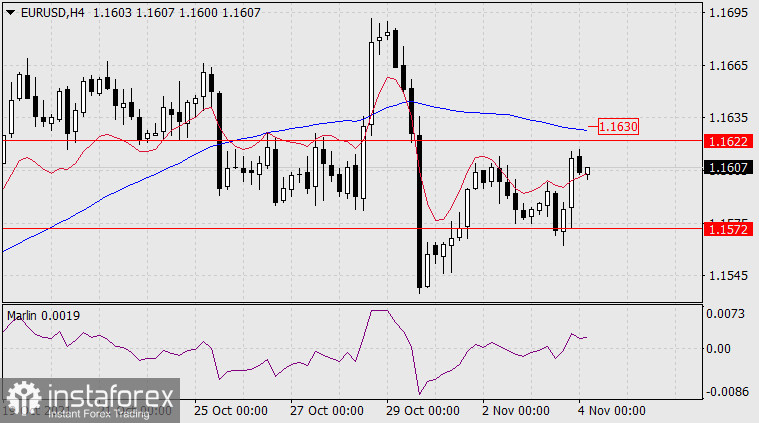
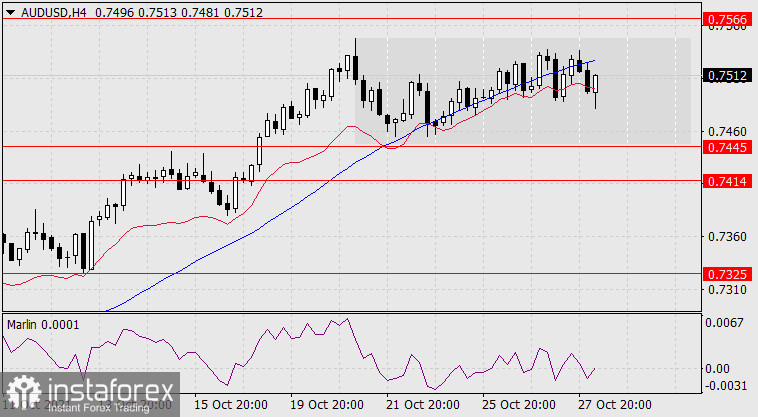
On the four-hour chart, the price settled below the MACD indicator line (blue), while the Marlin Oscillator entered negative territory. Short-term pressure on the price has increased. In general, the AUD/USD pair has no pronounced signals in either direction - the chance of quickly reaching the support of 0.7445 did not materialize with the support of such a scenario by technical indicators, but the pressure will remain for some time, the price will develop in a sideways range.

https://forex-images.ifxdb.com/userfiles/20211028/analytics617a13429eaea_source!.jpg


*The market analysis posted here is meant to increase your awareness, but not to give instructions to make a trade.

Best Regards,PR Manager
InstaForex Companies Group

Re: InstaForex Analysis

Forex Analysis & Reviews: Forecast for EUR/USD on October 29, 2021

The euro grew by 49 points on Thursday, but not on the basis of the European Central Bank meeting to determine the decision on the fate of PEPP in December, but on the disappointing US GDP for the third quarter, which amounted to 2.0% against the expected 2.6%.

https://forex-images.ifxdb.com/userfiles/20211029/analytics617b5ba848847_source!.jpg

On the daily scale chart, the price crossed the balance and MACD indicator lines, as well as the signal level of 1.1669. Now the target is open at 1.1750 - resistance on September 21-24. Overcoming the level opens the second target at 1.1852, which is likely to be achieved, as investors paid more attention to the US indicators. Today we will receive data on expenses and income of individuals for September, forecasts for which are weak: income -0.2%, expenses 0.5% against 0.8% in August. On Monday, the ISM manufacturing PMI for October is expected to decline from 61.1 to 60.4, on Wednesday the volume of industrial orders for September may show a decrease of 0.1%, which will lead to a downward revaluation of GDP, and may also deter the Fed from optimistic forecasts at the meeting on November 3rd.

https://forex-images.ifxdb.com/userfiles/20211029/analytics617b5bbcd831d_source!.jpg

The situation is completely upward on the H4 chart: the price settled above the signal level of 1.1669, the Marlin Oscillator is growing in the positive area.

Analysis are provided byInstaForex.

Best regards, PR Manager / Learn more about InstaForex Company at http://instaforex.com

Re: InstaForex Analysis

Forex Analysis & Reviews: GBPUSD facing bearish pressure, potential for more downside!

https://forex-images.ifxdb.com/userfiles/20211101/analytics617f7ee3c81f6_source!.jpg

Price is below the 1st resistance at 1.37093 in line with 23.6% Fibonacci retracement and 38.2% Fibonacci extension. Price has also shown a bearish breakout below the neckline of a possible head and shoulder pattern and also holding below the Daily 50MA. Price could potentially bearish from 1st resistance at 1.37093 in line with 23.6% Fibonacci retracement and 38.2% Fibonacci extension to 1st support at 1.36099 in line with 78.6% Fibonacci retracement and 161.8% Fibonacci extension . Our bearish bias is further supported by how Price is holding below the Ichimoku cloud and MACD is holding below the 0 line. Otherwise price may continue to bullish to 2nd resistance at 1.37732 in line with 61.8% Fibonacci retracement and 100% Fibonacci extension.

Trading Recommendation
Entry: 1.37093
Reason for Entry:
23.6% Fibonacci retracement and 38.2% Fibonacci extension
Take Profit: 1.36099 Reason for Take Profit:
78.6% Fibonacci retracement and 161.8% Fibonacci extension
Stop Loss: 1.37732
Reason for Stop Loss:
61.8% Fibonacci retracement and 100% Fibonacci extension.

Analysis are provided byInstaForex.

Best regards, PR Manager / Learn more about InstaForex Company at http://instaforex.com

Re: InstaForex Analysis

Forex Analysis & Reviews: NZDJPY facing bullish pressure, potential for more upside!

https://forex-images.ifxdb.com/userfiles/20211102/analytics6180b2ed7d28b_source!.jpg

Price has broken out of the symmetrical triangle and is above 1st support at 81.799 in line with 38.2% Fibonacci retracement and 61.8% Fibonacci extension. Price could potentially bullish from 1st support at 81.799 in line with 38.2% Fibonacci retracement and 61.8% Fibonacci extension to 1st resistance at 82.507 in line with -0.272% Fibonacci retracement and 78.6% Fibonacci extension. Our bullish bias is further supported by how Price is holding above the EMA and the Ichimoku cloud and RSI is abiding to an ascending trendline support. Otherwise price may continue to bearish to 2nd support at 81.350 in line with 78.6% Fibonacci retracement and 127% Fibonacci extension.

Trading Recommendation
Entry: 81.799
Reason for Entry:
38.2% Fibonacci retracement and 61.8% Fibonacci extension
Take Profit: 82.507
Reason for Take Profit:
-0.272% Fibonacci retracement and 78.6% Fibonacci extension
Stop Loss: 81.350
Reason for Stop Loss:
78.6% Fibonacci retracement and 127% Fibonacci extension.

Analysis are provided byInstaForex.

Best regards, PR Manager / Learn more about InstaForex Company at http://instaforex.com

Re: InstaForex Analysis

Forex Analysis & Reviews: Trading plan for GBP/USD on November 3, 2021

The GBP/USD pair closed yesterday below the defining support zone of the Weekly Control Zone 1/2 1.3661-1.3644. This allows us to consider today's growth as an opportunity to search for selling prices.

The opening level of yesterday's trading is decisive, so it can be used as the most favorable selling price for this instrument in the case of today's upward movement. The maximum correction zone is the WCZ 1/4 1.3699-1.3691. The target of the bearish impulse was the Weekly Control Zone 1.3489-1.3455. There is a 75% probability of testing these levels.

https://forex-images.ifxdb.com/userfiles/20211103/analytics6181fed5d8fb0_source!.jpg

It is not profitable to consider buying options, since the downward movement is a medium-term impulse, which increases the probability of repeated updates of the weekly minimum to 80%. This week's main task is to find favorable prices for sale.

Analysis are provided byInstaForex.

Best regards, PR Manager / Learn more about InstaForex Company at http://instaforex.com

Re: InstaForex Analysis

Forex Analysis & Reviews: Forecast for EUR/USD on November 4, 2021

Yesterday's Federal Reserve meeting was a little "softer" than the markets expected. The central bank cut the asset repurchase program on its balance sheet by $15 billion a month, but strenuously stressed that there is still a long way to a rate hike. Investors reacted accordingly - they sold the dollar. Moreover, the trading volumes were not large, slightly above average, and almost the entire volume was selected in the first hour after the release.

https://forex-images.ifxdb.com/userfiles/20211104/analytics61834dbe2d3bc_source!.jpg

On the technical side, the likelihood of growth, of course, increased, but strategically the situation remained the same as a day ago; for the growth to develop, the price must settle above the MACD line on the daily chart, above 1.1622. And if the price goes below the level of 1.1572, the risk of price convergence with the Marlin Oscillator opens up again. But as this probability has become lower, it is now indicated by the dotted lines.

https://forex-images.ifxdb.com/userfiles/20211104/analytics61834dc9efc1a_source!.jpg

On the four-hour chart, the main change was that the price went above the balance indicator line. If yesterday's initial momentum is maintained, the price will break above 1.1622 and above 1.1630, breaking the MACD line on its timeframe. The Marlin Oscillator is in the positive area. The price has a chance to rise. But... the probability of a price increase is 55%. This is due to the fact that at the same time as the price rises, the technical pressure on it also increases. As mentioned above, strategically, nothing has changed over the past day. Today is likely to pass in anticipation of the market's decision in such a difficult situation.

Analysis are provided byInstaForex.

Best regards, PR Manager / Learn more about InstaForex Company at http://instaforex.com

Re: InstaForex Analysis

Forex Analysis & Reviews: USDJPY potential bullish momentum | 5th Nov 2021

https://forex-images.ifxdb.com/userfiles/20211105/analytics6184c27c7ae4c_source!.jpg

Price is currently reacting in a triangle and a bullish pennant pattern. We can expect price to bounce from 1st support in line with 88% Fibonacci retracement and 78.6% Fibonacci projection towards the 1st Resistance level in line with 61.8% Fibonacci projection. Our short-term bullish bias is further supported by RSI approaching the support level.

Trading Recommendation
Entry: 113.551
Reason for Entry:
88% Fibonacci retracement and 78.6% Fibonacci projection
Take Profit: 114.024
Reason for Take Profit:
61.8% Fibonacci projection
Stop Loss: 113.412
Reason for Stop Loss:
100% Fibonacci projection

Analysis are provided byInstaForex.

Best regards, PR Manager / Learn more about InstaForex Company at http://instaforex.com

Re: InstaForex Analysis

Forex Analysis & Reviews: USDCAD bullish bounce | 8rd Nov 2021

https://forex-images.ifxdb.com/userfiles/20211108/analytics6188c24686e45_source!.jpg

On the H4, with price bouncing off the support on the RSI indicator and price moving above the ichimoku cloud, we have a bullish bias that price will rise from 1st support at 1.24286 in line with the 50% Fibonacci retracement levels and the horizontal overlap support to 1st resistance at 1.24796 in line with the graphical swing high resistance and possibly even to 2nd resistance at 1.24964 in line with the graphical swing high from 12th of October. Alternatively, we may see price break 1st support structure and head for 2nd support at 1.24024 in line with the 78.6% Fibonacci retracement level and horizontal overlap support.

Trading Recommendation Entry: 1.24286
Reason for Entry:
50% Fibonacci retracement levels and the horizontal overlap support
Take Profit:1.24796
Reason for Take Profit:
graphical swing high resistance
Stop Loss:1.24024
Reason for Stop Loss:
78.6% Fibonacci retracement level and horizontal overlap support

Analysis are provided byInstaForex.

Best regards, PR Manager / Learn more about InstaForex Company at http://instaforex.com

Re: InstaForex Analysis

Forex Analysis & Reviews: USDCHF potential bearish drop | 9th Nov 2021

https://forex-images.ifxdb.com/userfiles/20211109/analytics6189ebe83cb44_source!.jpg

On the H4 timeframe, price is now abiding to a descending trendline resistance, signifying bearish momentum. We can now expect price to make a drop from the 1st resistance in line with 61.8% Fibonacci retracement and 61.8 % Fibonacci projection towards the 1st Support in line with 78.6% Fibonacci projection and 78.6% Fibonacci retracement. Price is currently in the middle of the descending trendline resistance and ascending trendline support, hence traders should wait for the price to swing higher or lower before entering into the trade.

Trading Recommendation
Entry: 0.91690
Reason for Entry:
61.8% Fibonacci retracement and 61.8 % Fibonacci projection
Take Profit: 0.91690
Reason for Take Profit:
78.6 % Fibonacci projection
Stop Loss: 0.919325
Reason for Stop Loss:
100% FIbonacci projection and 78.6% Fibonacci retracement

Analysis are provided byInstaForex.

Best regards, PR Manager / Learn more about InstaForex Company at http://instaforex.com

Re: InstaForex Analysis

Forex Analysis & Reviews: Forecast for AUD/USD on November 10, 2021

The Australian dollar is already close to a mid-term pivot point. On a daily scale, the price with the Marlin Oscillator has almost formed a powerful double convergence. The price only needs to go down a bit, and the signal line of the oscillator will touch the line forming the convergence. The MACD line (0.7330) may not even be reached.

https://forex-images.ifxdb.com/userfiles/20211110/analytics618b2fb59cfd9_source!.jpg

A double convergence is also forming on the four-hour chart. After its completion, the trend is likely to reverse upwards. The price exit above the MACD line, above the level of 0.7433 (yesterday's high), will confirm this reversal in the mid-term trend.

https://forex-images.ifxdb.com/userfiles/20211110/analytics618b2fb59cfd9_source!.jpg

Analysis are provided byInstaForex.

Best regards, PR Manager / Learn more about InstaForex Company at http://instaforex.com

Re: InstaForex Analysis

Forex Analysis & Reviews: Forecast for EUR/USD on November 11, 2021

The euro fell by 113 points yesterday, which confirmed the variant with the formation of convergence before, as expected, a reversal into medium-term growth. The target of the movement is the 1.1448 level - the high on March 17, 2019. The price may move below the level, for example, to 1.1420, this is the level of the peaks of June 2020 and June 2019.

https://forex-images.ifxdb.com/userfiles/20211111/analytics618c85b7a75a5_source!.jpg

Of course, the strengthening of the dollar across the market was associated with a strong increase in the CPI in October estimates to 6.2% (forecast 5.8%), but the Federal Reserve needs to get data on the real sector to change its sentiment, and such data as retail sales, growth industrial production, the volume of civil construction will be next week. Investors also need this data, and therefore, after yesterday's rally, they can take a break.

https://forex-images.ifxdb.com/userfiles/20211111/analytics618c85c2b85e0_source!.jpg

On the four-hour scale, the price settled under the balance and MACD indicator lines, the Marlin Oscillator has already deeply entered the downtrend zone, so we expect the decline to slow down. We are waiting for the formation of technical reversal signs.

Analysis are provided byInstaForex.

Best regards, PR Manager / Learn more about InstaForex Company at http://instaforex.com

Re: InstaForex Analysis

Forex Analysis & Reviews: AUDNZD on bearish momentum! | 12 Nov 2021

https://forex-images.ifxdb.com/userfiles/20211112/analytics618dfbd89ea50_source!.jpg

Price is on a bearish momentum and abiding to our bearish trendline. We see potential for a bounce from our 1st resistance at 1.04277 in line with 50% Fibonacci retracement and 38.2% Fibonacci retracement and graphical overlap towards our 1st support at 1.03297 in line with 100% Fibonacci extension. Alternatively, our stop loss will be placed at 2nd resistance at 1.04617 in line with 50% Fibonacci retracement and graphical overlap. RSI is approaching levels where dips occurred previously and ichimoku is showing bearish momentum.

Trading Recommendation
Entry: 1.04277
Reason for Entry:
50% Fibonacci retracement and 38.2% Fibonacci retracement and graphical overlap.
Take Profit: 1.03297
Reason for Take Profit:
100% Fibonacci extension.
Stop Loss: 1.04617
Reason for Stop Loss:
50% Fibonacci retracement and graphical overlap.

Analysis are provided byInstaForex.

Best regards, PR Manager / Learn more about InstaForex Company at http://instaforex.com

Re: InstaForex Analysis

Trading plan for GBP/USD on November 15, 2021

https://forex-images.ifxdb.com/userfiles/20211115/analytics6191f086f0d69_source!.jpg

The GBP/USD pair's downward movement last Wednesday still leaves traces. Today, the pound has returned to its low of two weeks ago on November 5. The Weekly Control Zone 1/4 1.3446-1.3438 is set at the same mark.


These two facts speak about the importance of this zone. If the price fails to consolidate above the level of 1.3446 today and an absorption pattern is formed, then sales will come to the fore again. The first downward target is last week's low. The main medium-term target will be the WCZ 1/2 1.3283-1.3266. This makes it possible to get a favorable risk-to-profit ratio.

If today closes above the level of 1.3446, then the next target for selling the instrument will be the WCZ 1/2 1.3541-1.3524. They will find the most favorable prices for opening a short position there.


*The market analysis posted here is meant to increase your awareness, but not to give instructions to make a trade.

Best Regards,PR Manager
InstaForex Companies Group

Re: InstaForex Analysis

Forex Analysis & Reviews: USDCHF bullish momentum! | 16 Nov 2021

https://forex-images.ifxdb.com/userfiles/20211116/analytics6193340fc83d8_source!.jpg

Price is on a bullish momentum and abiding to our bullish trendline. We see potential for a bounce from our 1st support at 0.92193 in line with 23.6% Fibonacci retracement and 61.8% Fibonacci extension and graphical overlap towards our 1st resistance at 0.92647 in line with 61.8% Fibonacci extension and graphical swing high. Alternatively, our stop loss will be placed at 2nd support at 0.91883 in line with bullish trendline and graphical overlap. Technical indicators are showing bullish momentum.

Trading Recommendation
Entry: 0.92193
Reason for Entry:
23.6% Fibonacci retracement and 61.8% Fibonacci extension and graphical overlap
Take Profit: 0.92647
Reason for Take Profit:
61.8% Fibonacci extension and graphical swing high
Stop Loss: 0.91883
Reason for Stop Loss:
Bullish trendline and graphical overlap

Analysis are provided byInstaForex.

Best regards, PR Manager / Learn more about InstaForex Company at http://instaforex.com

Re: InstaForex Analysis

Forex Analysis & Reviews: Technical analysis for EUR/USD pair on November 17, 2021

The EUR/USD pair's downward impulse, which began this spring, is breaking records. A similar decline was observed in 2018 when the weakening was 10%.

At present, the decline is already 8.5% from this year's high, which indicates either the huge strength of market sellers or the huge desire of the central bank to see the Euro cheaper. In any case, this should be used in order to look for opportunities to sell this pair. This should not be done at the current levels, but any growth should be considered as a correction and look for patterns to sell the instrument.

https://forex-images.ifxdb.com/userfiles/20211117/analytics619479b658b3b_source!.jpg

It is worth noting that the pair has gone beyond the average zone for the second week in a row. This indicates that volatility is growing and it will be extremely problematic to deploy such a downward impulse. Therefore, the best solution would be to join sellers at more favorable prices.

Analysis are provided byInstaForex.

Best regards, PR Manager / Learn more about InstaForex Company at http://instaforex.com

Posts: 926 to 950 of 1,547

Pages Previous 1 36 37 38 39 40 62 Next

You must login or register to post a reply

Forex Software → Market Analysis → InstaForex Analysis

Similar topics in this forum