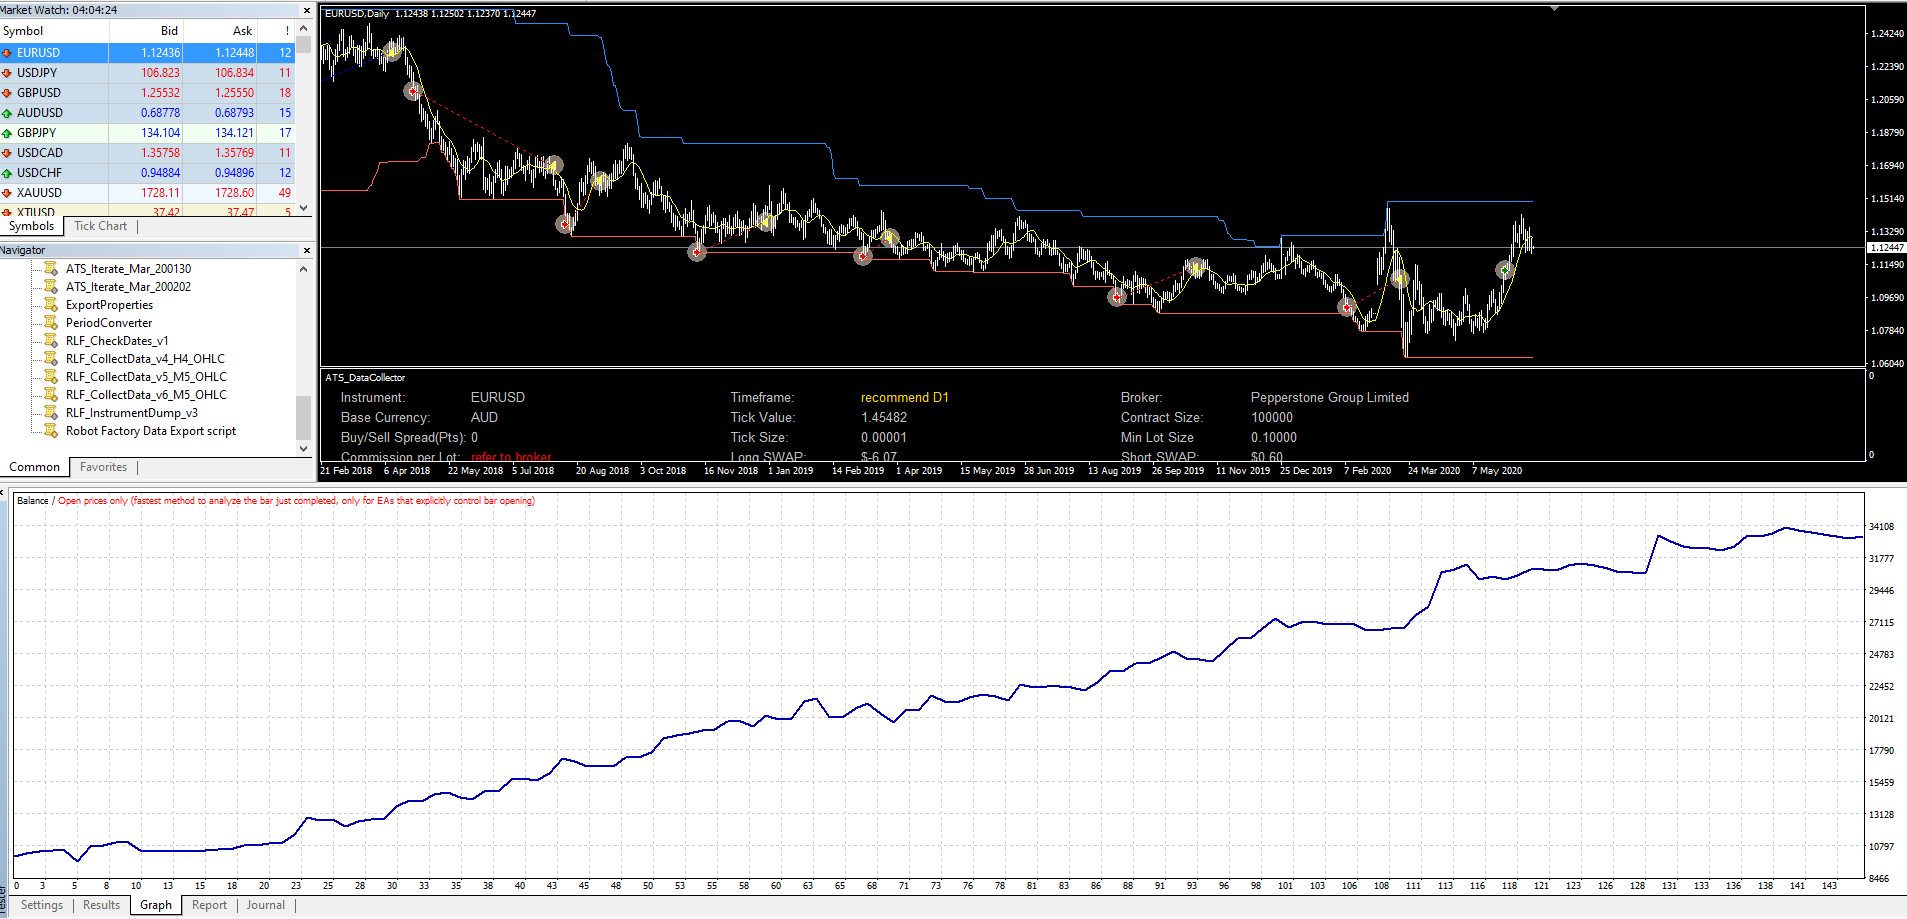
Hi Minch
Minch wrote:Thanks Rich, I am starting to like that approach more and more. I see the map to market as meaning that we are effectively waiting for the market to come to us, rather than chasing every blip on the chart. Not only is that much less frenetic than finding tightly focussed strategies, we obviously are not optimising every 10 minutes to capture the changing conditions. Since I have been optimising everything, it took a mindset change to actually turn that function off but I was surprised to see the approach still finding strategies.
That's it mate. Don't be fooled by randomness. In data mining we are looking for a bias in the data series as opposed to price action 'form' itself. Form is inherently random...but repeated form (auto-correlation) suggests that a signal may be embedded in it.
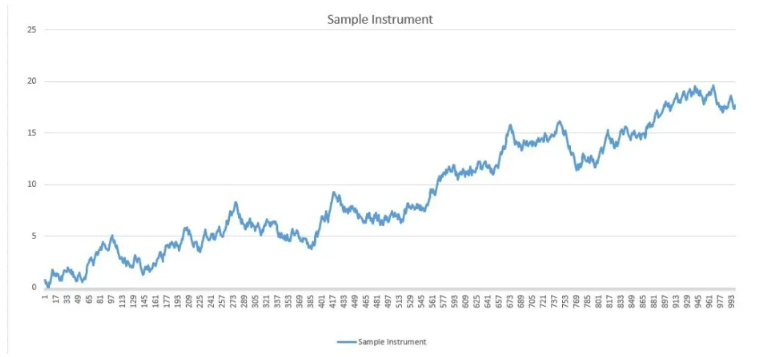
For example here is a randomly generated price chart. I know because I generated it randomly.
Here is the same price chart with serial correlation embedded in it.
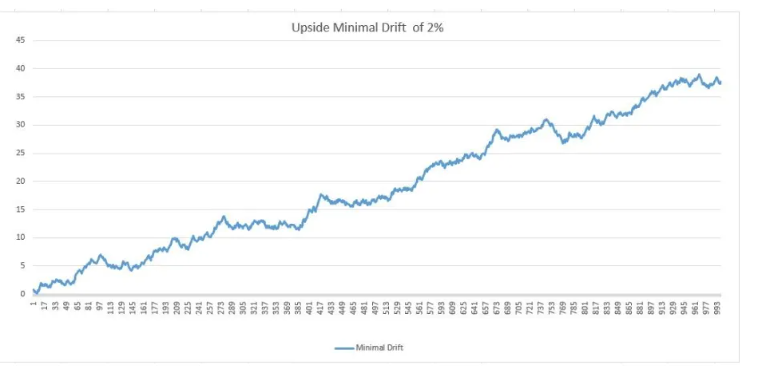
You cannot distinguish the bias with a low sample size using visual methods. The only way to do this is by plotting one chart against the other (which you cannot do when trading the right hand edge of the chart)
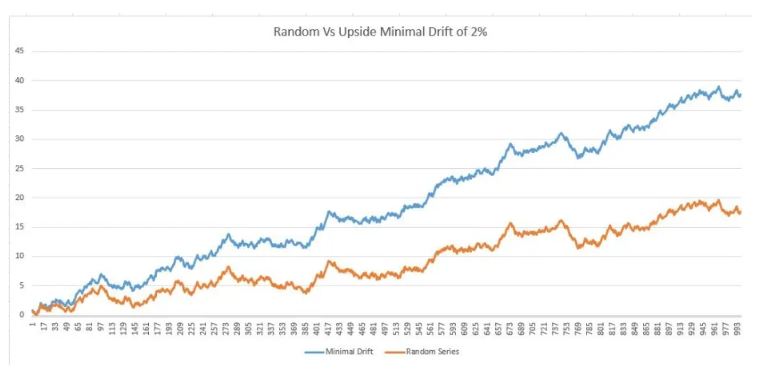
It is the bias we are after....and not the overall form. In the bias lies 'causality'. So trend followers are not simply looking for trending price (this could be random or non-random)....but are hunting for the 'divergent' bias in the price series.
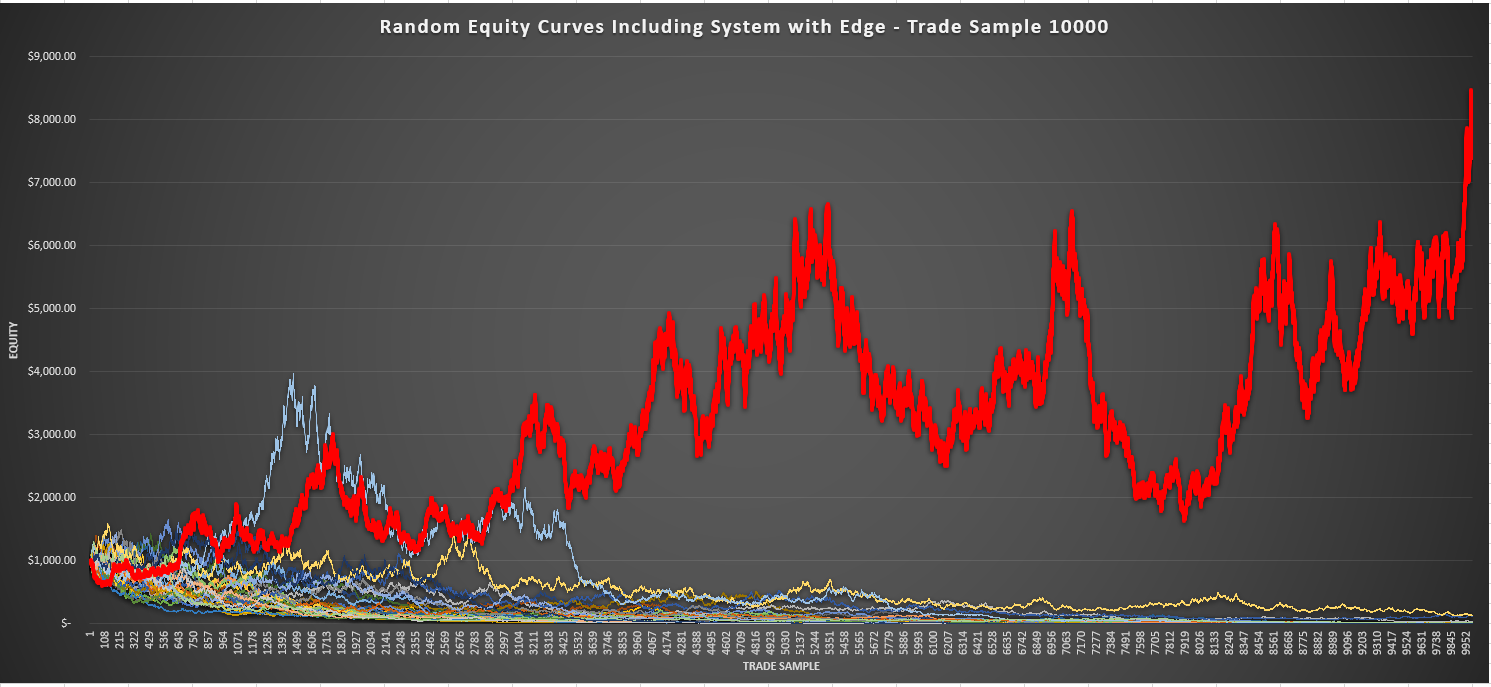
So the way we accommodate this is through trade sample size. Over many trades....the bias becomes visually self-evident. A bit like tossing a biased coin. You need many flips to conclude that there actually is a 'causal' bias in the series.
For example you cannot deduce an edge in the example below from 500 trades.

But you certainly can visually see the edge in action over 10,000 trades.
Market data is asymmetrically oriented where noise is more prevalent on the lower as opposed to the higher timeframes.
Price movement commences at the tick....and until sufficient ticks are generated, you cannot tell whether there is a bias in the underlying market data. That is why trend followers stick to longer timeframes. The principle of destructive and constructive interference of price data dampens the noise and amplifies the signal. You will not be able to discriminate between noise and signal on the lower timeframe....but the monthly chart clearly spells out where the overall direction of bias has been all along.
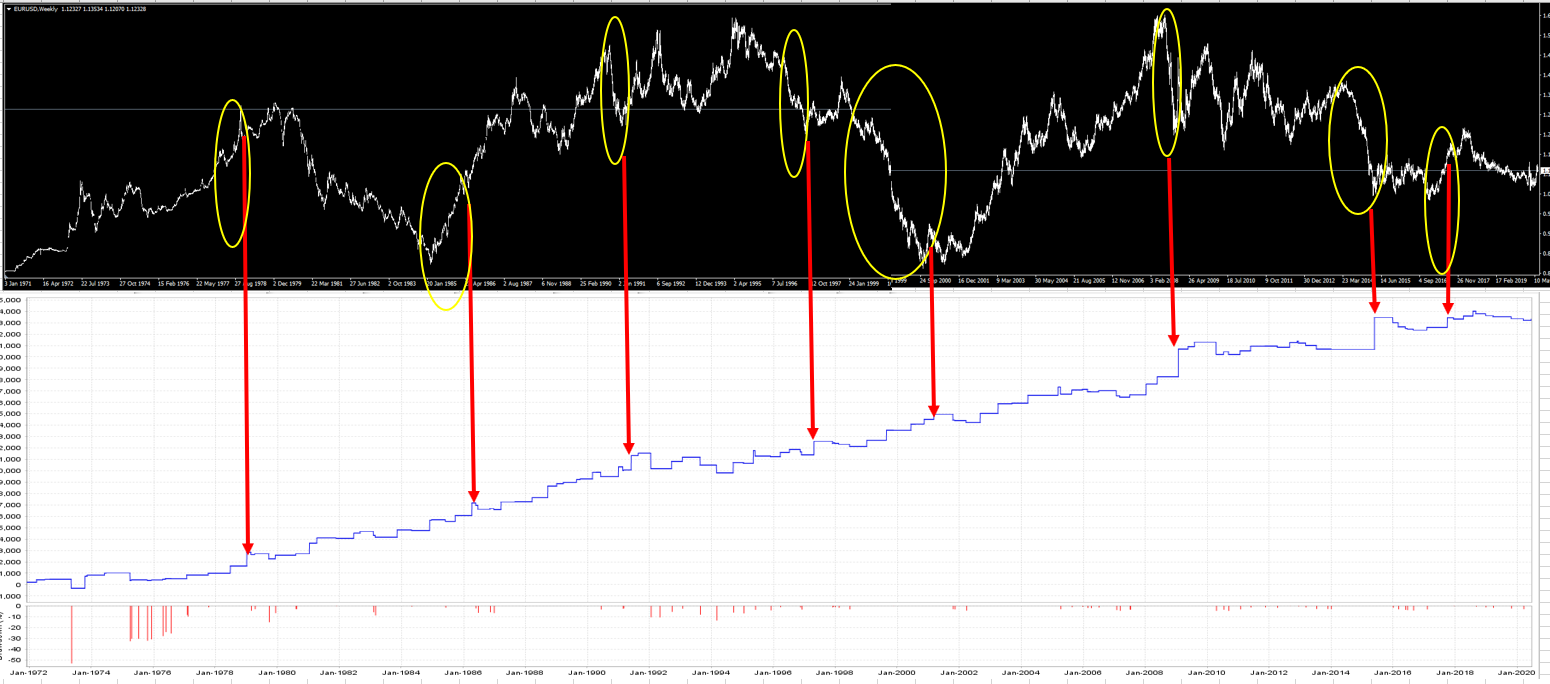
Mapping to market on the longer term timeframes (eg. D1) is the way we confirm that the strategy is active during major trends where bias is more self-evident:-)
Minch wrote:I just wanted to check something with you, if that's OK, for this approach. I am in the process of building up the library of core strategies. I am looking for 6-8 "core" strategies which utilise either one or two trend-following indicators with an additional entry indicator chosen by the software, (usually) no exit indicator and a wide stop loss which is there for comfort (and could be changed according to ATR later).
Nice mate. Just remember that you want value variation over a chosen parameter set. You want a diversified set of values to capture the broadest range of trending condition you can. The future is uncertain....and trends could take a variety of different forms.
You need diversity of stops, trailing stops, entry conditions etc. to capture different trajectories of trending condition (aka bias. The impact of noise around the bias creates many different forms of trend)
Minch wrote:It is much simpler to find entries with the single indicators, e.g where the price is above the moving average over a certain period (50, 100, 150, 200) and the exit where the price falls below the SMA for 0.5 or 0.25 of the entry (e.g. entry at 100 SMA; exit at 25 or 50 SMA) etc - that finds loads of strategies. Im happy with the SMA entries and have around 9,000 of these in some standard combinations.
Second case, above 25 ADX over certain periods (7, 14, 21, 28); then ADX over 50 for certain periods and then ADX over 75 for certain periods etc. Works OK but less strats above 75 are available but that's perhaps the lack of trends - I need to test this on alternative currencies to make sure.
Seems fine Minch. I actually only vary value sets on SMA cross rather than ADX. An 'ADX rising condition' is all I use. I am always trying to simplify my parameter sets...... so ADX actually is not regarded as a parameter set in my technique, but rather a momentum contributor present in all models (so long as it is rising).
Minch wrote:I then wanted to find Donchian but its not working out that well. If I choose "bar opens above upper band" for Donchian 200, I get 362 trades from 1971 - but 99% of these are from 1971 to 1985 ... Its the same if I add in MA, or an ADX - all the trades are bunched together.
- Do you think this is normal?
- Should I look for Donchian on a different currency instead?
- Could I ask what settings you use for Donchian here? There's no middle line available on EA so I am using "opens above upper band after opening below" in order to identify the crossover
I don't think this is the data but i cant seem to figure out why Donchian is giving me so much issue 
That is normal mate. Trending periods are clustered with long periods of mean reversion or noise in between. They key to addressing this is by market diversification across asset classes. Usually something is trending somewhere and someplace. The key thing to note is that you want to avoid over-trading so the longer the look-back the lower trade frequency....which is good as it encourages you to only catch trends of significance (where bias is more likely to lurk).
A Donchian break is a far more specific entry signal than a SMA crossover. The SMA crossover can occur anywhere in the price series and is far more frequent....but a Donchian break is specifically configured to the look-back.
Simply try and generate as many trend following strategy variations as possible and keep them all. It is only later at the portfolio compilation phase that you apply a systematic process to compile the best risk-adjusted collection....and you will be very surprised in the selections it chooses from your robust candidates.
All my Donchian break variations performed exceptionally well between 1970 to 2000....and then really slowed down post 2000. Welcome to adaptive markets. They are still really useful to have however but step out to longer look-backs to create variation.
The reason for why I really like them is that they ensure I don't get 'Type 2' errors. Those errors arising from missing an opportunity that turns into a windfall outlier. SMA crossovers frequently get the Type 2 error....while Donchian breakouts theoretically never do :-)


