forex software

Create and Test Forex Strategies

forex software

Skip to forum content

Forex Software

Create and Test Forex Strategies

You are not logged in. Please login or register.


Forex Software → Premium Club → Loading Maximum Data into EA Studio

Pages 1

You must login or register to post a reply

RSS topic feed

Posts: 14

Topic: Loading Maximum Data into EA Studio

Hi,

I am trying to get the maximum date range for EURUSD into EA Studio.

My MT4 History Center is telling me there are 13,323 records available and these go back to 1971 for D1 timeframe.
I update the history centre and use the EA Studio script to export it into a JSON file.
The onscreen message shows the following :

EURUSD1 : 200,000 bars
EURUSD5 : 200,000 bars
EURUSD15 : 200,000 bars
EURUSD30 : 200,000 bars
EURUSD60 : 139,865 bars
EURUSD240 : 21,149 bars
EURUSD1440 : 4010 bars

So I am only getting 4010 bars into EA Studio for D1 (even though there is much more available)

IN the settings popup, the maximum count of bars is set to 100,000 but even if I change this to 999,999 I still get 4010 bars exported for D1.

If I use the export csv function within the History center, for D1 I get all 13,323 records correctly, but I cannot use the CSV file to import into EA. I have tried to convert the CSV to a JSON (using the same headers as a working example) but it throws me an error message.

I get the same issue on other currencies as well - maximum data for M1, M15, M60 etc and 4000 bars for D1.

Any ideas why this is happening?

Thank you,
M

2 (edited by ats118765 2020-06-18 01:41:38)

Re: Loading Maximum Data into EA Studio

Minch wrote:

Hi,

I am trying to get the maximum date range for EURUSD into EA Studio.

My MT4 History Center is telling me there are 13,323 records available and these go back to 1971 for D1 timeframe.
I update the history centre and use the EA Studio script to export it into a JSON file.
The onscreen message shows the following :

EURUSD1 : 200,000 bars
EURUSD5 : 200,000 bars
EURUSD15 : 200,000 bars
EURUSD30 : 200,000 bars
EURUSD60 : 139,865 bars
EURUSD240 : 21,149 bars
EURUSD1440 : 4010 bars

So I am only getting 4010 bars into EA Studio for D1 (even though there is much more available)

IN the settings popup, the maximum count of bars is set to 100,000 but even if I change this to 999,999 I still get 4010 bars exported for D1.

If I use the export csv function within the History center, for D1 I get all 13,323 records correctly, but I cannot use the CSV file to import into EA. I have tried to convert the CSV to a JSON (using the same headers as a working example) but it throws me an error message.

I get the same issue on other currencies as well - maximum data for M1, M15, M60 etc and 4000 bars for D1.

Any ideas why this is happening?

Thank you,
M

Right click on the json converter script in the Navigator menu of MT4 and scroll down to the following and set date to start from say 1970. Then compile again and close.

https://atstradingsolutions.com/wp-content/uploads/2020/06/json-script.png

100000 bars will be sufficient for D1....it is the date start that is the issue.

This should get you recording say 12829 D1 bars which is sufficient to get you back to 1970 or so.

https://atstradingsolutions.com/wp-content/uploads/2020/06/Data-files-converted.png


This will then give you the date range you are after when you download the json file into EAStudio. Just make sure that the data has been cleaned and all anomalies removed. This won't affect the process...but it may affect the result of your mining activities:-)

https://atstradingsolutions.com/wp-content/uploads/2020/06/EAStudio-date-range.png

Diversification and risk-weighted returns is what this game is about

Re: Loading Maximum Data into EA Studio

Awesome, that worked a charm, thank you!

4 (edited by ats118765 2020-06-18 04:56:20)

Re: Loading Maximum Data into EA Studio

Minch wrote:

Awesome, that worked a charm, thank you!

Its a pleasure. Welcome to the world of simple but very robust long term equity curves where you can jump on board the trend following gravy train by using very long term datasets. :-)

https://atstradingsolutions.com/wp-content/uploads/2020/06/Robust-Equity-Curves.png

PS That trend following strategy was generated by EA Studio in the time it took to post that response.

How do I have the confidence that the solution is robust as a trend following strategy without conducting any alternative form of robustness measure such as Monte-Carlo or Walk forward?

You can directly 'map' the causal link between the trending price data and the impact on the equity curve. The step ups in the equity curve directly link to strongly trending environments and the stagnating sections relate to more noisy or mean reverting environments.

I refer to this robustness test as 'Mapping to to Market' .

Provided I am satisfied that the equity curve responds to the market condition I am trying to catch, then I have confidence that if markets (eg. EURUSD) trend in the future, I will be riding that bandwagon and my capital will be protected if markets are otherwise unfavourable (not trending). This is the benefit of this form of trend following model. You do not need to worry that it will possibly fall off the cliff as soon as you take it to the live trading environment. You just need to be patient and zoom out when you refer to that equity curve....as there is a lot of volatility within it....so expect drawdowns with a single solution. The way you deal with volatility of individual return streams is at the portfolio level where you compile non-correlated suites of these individual solutions into a collective. :-)

https://atstradingsolutions.com/wp-content/uploads/2020/06/Map-to-Market.png

Now the only problem with this output from EA studio is that the result is not volatility adjusted (by ATR) and the equity curve does not compound with building equity. You need to be able to then get into the code generated by EA studio and build this functionality within your solution and then test it again in MT4 to see whether robustness still holds. Then you can apply multi-market tests using the same code....provided you use ATR as your dynamic component of most of your parameter sets.

Diversification and risk-weighted returns is what this game is about

Re: Loading Maximum Data into EA Studio

Thanks Rich, I am starting to like that approach more and more. I see the map to market as meaning that we are effectively waiting for the market to come to us, rather than chasing every blip on the chart. Not only is that much less frenetic than finding tightly focussed strategies, we obviously are not optimising every 10 minutes to capture the changing conditions. Since I have been optimising everything, it took a mindset change to actually turn that function off but I was surprised to see the approach still finding strategies.

I just wanted to check something with you, if that's OK, for this approach. I am in the process of building up the library of core strategies. I am looking for 6-8 "core" strategies which utilise either one or two trend-following indicators with an additional entry indicator chosen by the software, (usually) no exit indicator and a wide stop loss which is there for comfort (and could be changed according to ATR later).

It is much simpler to find entries with the single indicators, e.g where the price is above the moving average over a certain period (50, 100, 150, 200) and the exit where the price falls below the SMA for 0.5 or 0.25 of the entry (e.g. entry at 100 SMA; exit at 25 or 50 SMA) etc - that finds loads of strategies. Im happy with the SMA entries and have around 9,000 of these in some standard combinations.

Second case, above 25 ADX over certain periods (7, 14, 21, 28); then ADX over 50 for certain periods and then ADX over 75 for certain periods etc. Works OK but less strats above 75 are available but that's perhaps the lack of trends - I need to test this on alternative currencies to make sure.

I then wanted to find Donchian but its not working out that well. If I choose "bar opens above upper band" for Donchian 200, I get 362 trades from 1971 - but 99% of these are from 1971 to 1985 ... Its the same if I add in MA, or an ADX - all the trades are bunched together.

- Do you think this is normal?
- Should I look for Donchian on a different currency instead?
- Could I ask what settings you use for Donchian here? There's no middle line available on EA so I am using "opens above upper band after opening below" in order to identify the crossover

I dont think this is the data but i cant seem to figure out why Donchian is giving me so much issue sad

Re: Loading Maximum Data into EA Studio

One way around it, possibly, is to set the Available Indicators for the entry to a select few trend indicators (Donchian, SMA, Bollinger, ADX and few others that I like) and leave all the exit indicators in - then just run this to create a library of strats.

That would be a much easier task if we could save more than 100 strats at a time, though!

7 (edited by ats118765 2020-06-23 06:38:52)

Re: Loading Maximum Data into EA Studio

Hi Minch

Minch wrote:

Thanks Rich, I am starting to like that approach more and more. I see the map to market as meaning that we are effectively waiting for the market to come to us, rather than chasing every blip on the chart. Not only is that much less frenetic than finding tightly focussed strategies, we obviously are not optimising every 10 minutes to capture the changing conditions. Since I have been optimising everything, it took a mindset change to actually turn that function off but I was surprised to see the approach still finding strategies.

That's it mate. Don't be fooled by randomness. In data mining we are looking for a bias in the data series as opposed to price action 'form' itself. Form is inherently random...but repeated form (auto-correlation) suggests that a signal may be embedded in it.

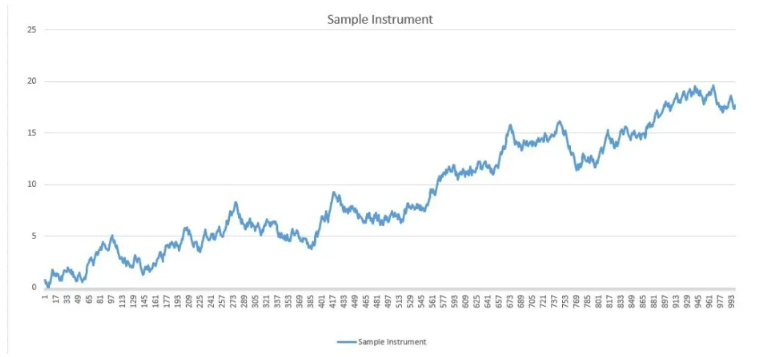
For example here is a randomly generated price chart. I know because I generated it randomly.

https://atstradingsolutions.com/wp-content/uploads/2020/06/Random-Chart.png

Here is the same price chart with serial correlation embedded in it.

https://atstradingsolutions.com/wp-content/uploads/2020/06/Random-plus-bias.png

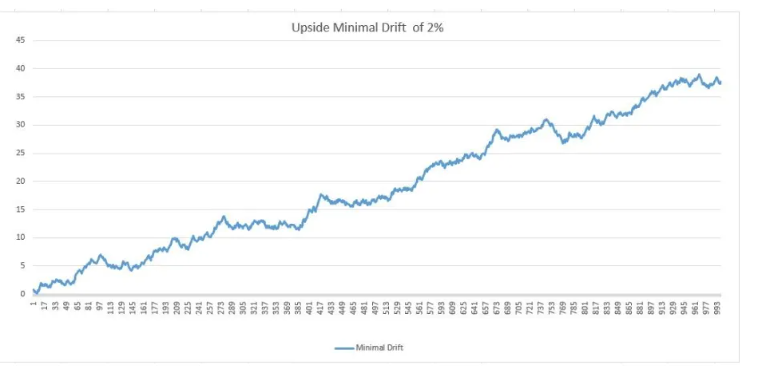
You cannot distinguish the bias with a low sample size using visual methods. The only way to do this is by plotting one chart against the other (which you cannot do when trading the right hand edge of the chart)

https://atstradingsolutions.com/wp-content/uploads/2020/06/Random-vs-Random-plus-bias.png

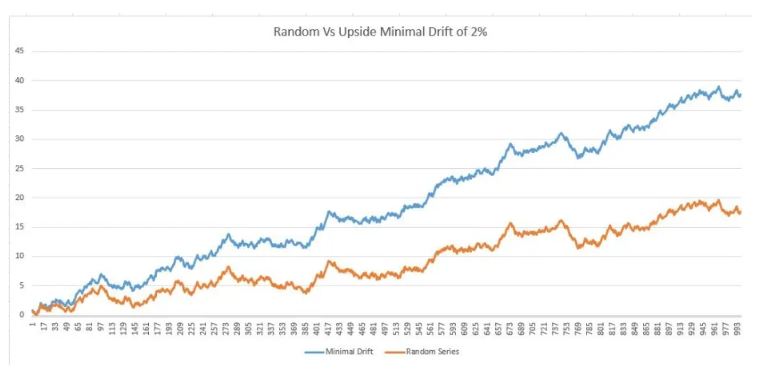
It is the bias we are after....and not the overall form. In the bias lies 'causality'. So trend followers are not simply looking for trending price (this could be random or non-random)....but are hunting for the 'divergent' bias in the price series.

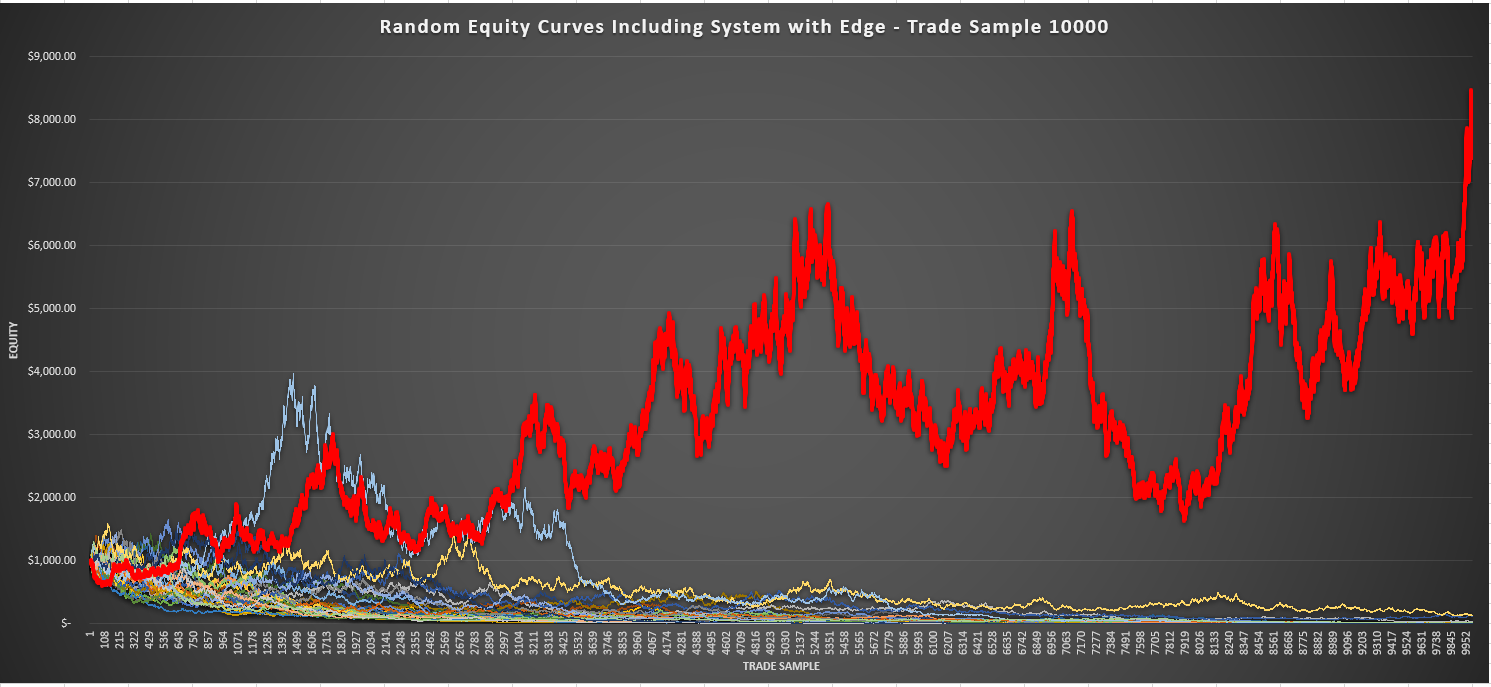
So the way we accommodate this is through trade sample size. Over many trades....the bias becomes visually self-evident. A bit like tossing a biased coin. You need many flips to conclude that there actually is a 'causal' bias in the series.

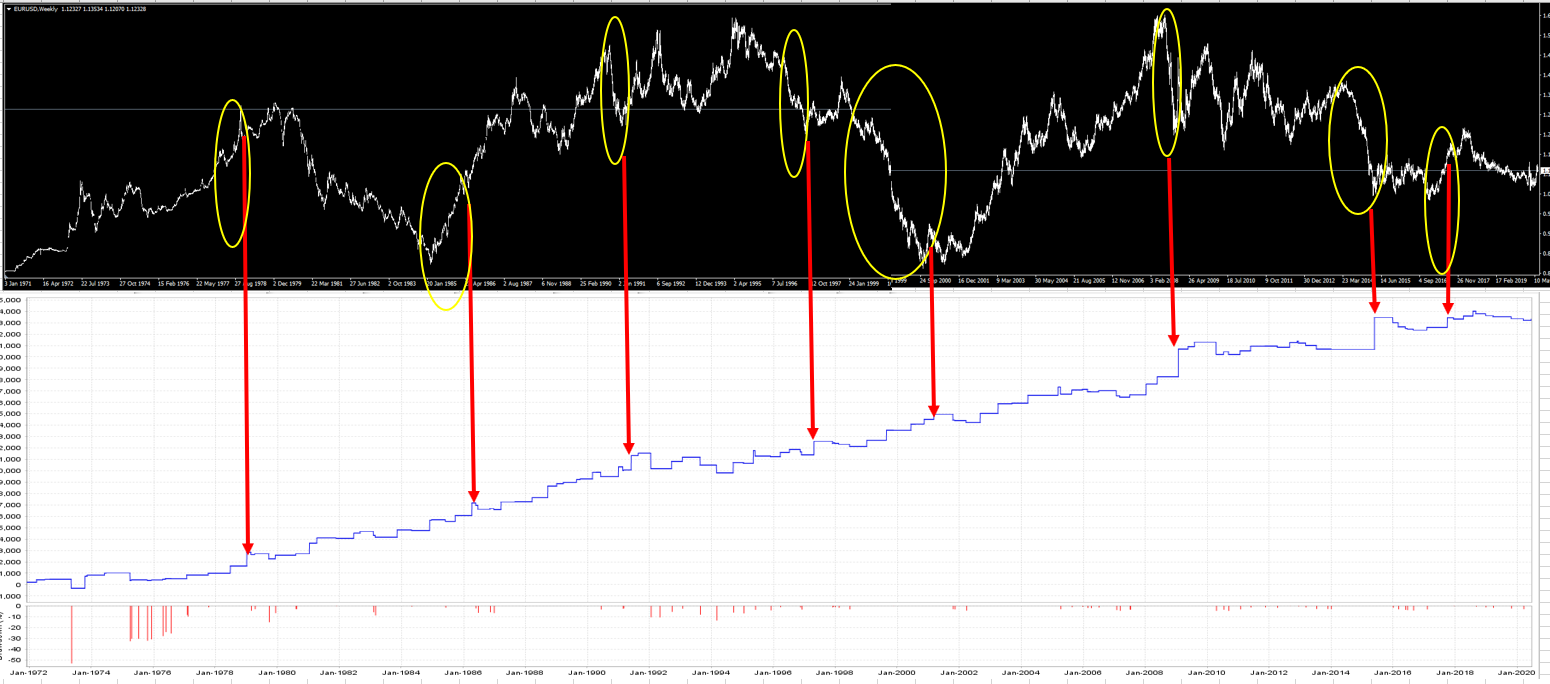
For example you cannot deduce an edge in the example below from 500 trades.

https://atstradingsolutions.com/wp-content/uploads/2020/06/Trade-Sample-size-500.png

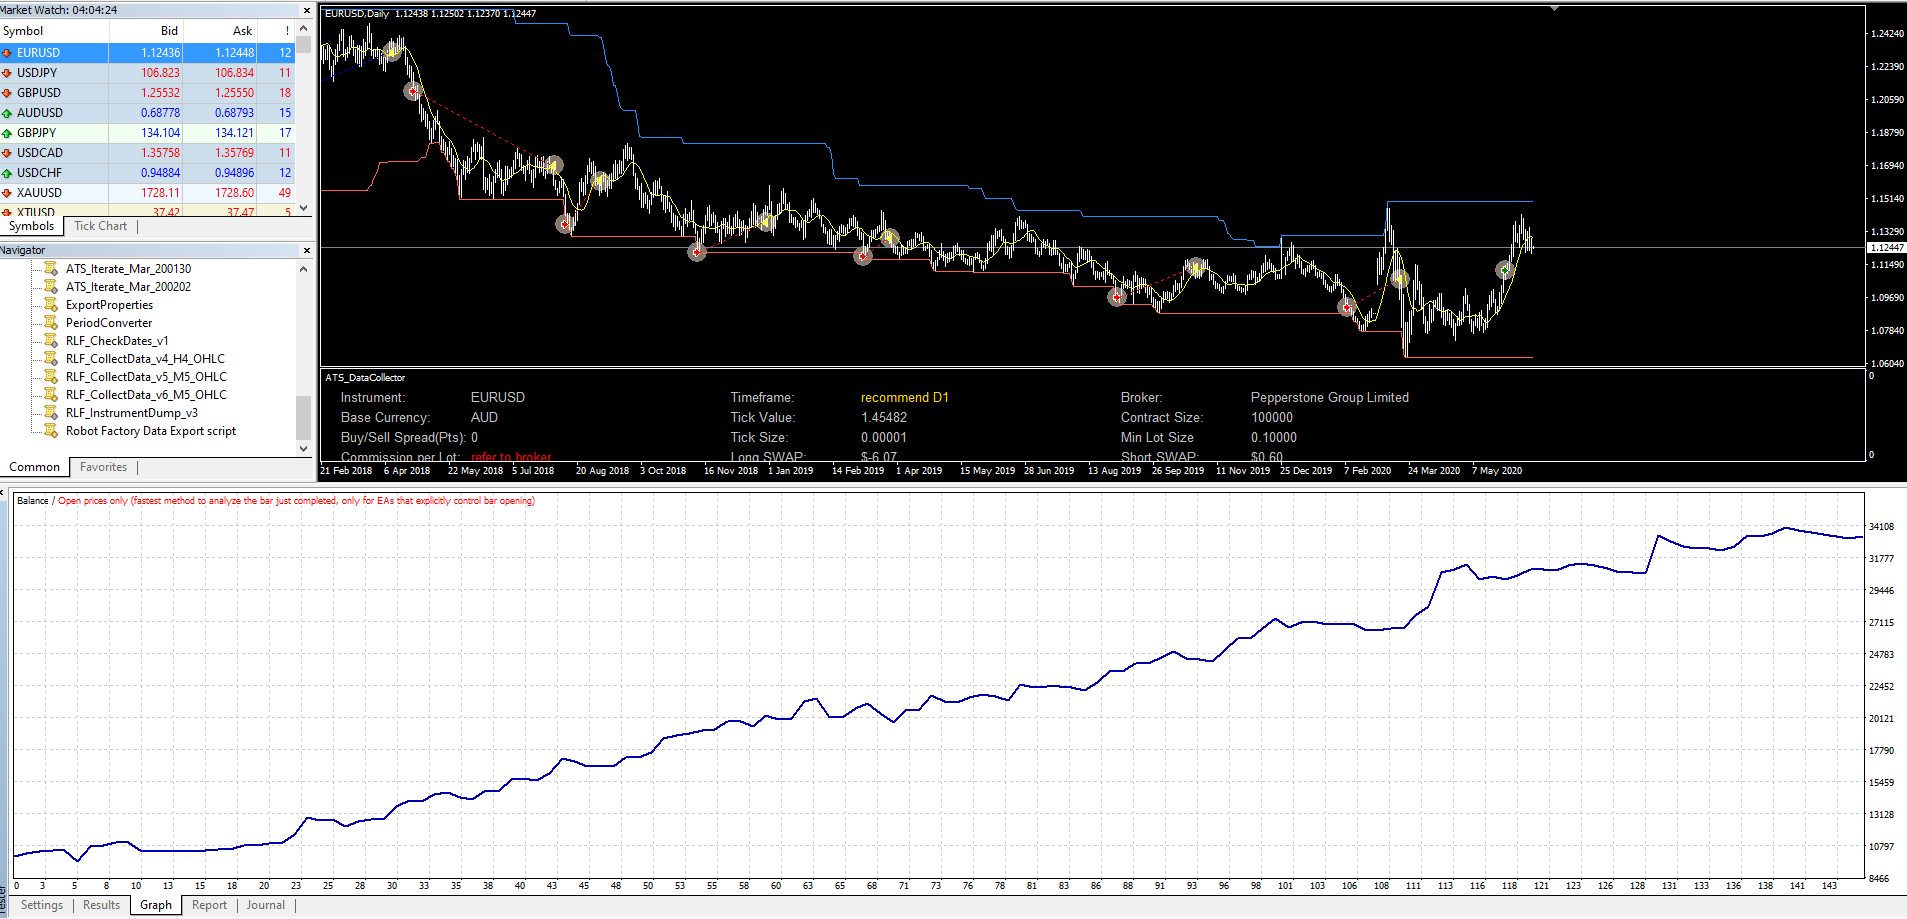
But you certainly can visually see the edge in action over 10,000 trades.

https://atstradingsolutions.com/wp-content/uploads/2020/06/Trade-Sample-size-10000.png


Market data is asymmetrically oriented where noise is more prevalent on the lower as opposed to the higher timeframes.

Price movement commences at the tick....and until sufficient ticks are generated, you cannot tell whether there is a bias in the underlying market data. That is why trend followers stick to longer timeframes. The principle of destructive and constructive interference of price data dampens the noise and amplifies the signal. You will not be able to discriminate between noise and signal on the lower timeframe....but the monthly chart clearly spells out where the overall direction of bias has been all along.

Mapping to market on the longer term timeframes (eg. D1) is the way we confirm that the strategy is active during major trends where bias is more self-evident:-) 


Minch wrote:

I just wanted to check something with you, if that's OK, for this approach. I am in the process of building up the library of core strategies. I am looking for 6-8 "core" strategies which utilise either one or two trend-following indicators with an additional entry indicator chosen by the software, (usually) no exit indicator and a wide stop loss which is there for comfort (and could be changed according to ATR later).

Nice mate. Just remember that you want value variation over a chosen parameter set. You want a diversified set of values to capture the broadest range of trending condition you can. The future is uncertain....and trends could take a variety of different forms.

You need diversity of stops, trailing stops, entry conditions etc. to capture different trajectories of trending condition (aka bias. The impact of noise around the bias creates many different forms of trend)

Minch wrote:

It is much simpler to find entries with the single indicators, e.g where the price is above the moving average over a certain period (50, 100, 150, 200) and the exit where the price falls below the SMA for 0.5 or 0.25 of the entry (e.g. entry at 100 SMA; exit at 25 or 50 SMA) etc - that finds loads of strategies. Im happy with the SMA entries and have around 9,000 of these in some standard combinations.

Second case, above 25 ADX over certain periods (7, 14, 21, 28); then ADX over 50 for certain periods and then ADX over 75 for certain periods etc. Works OK but less strats above 75 are available but that's perhaps the lack of trends - I need to test this on alternative currencies to make sure.

Seems fine Minch. I actually only vary value sets on SMA cross rather than ADX. An 'ADX rising condition' is all I use. I am always trying to simplify my parameter sets...... so ADX actually is not regarded as a parameter set in my technique, but rather a momentum contributor present in all models (so long as it is rising).

Minch wrote:

I then wanted to find Donchian but its not working out that well. If I choose "bar opens above upper band" for Donchian 200, I get 362 trades from 1971 - but 99% of these are from 1971 to 1985 ... Its the same if I add in MA, or an ADX - all the trades are bunched together.

- Do you think this is normal?
- Should I look for Donchian on a different currency instead?
- Could I ask what settings you use for Donchian here? There's no middle line available on EA so I am using "opens above upper band after opening below" in order to identify the crossover

I don't think this is the data but i cant seem to figure out why Donchian is giving me so much issue sad

That is normal mate. Trending periods are clustered with long periods of mean reversion or noise in between. They key to addressing this is by market diversification across asset classes. Usually something is trending somewhere and someplace. The key thing to note is that you want to avoid over-trading so the longer the look-back the lower trade frequency....which is good as it encourages you to only catch trends of significance (where bias is more likely to lurk).

A Donchian break is a far more specific entry signal than a SMA crossover. The SMA crossover can occur anywhere in the price series and is far more frequent....but a Donchian break is specifically configured to the look-back.

Simply try and generate as many trend following strategy variations as possible and keep them all. It is only later at the portfolio compilation phase that you apply a systematic process to compile the best risk-adjusted collection....and you will be very surprised in the selections it chooses from your robust candidates.

All my Donchian break variations performed exceptionally well between 1970 to 2000....and then really slowed down post 2000. Welcome to adaptive markets. They are still really useful to have however but step out to longer look-backs to create variation.

The reason for why I really like them is that they ensure I don't get 'Type 2' errors. Those errors arising from missing an opportunity that turns into a windfall outlier. SMA crossovers frequently get the Type 2 error....while Donchian breakouts theoretically never do :-)

Diversification and risk-weighted returns is what this game is about

Re: Loading Maximum Data into EA Studio

Awesome, thank you - that has put me back on track with the process - I was trying to be systematic in finding my strategies, and was looking at specific combinations of indicators in set combinations and set parameters, so that threw me when the Donchian started being sluggish - it was going to lop-side my approach since that indicator wasn't going to be well represented in my library.

I was cross- referencing on MT4 as well to see what might happen under certain conditions with the Donchian and I never really saw the price breaking through the upper channel, more often it was skirting the channel and the value from the indicator seemed, at least from what I was reading, to be more in the middle channel (i.e breaking above the average of the highest high and lowest low)  - and the middle channel doesn't figure in the EA Studio dropdown. Perhaps we can add that onto the EA wish list.

In any case, being "overly systematic" isn't necessarily going to work in my favour either - in selecting my available trend indicators (plus a couple of favourites) for the entries, anything for the exits, and then effectively randomising the parameters, its possible to build the library quite quickly and - through the randomisation, you just need to have a large enough library to make sure a wide range of parameters is represented. So, 20,000 strats looks to be a good starting point.

Anyway, through limiting the entry indicators, there are indeed some Donchians in there too, so it must work - by my selecting set values, I was perhaps making things more difficult than they needed to be.

Cheers,
Matthew

9 (edited by ats118765 2020-06-25 08:42:21)

Re: Loading Maximum Data into EA Studio

Minch wrote:

Awesome, thank you - that has put me back on track with the process - I was trying to be systematic in finding my strategies, and was looking at specific combinations of indicators in set combinations and set parameters, so that threw me when the Donchian started being sluggish - it was going to lop-side my approach since that indicator wasn't going to be well represented in my library.

Great stuff Minch :-)

To give you an idea I currently use two core trend following methods and 2 supplemental momentum methods in my trend following arsenal. Ideally you need many more of these core models...but you have to start somewhere :-)

These 2 broad different trend following system designs revolve around two separate entry methods. One uses a momentum breakout method of entry (using the Donchian) and the other a more classic trend following entry method (using SMA crossover technique). Both of these are found in the trend following literature of the professional FM's.

These core methods are the major 'drivers' of long term wealth building.

The supplemental variations are used to simply smooth the volatility of these two core methods by targeting shorter term trend segments and take some of the profit off the table with the very long trending conditions and deal with the unrealised losses that occur when the trend ends. They are not the drivers of profitability but simply used to smooth the curves. Ideally with significant trading capital you would elect to diversify more widely using the core trend following models only......so the supplemental variations are really only helpful if you cannot diversify wide enough in system design.

You will find that the supplemental methods often 'hedge' the longer term models when it counts. For example.....the long term trend following models can build significant unrealised profits before the 'trend ends' and we often find that when a long term method is now at the end of the trending phase and you start seeing some of that great profit now being eaten away ....the supplemental methods are already locked into the 'turn' in a counter-trend direction to the longer term models and building profits. The hedging process at the end of the long term trend helps to smooth the equity curve at the portfolio level when they are all consolidated.

What is critical is the need for 'diversification of core systems and parameter variations'. This makes you far more robust in being able to target a very large array of different trend forms and segments of the trending condition. This diversification gives robustness in an uncertain future where the 'exact form of trend' is not known....and also serves to significantly increase trade frequency at the portfolio level. Each solution has low frequency as that 'required' condition is few and far between....but together as a diversified portfolio you have many trending opportunities.

So in the first stage of my workflow process I am simply focused on finding a vast array of 'robust' solutions that have stood the test of time to see if there is any design weakness in the assumptions (without biasing the result with current costs such as SWAP, spread etc)........and have a sufficient array of robust performers to take me into the next phase of the robustness process where I select the better recent performers in this reduced subset of opportunities that respond to adaptive trending conditions and also have current trading costs embedded in them.

Across 31 markets, I generate currently a total possible 61,515 permutations which equates to 1,905,965 return streams. The very first stage of robustness testing before I take them to multi-market reduces this set from 1,905,965 to  1,338,876 return streams offering positive expectancy (Gross profit basis). Currently approx 70% pass the very first test across 35 years of market data before they are assessed for their multi-market potential to further test whether an edge (bias is present)

Within this passed set lies extensive diversification and positive expectation which is all you need to build powerful robust portfolios. Provided you have a weak edge in the result at 0.01 lots (for EA Studio) or preferably 0.5% trade risk.....then that is all we are initially after. You do not attempt to apply leverage to that 'edge' with position sizing techniques and target desired drawdown thresholds until you are at the portfolio level of processing.

It is like trying to create the strongest basket with individual threads but during the robustness phase you are looking for the strongest threads to start the process of basket-weaving.

Doing it this way will ensure your EAs won't fall off the cliff when you implement them live. You have 31 x 35 years of market data that tells you that this simply is very unlikely and significantly builds your confidence in letting them run unhindered and not be tempted to intervene in the process by knee jerk reactions whenever they enter very natural drawdown phases.

You will also find that the end result over the long term are performance results that match the trend following FM's as opposed to performance results that are unbelievable 'profitable' in backtest.

Diversification and risk-weighted returns is what this game is about

Re: Loading Maximum Data into EA Studio

That's awesome, thank you so much for everything.

I have been running my map to market in demo for 3 weeks now and I see some good results, although it's appreciated this is only on a very short timeframe so far.

One thing - I keep checking it and tempted to change the stop loss the whole time. The SL generated by the software seem quite high (since these have been calculated over the "optimised" timeframe of many years, as opposed to current ATR etc) ... would you advise to leave these and let the strategies run or do you manually adjust the stop loss?

Cheers,
Matthew

11 (edited by ats118765 2020-07-27 09:38:59)

Re: Loading Maximum Data into EA Studio

Minch wrote:

That's awesome, thank you so much for everything.

I have been running my map to market in demo for 3 weeks now and I see some good results, although it's appreciated this is only on a very short timeframe so far.

One thing - I keep checking it and tempted to change the stop loss the whole time. The SL generated by the software seem quite high (since these have been calculated over the "optimised" timeframe of many years, as opposed to current ATR etc) ... would you advise to leave these and let the strategies run or do you manually adjust the stop loss?

Cheers,
Matthew

Hi Minch

I would leave them as dictated by the strategy generator.

Attached is a file of a typical robust Donchian breakout system applied to EURUSD. You will see the settings applied in yellow. This gives you an idea of the broad settings and ranges of these settings that can navigate really long term data sets.

Rank the listing by MAR to see the better performers.

Post's attachments

EURUSD_Don_MAR_D1_ST2.csv 22.85 kb, 12 downloads since 2020-07-27 

You don't have the permssions to download the attachments of this post.
Diversification and risk-weighted returns is what this game is about

Re: Loading Maximum Data into EA Studio

Hi Rich,

OK good, I am going to leave them as is. I had a week where I tampered with the SL and TSL and started to look at ATR, S&R levels, Standard Deviations and all the other good stuff, but I actually didn't see that much more impact than if I had just left them alone as generated by the system.

The latter option is way less work anyway and, if that did mean a lower return overall, I would be willing to accept it in lieu of peering into my phone at ATR levels. So, that's settled and its appreciated that you confirmed the approach. Later on, I may run a few different accounts on different SL strategies but for the moment, I like the simplicity.

Thanks as well for the Donchian examples - yes, large values. I am learning more and more to be loose in the approach and - even through initially - this was less intuitive than tight optimisation, the results are looking decent so far.

As an example, I search initially for strategies based on 30 years of data, with only RDD>0.1 and R Squared >10 to give it a bit of a direction. fast forward to the end of the process and its really surprising to me (and exciting) that I end up with 40-50 strategies which look like I optimised them specifically, but which then work on multi timeframes (30 years, 20 years, 10 years, 5 years) and multi currency as well. Pretty robust for my current needs - and certainly alot of room to improve over time

Much obliged,
Matthew

Re: Loading Maximum Data into EA Studio

Minch wrote:

OK good, I am going to leave them as is. I had a week where I tampered with the SL and TSL and started to look at ATR, S&R levels, Standard Deviations and all the other good stuff, but I actually didn't see that much more impact than if I had just left them alone as generated by the system.

Cheers Matthew. As you will deduce the Trend Following game is played with many diversified systems with each system only contributing a small handful of trades that clearly attack the trending condition. The range of systems is to allow for trend trajectory variation in a particular market yet each system applied to that market has low correlation with each other.

You do this on a market by market basis until you are comprehensively diversified in both systems and markets. This gives you increased trade frequency as a comprehensive portfolio that strictly attack the trending condition and keep away from the noise and mean reverting environment.

An then hey presto......it just works without you have to continuously replace your strategies. Rebalancing is done on an fairly infrequent basis when compared to 'convergent' methods that need to be continuously rebalanced and even then..you don't know the true risk you are holding and whether it 'all of a sudden' heads towards risk of ruin :-)

Diversification and risk-weighted returns is what this game is about

Re: Loading Maximum Data into EA Studio

Exactly, thank you, its that constant rebalancing I am looking to avoid. I will be adding in 10 more currencies for August until I have all 28 combinations and then building up some additional core strats. I have been researching indicators and strategies and approaches for almost 2 years now, and this finally feels like the right direction. All I need to do is get the collection size issue sorted out and I will be away.

Posts: 14

Pages 1

You must login or register to post a reply

Forex Software → Premium Club → Loading Maximum Data into EA Studio

Similar topics in this forum